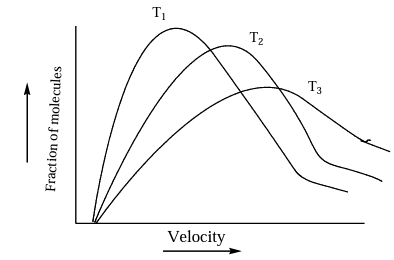
According to Maxwell ,Boltzmann distribution of energy………..
the fraction of molecules with most probable kinetic energy decreases at higher tempreratures.
the fration of molecules with most probable kinetic energy increases at higher temperatures.
Most probable kinetic energy increases at higher temperatures
most probable kinetic energy decreases at higher temperatures
The correct Answer is:(A),(C )

From the graph it is clear,
(A)As the temperature increases the fraction of molecule at given kinetic energy decreases and height of graph decreases.
(D)As the temperature increases the graph shift towards right side and kinetic energy increases.
Topper's Solved these Questions
- CHEMICAL KINETICSBOOK - KUMAR PRAKASHANCHAPTER - CHEMICAL KINETICSEXERCISE - Section-D (Short Answer Type Question)
20 Videos
- CHEMICAL KINETICSBOOK - KUMAR PRAKASHANCHAPTER - CHEMICAL KINETICSEXERCISE - Section-D (Matching The columns)
4 Videos
- CHEMICAL KINETICSBOOK - KUMAR PRAKASHANCHAPTER - CHEMICAL KINETICSEXERCISE - Section-D (NCERT Exemplar Solution)(Multiple Choice Quetions)
20 Videos
- BOARD EXAM QUESTION PAPER MARCH - 2020 BOOK - KUMAR PRAKASHANCHAPTER - BOARD EXAM QUESTION PAPER MARCH - 2020 EXERCISE - PART -B
23 Videos
- CHEMISTRY IN EVERYDAY LIFEBOOK - KUMAR PRAKASHANCHAPTER - CHEMISTRY IN EVERYDAY LIFEEXERCISE - SECTION - E (MCQs ASKED IN GUJCET/BOARD EXAM)
37 Videos
Similar Questions
Knowledge Check
According to Maxwell , Boltzmann distriubtion of energy ……… .
Athe fraction of moleucles with most probable kinetic enegy decreases at higher temperaturesBthe fraction of moleucles with most probable kinetic enegy increases at higher temperaturesCmost probable kinetic energy increases at higher temperatureDmost probable kinetic energy decreases at higher temperatureIn the graph showing Maxwell Boltzmann distribution of energy ................ .
Aarea under the curve must not change with increase in temperatureBarea under the curve increases with increases in temperatureCarea under the curve decreases with increase in temperatureDwith increase in temperature curve broadens and shifts to the right hand side.In the graph showing Maxwell Boltzmann distribution of energy ................ .
Aarea under the curve increases with increase in temperatureBarea under the curve decreases with increase in temperatureCwith increase in temperature curve broadens and shifts to the right hand side.Das a gas cools to a lower temperature, the peak of the graph shifts to the left
In the following graph of Maxwell - Boltzmann distribution of molecular velocities . Which of the following is the correct order of temperature ?

View SolutionIn the graph showing Maxwell, Boltzmann distribution of energy ……….. .
View SolutionIn the graph showing Maxwell Boltzman distribution of energy, ________.
View SolutionThe maximum in the curves describing the Maxwell-Boltzmann distribution of speeds corresponds to
View SolutionAssertion : In Maxwell - Boltzmann distribution of speeds , the curve broadens at higher temperature .
Reason : At a particular temperature , the individual speed of molecules as well as the distribution of speeds remains the same .
View Solution
