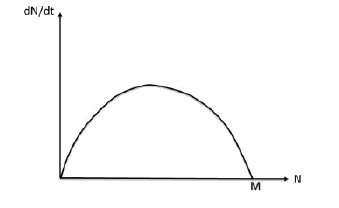
In the graph below. where N is population size and tis time. M represents

specific growth rate.
median population size.
carrying capacity.
minimum population size without going extinct.
Step by step video & image solution for In the graph below. where N is population size and tis time. M represents by Biology experts to help you in doubts & scoring excellent marks in Class 12 exams.
Updated on:21/07/2023Similar Questions
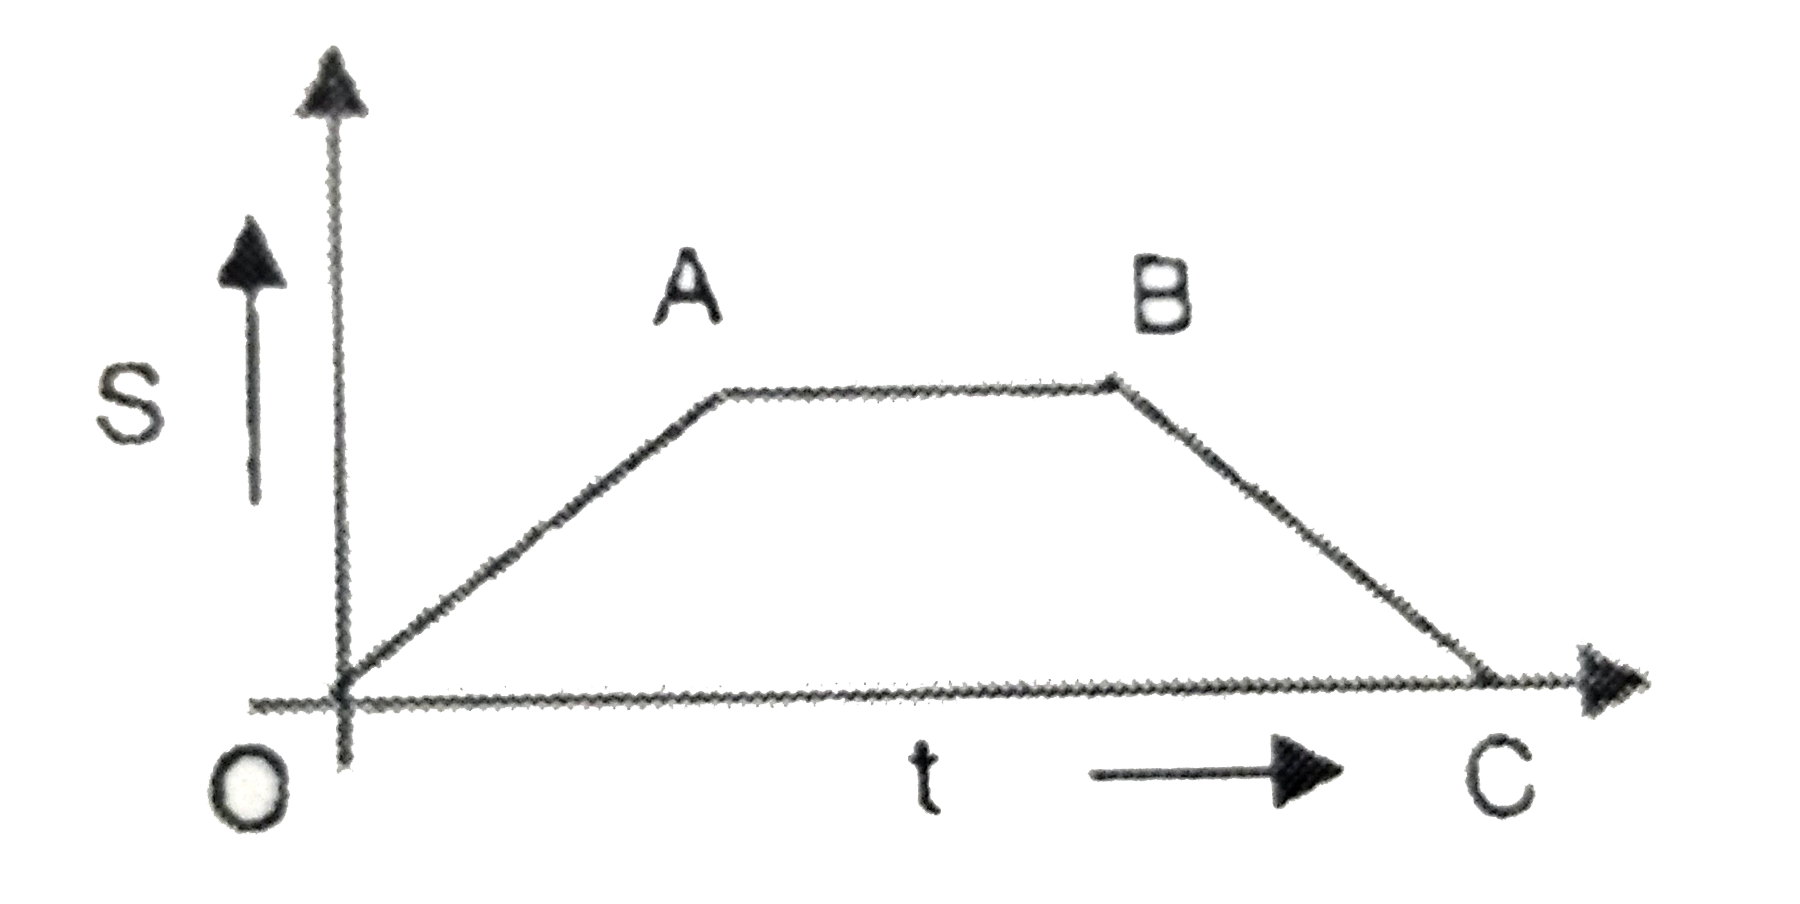
The displacement-time graph of a body is shown in the figure below. The part of the graph that represents the uniform motion of the body is _________

View Solution(a) Write an equation for Verhulst Pearl logistic . Growth where
N = Population density at a time t
r = Intrinsic rate of natural increase
K = Carrying capacity
(b) Draw a graph for a population whose population density has reached the carrying capacity .
(c) Why is the logistic growth model considered a more reallistic one for most animal populations ?
(d) Draw a growth curve where resources are not limiting to growth of a population.
View Solution
Knowledge Check
In the graph below. where N is population size and tis time. M represents
 Aspecific growth rate.BMedian population sizeCcarrying capacityDminimum population size without going extinct.
If b is represent → birth rate
If d is represent → death rate
if dN is represent → increase or decrease in population size
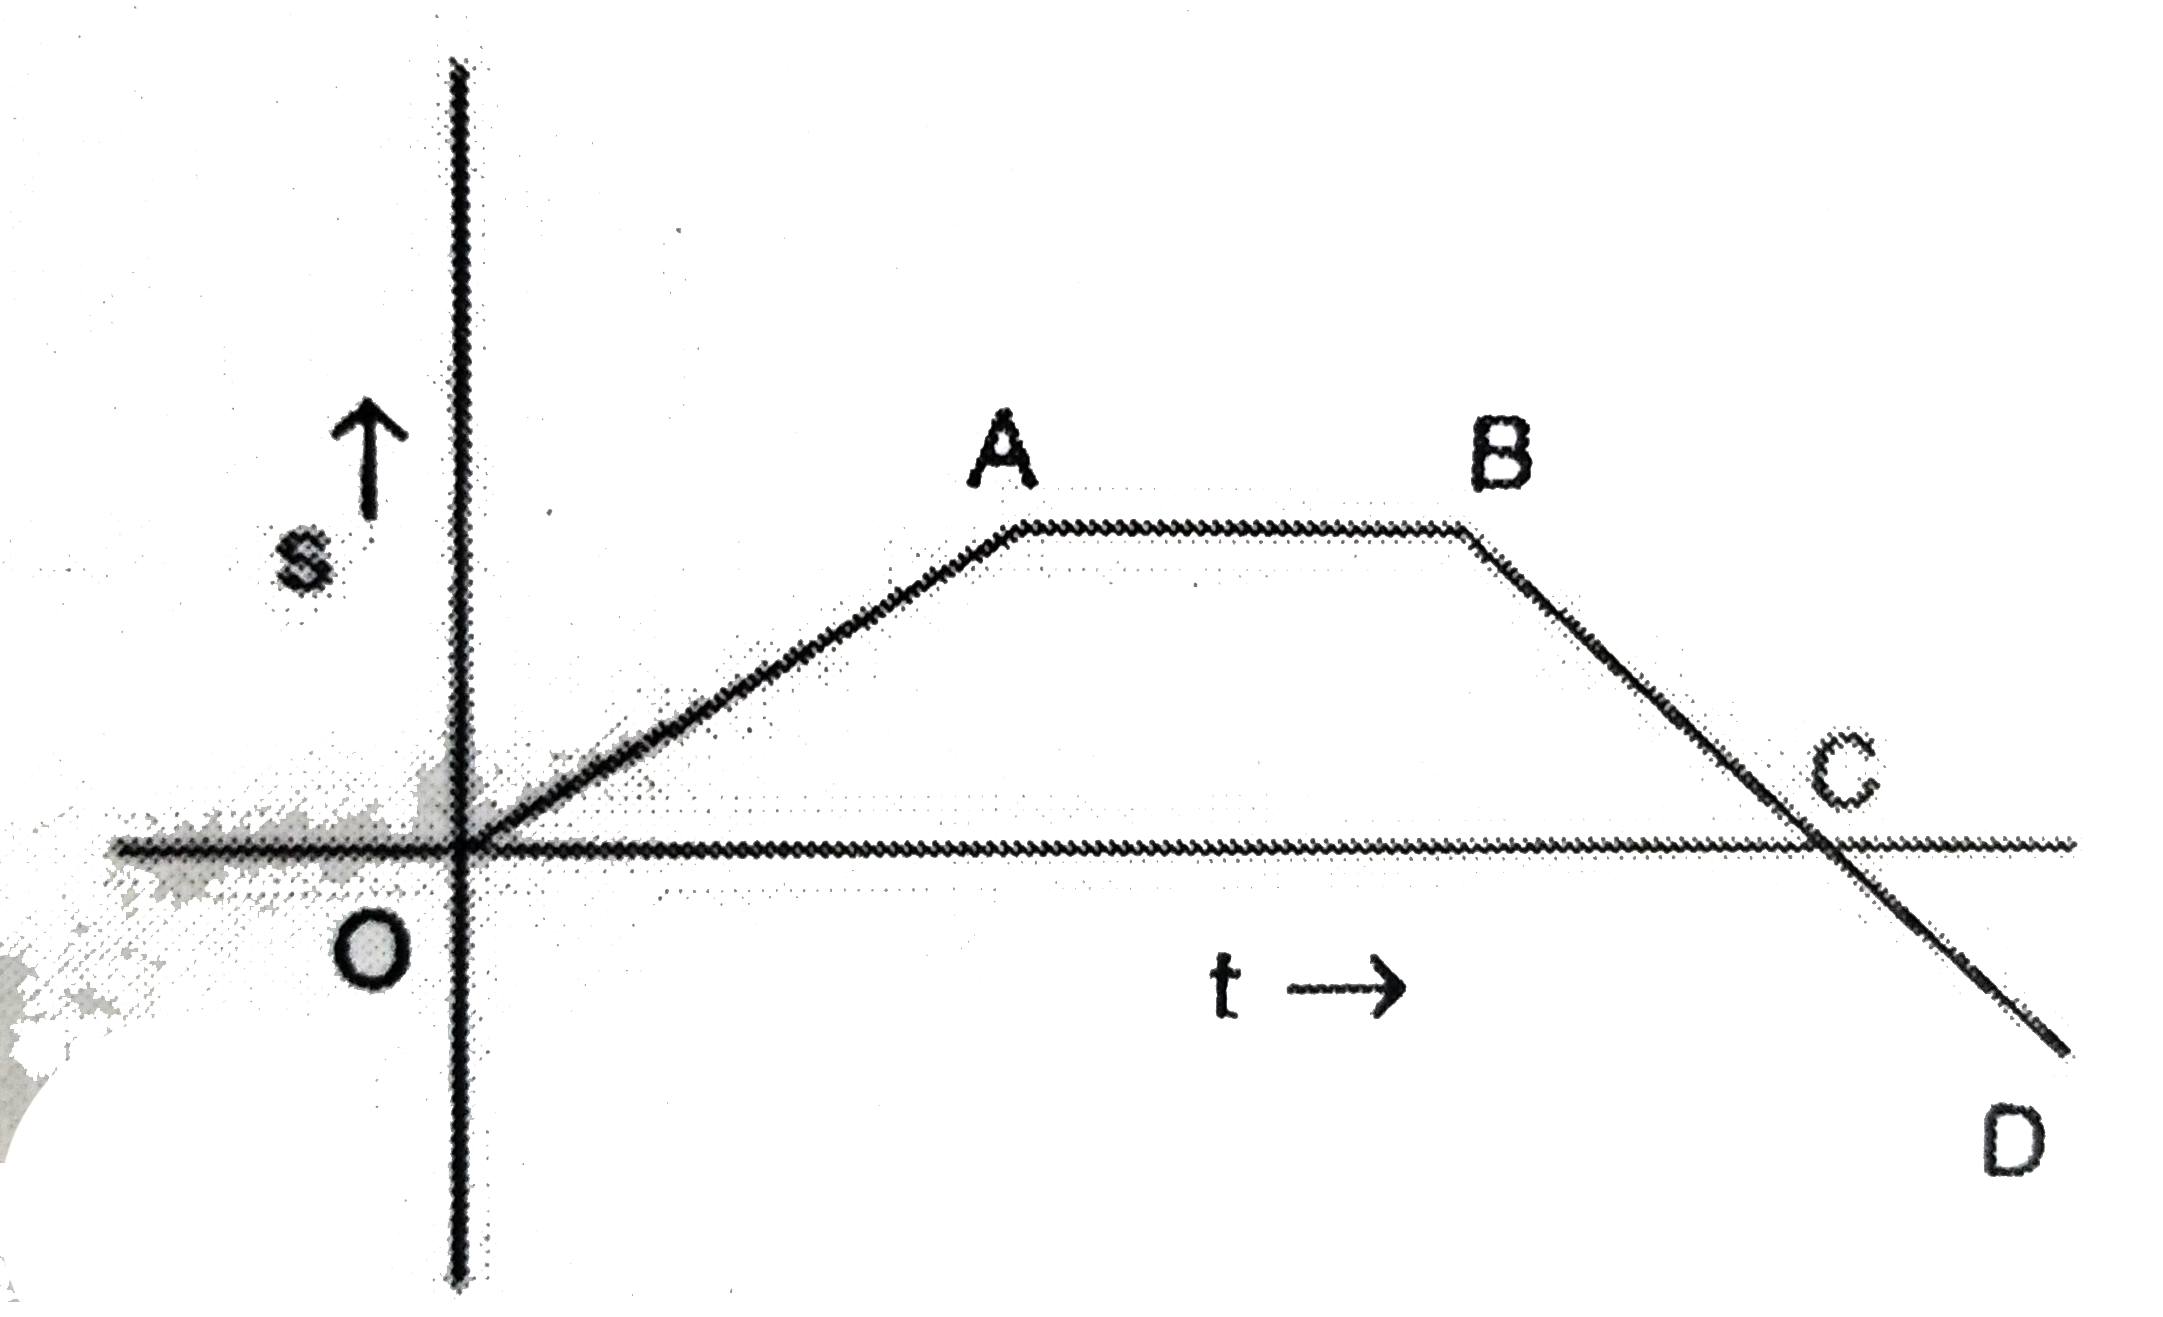
Then exponetial growth is represented byAdN/dt=(b+d)NBdN/dt=(b−d)NCdN/dt=(d−b)NDdN/dt=(d−b)NThe displacement-time grpah of a body is shown in the figure below.

The part of the graph that represens the body at rest isAOABABCBCDCD
If in a population of size 'N' the birth rate is represented as 'b' and the death rate as 'd' , the increase or decrease in 'N' during a unit time period 't' will be:
dNdt=(b−d)×N
The equation given above can also be represented as :
dNdt=r×N, where r=(b−d)
What does 'r' represent ? Write any one significance of calculating 'r' for any population.
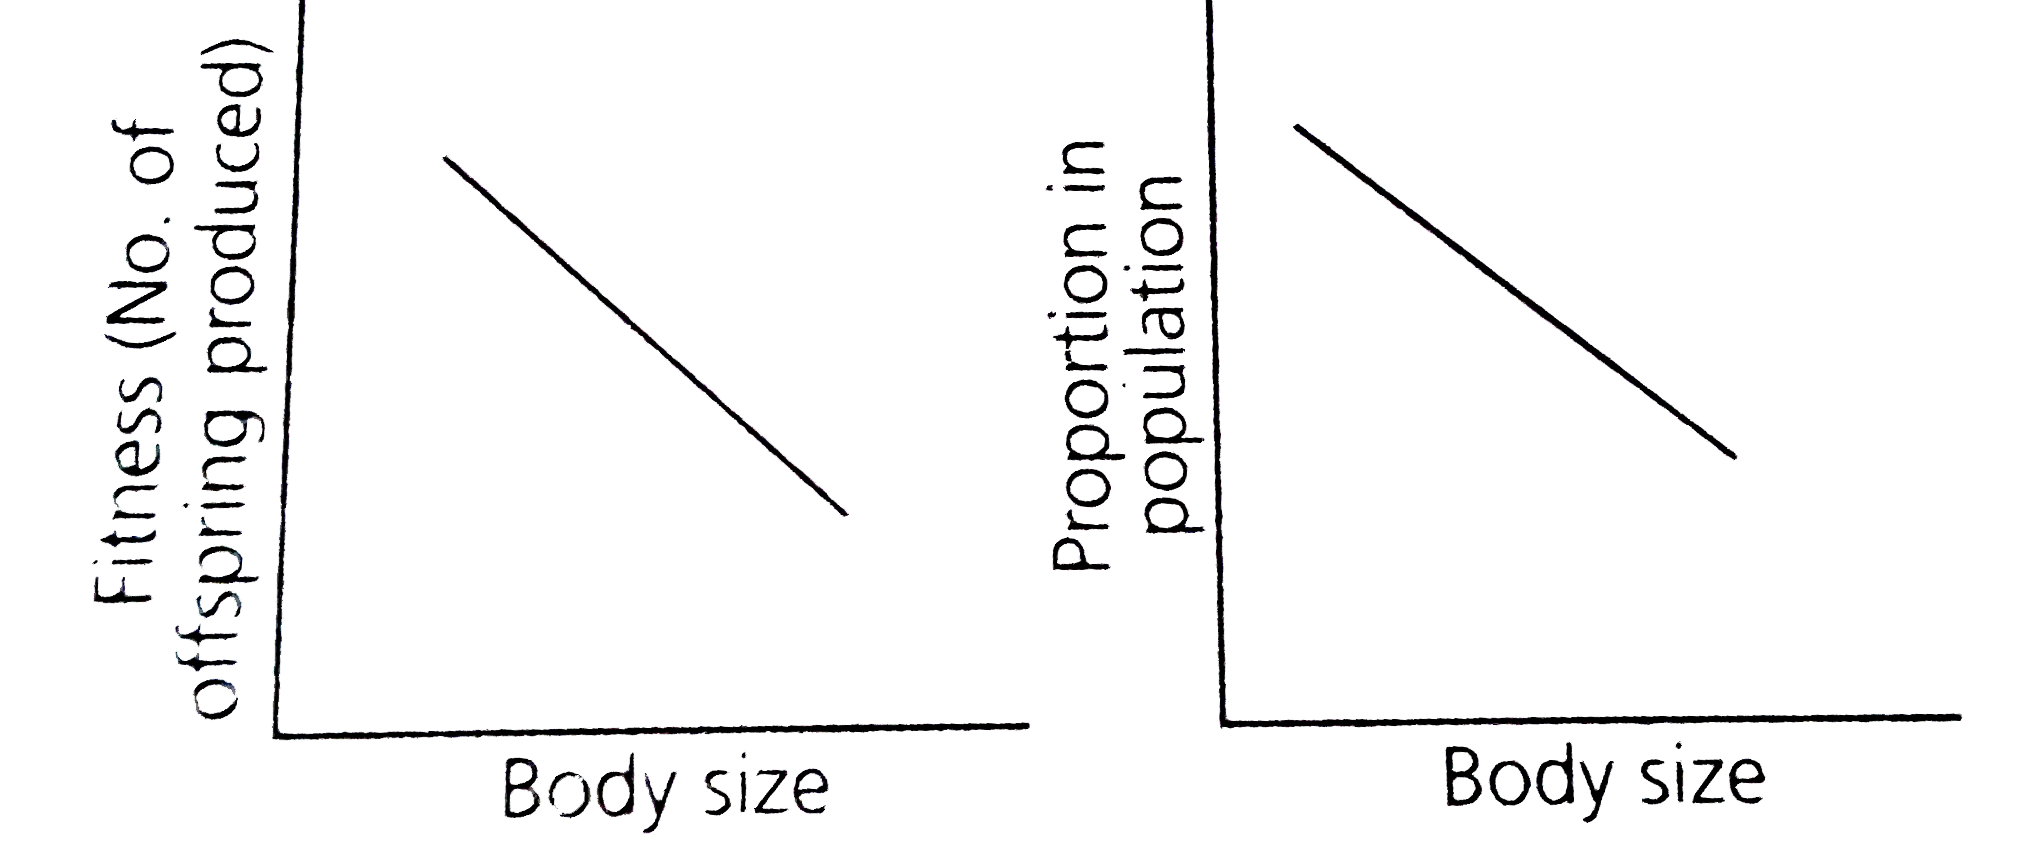
View SolutionStudy the charactristics of a population represented in the graphs below.

Mark the correct graph that represents the type of selection that this population is likely to undergo

View SolutionStudy the charactristics of a population represented in the graphs below.

Mark the correct graph that represents the type of selection that this population is likely to undergo

View SolutionIf natality is represented by -B
If mortality is represented by -D
if immigration is represented -I
If emigration is represented by -E
If population density at time t+1 is represented by
View SolutionThe area under acceleration - time graph represents the
View Solution
