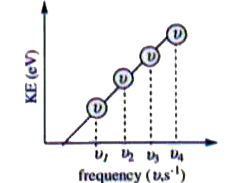
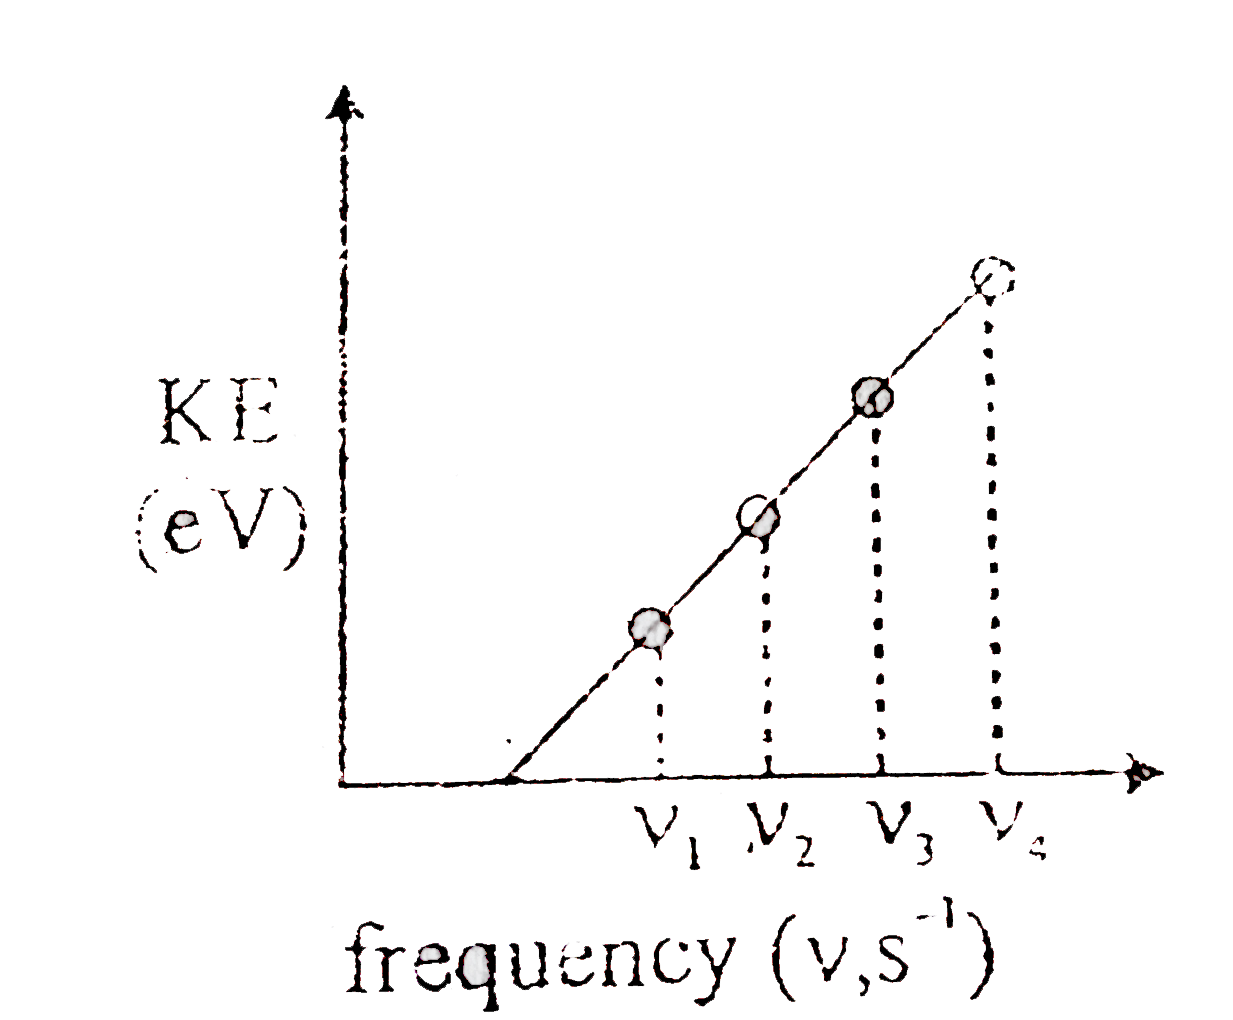
In a photoelectric experiment, kinetic energy of photoelectrons was plotted aganist the frequency of incident radiation (v), as the shown in figure. Which of the following statements is correct?
 Solution in Telugu
The threshold frequency is v1
The slope of this line is equal to Plank's constant.
As the frequency of incident radiation increase frequency, kinetic energy of photoelectrons decreases
It is impossible to obtain such a graph.
The correct Answer is:B
Step by step video, text & image solution for In a photoelectric experiment, kinetic energy of photoelectrons was plotted aganist the frequency of incident radiation (v), as the shown in figure. Which of the following statements is correct? by Chemistry experts to help you in doubts & scoring excellent marks in Class 11 exams.
Topper's Solved these Questions
- BOOK - AAKASH SERIESCHAPTER - ATOMIC STRUCTUREEXERCISE - OBJECTIVE EXERCISE - 3 (RECENT AIPMT/NEET QUESTIONS)20videos
ATOMIC STRUCTURE
- BOOK - AAKASH SERIESCHAPTER - ATOMIC STRUCTUREEXERCISE - SUBJECTIVE EXERCISE - 3 (VERY SHORT ANSWER QUESTIONS)13videos
ATOMIC STRUCTURE
- BOOK - AAKASH SERIESCHAPTER - AROMATIC HYDROCARBONSEXERCISE - OBJECTIVE EXERCIES - 3 (RECENT AIPMT/NEET QUESTIONS)10videos
AROMATIC HYDROCARBONS
- BOOK - AAKASH SERIESCHAPTER - CHEMICAL BONDINGEXERCISE - OBJECTIVE EXERCISE -3 (RECENT AIPMT/NEET QUESTIONS )39videos
CHEMICAL BONDING
Similar Questions
The de Broglie wavelength associated with a ball of mass 1kg having kinetic energy 0.5J is
03:06View SolutionWhat is an atomic orbital ?
01:39View SolutionUsing anhydrous AICI3 as catalyst which one of the following reactions produces ethyl benzene
02:37View SolutionIn which of the following pairs, the two species are isostructural?
01:27View SolutionThe maximum kinetic energy of the emitted photoelectrons against frequency upsilon of incident radiation is plotted as shown in Fig. This graph help us in determining the following physical quantities
01:37View SolutionAccording to Einstein's photoelectric equation, the graph between the kinetic energy of photoelectrons ejected and the frequency of incident radiation is
02:33View SolutionIn a photoelectric experiment, kinetic energy of photoelectrons was plotted against the frequency of incident radition (v), as show in figure. Which of the following statements is correct ?
 02:38View Solution
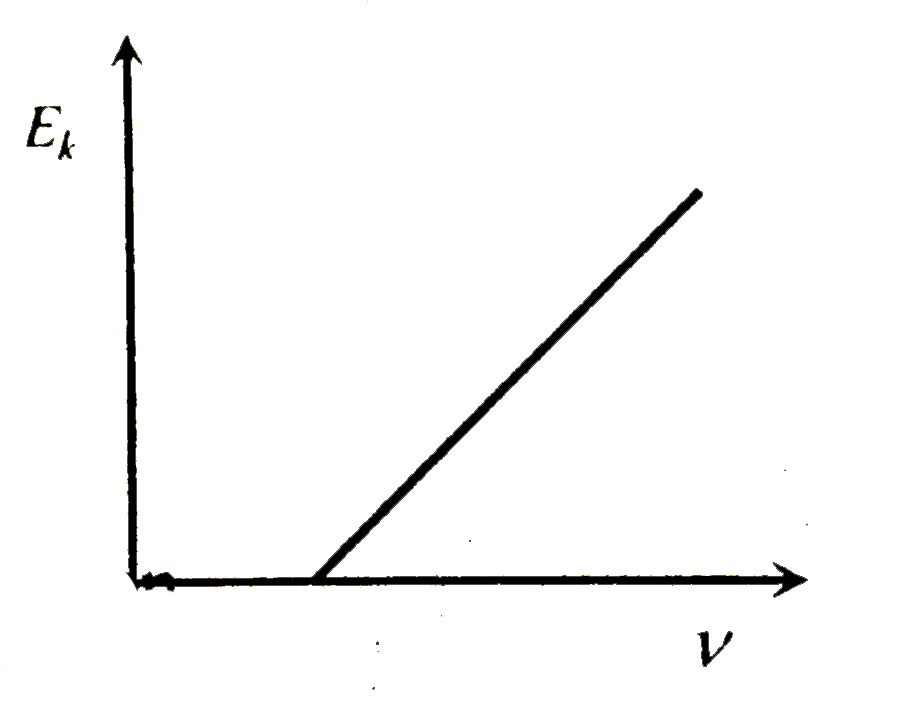
For the photoelectric effect, the maximum kinetic energy Ek of the emitted photoelectrons is plotted against the frequency ν of the incident photons as shown in the figure. The slope of the curve gives
 03:20View Solution
Statement-1: Kinetic energy of photoelectrons increases with increases in the frequency of incident radiation Statement-2: The number of photoelectrons ejected increases with increases in intensity of incident radiation.
02:48View SolutionThe kinetic energy (E_(k)) of a photoelectron varies with the frequency (v) of the incident radiation as which of the following graph ?
01:40View SolutionKinetic energy of surface photoelectrons is x when frequency of incident radiation is v .If frequency of incident radiation is made 2v, the kinetic energy of surface photoelectron will be
02:36View SolutionAccording to Einstein's photoelectric equation, the graph between kinetic energy of photoelectrons ejected and the frequency of the incident radiation is :
02:16View SolutionAccording to Einstein's photoelectric equation , the graph between the kinetic energy of photoelectrons ejected and the frequency of incident radiation is
04:33View SolutionThe maximum kinetic energy of emitted photoelectrons against frequency v of incident radiation is plotted as shown in figure. The slope of the graph is equal to
 03:08View Solution
According to Einstein's photoelectric equation , the graph between the kinetic energy of photoelectrons ejected and the frequency of incident radiation is
View Solution

