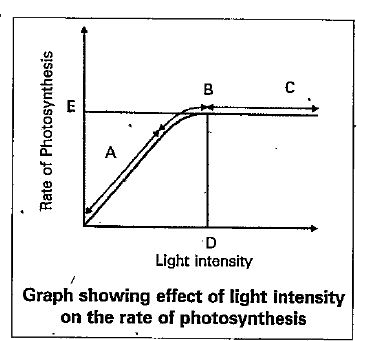
Figure shows the effect of light on the rate of phtosynthesis. Based on the graph, answer the following question:
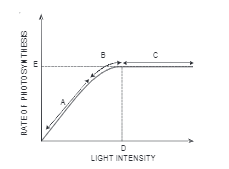
What could be the limiting factors in region A?Solution in Punjabi
Step by step video & image solution for Figure shows the effect of light on the rate of phtosynthesis. Based on the graph, answer the following question: What could be the limiting factors in region A? by Biology experts to help you in doubts & scoring excellent marks in Class 11 exams.
Updated on:21/07/2023Topper's Solved these Questions
- Photosynthesis in Higher PlantsBOOK - MBDCHAPTER - Photosynthesis in Higher PlantsEXERCISE - Exercise
14 Videos
- Neural Control and Co-ordinationBOOK - MBDCHAPTER - Neural Control and Co-ordinationEXERCISE - Exercise
14 Videos
- Plant Growth and DevelopmentBOOK - MBDCHAPTER - Plant Growth and DevelopmentEXERCISE - Exercise
15 Videos
Similar Questions
NaDP reductase enxyme is located on …………..
View SolutionWhich part of brain controls heart beat?
View SolutionA phase of growth which is maximum and fastest is …………
View SolutionFigure shows, the effect of light on the rate of photosynthesis Based on the graph, answer the following questions. a) At which points (A,B or C) in the curve is light a limiting factor? b) What could be the limiting factor/s in region A? c) What do C and D represent on the curve?
View SolutionFigure shows the effect of light on the rate of photosynthesis. Based on the graph, answer the following questions . (a) At which point /s (A,B or C) in the curve is light a limiting factor ? (b) What could be the limiting factor/ s in region A ? (b) What could be the limiting factor /s in region A ? (c) What do C and D represent the following .
View SolutionThe figure shows the effect of light on the rate of photosynthesis. Based on the graph, answer the following questions : What do region C and D represent on the curve ?
View SolutionFigure given below shows the effect of light on the role of photosynthesis. Based on graph
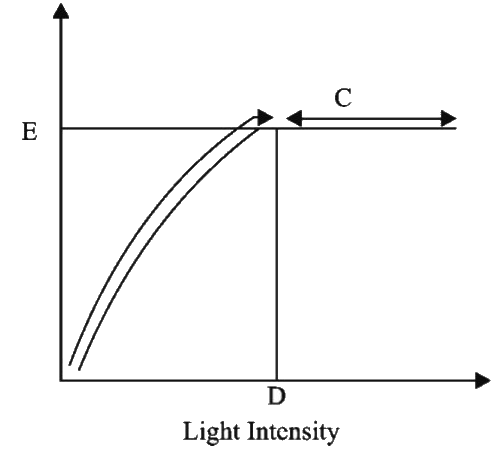
What could be the limiting factor/factors in region A?
View SolutionFigure 13.10 shows the effect of light on the rate of photosynthesis. Based on the graph, answer the following questions: (a) At which point/s (A, B or C) in the curve is light a limiting factor? (b) What could be the limiting factor/s in region A? (c) What do C and D represent on the curve?
View SolutionFigure 13.10 shows the effect of light on the rate of photosynthesis. Based on the graph, answer the following questions:
(a) At which point/s (A, B or C) in the curve is light a limiting factor?
(b) What could be the limiting factor/s in region A?
(c) What do C and D represent on the curve?
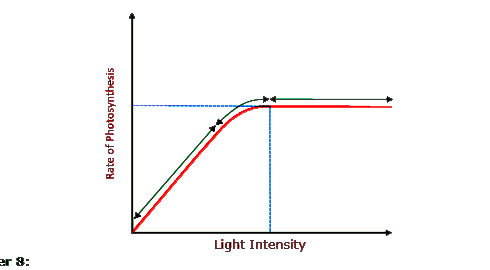
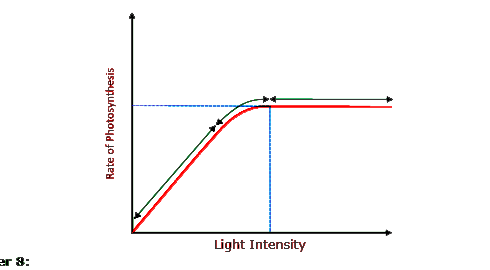
View SolutionFigure 13.10 shows the effect of light on the rate of photosynthesis. Based on the graph, answer the following questions: At which point/s (A, B or C) in the curve is light a limiting factor?
View SolutionFigure shows the effect of light on the rate of photosynthesis, Based on the graph, answer the following question : (a) At which point/s (A,B or C) in the curve is light a limiting factor ? (b) What could be the limiting factor/s is region A ? (c ) What do C and D represent on the curve ?
View SolutionFigure shows the effect of light on the rate of photosynthesis. Based on the graph, answer the following questions: At which points (A, B or C) in the curve is light a limiting factor?
View SolutionFigure shows the effect of light on the rate of photosynthesis. Based on the graph, answer the following questions:
What do C and D represent on the curve?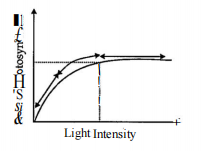
View SolutionFigure shows the effect of light on the rate of photosynthesis. Based on the graph, answer the following questions.
a. At which points (A, B or C) in the curve is light a limiting factor ?
b. What could be the limiting factor/s in region A ?
c. What do C and D represent on the curve ?
View Solution
