The temperature vs time graph for two materials A and B has been plotted when the energy is given to both at the same rate. Initially both the materials are in solid state (below their melting point )
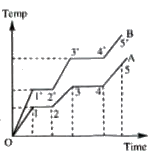
LfA=LfB
LvA=LvB
specific heat of A in liquid state > specific heat of B in liquid state
specific heat of A in liquid state > specific heat of B in solid state
The correct Answer is:D
Topper's Solved these Questions
- BOOK - AAKASH SERIESCHAPTER - CALORIMETRY EXERCISE - LECTURE SHEET (More than One correct answer Type Questions )19videos
CALORIMETRY
- BOOK - AAKASH SERIESCHAPTER - CALORIMETRY EXERCISE - LECTURE SHEET (Matirx Matching Type Questions)2videos
CALORIMETRY
- BOOK - AAKASH SERIESCHAPTER - APPENDICES EXERCISE - GRAVITATION (EARTH SATELLITES AND ESCAPE SPEED)35videos
APPENDICES
- BOOK - AAKASH SERIESCHAPTER - CENTRE OF MASSEXERCISE - ADDITIONAL PRACTICE EXERCISE (PRACTICE SHEET (ADVANCED))3videos
CENTRE OF MASS
Similar Questions
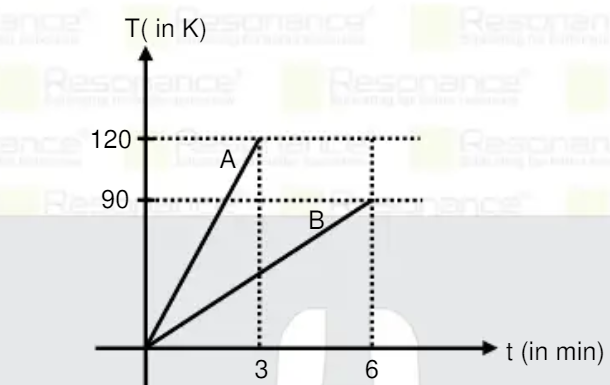
The temperature vs time graph for two different gases A and B having same number of moles is as shown in figure. If heat is supplied by same rate to both the gases. Find ratio of specific heat capacity of both gases.
 View Solution
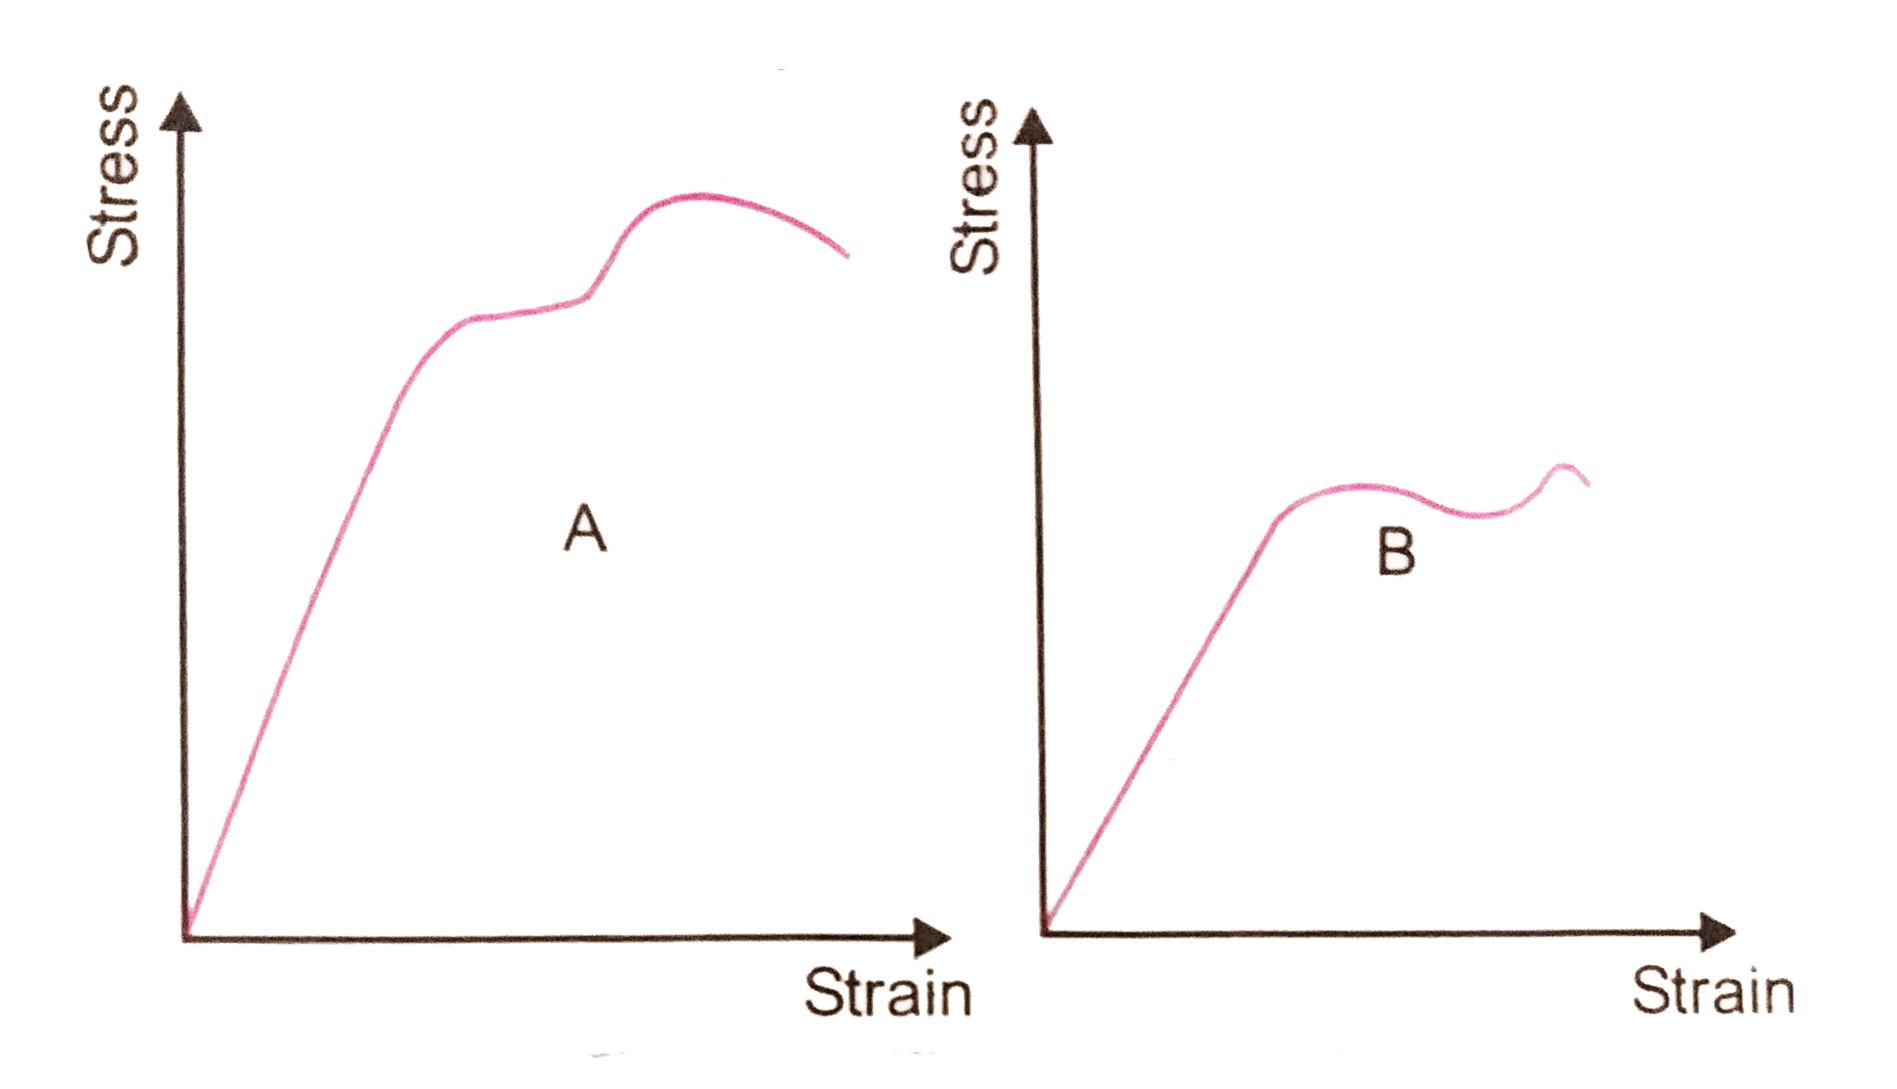
The stress-strain graphs for two materials A and B are shown in the figure. The graphs are drawn to the same scale.
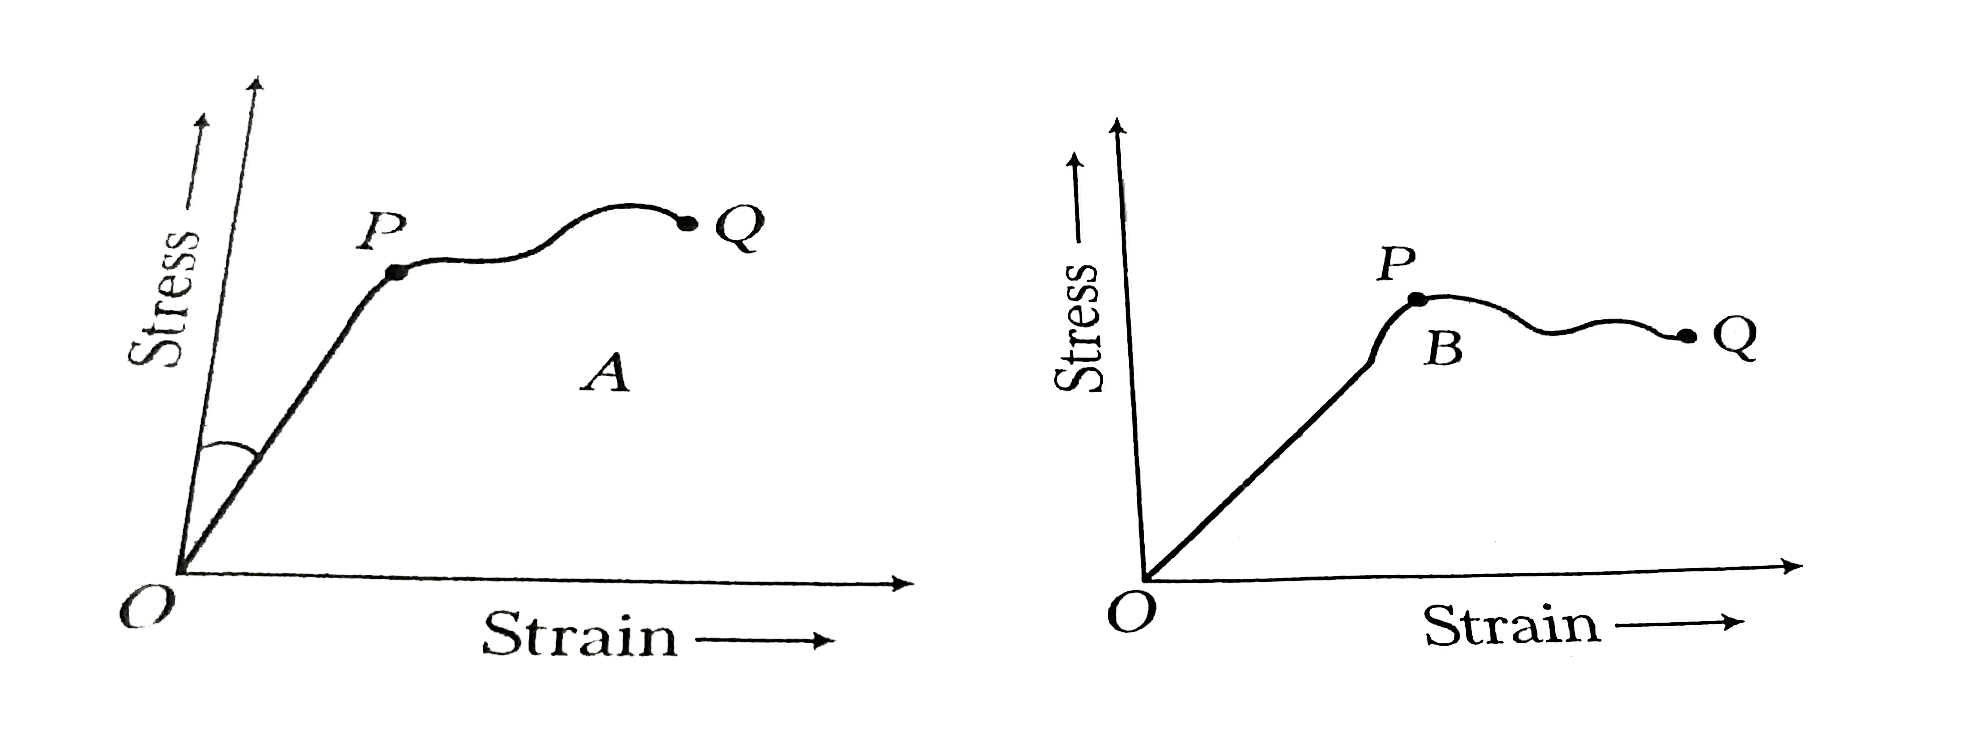
(a) Which material has a greater Young's modulus ?
(b) Which material is more ductile ?
(c) Which material is more brittle?
(d) Which of the two is the stronger material ?View Solution
Knowledge Check
- Question 1 - Select One
Two different liquids of same mass are kept in two identical vessels, which are placed in a freezer that extracts heat from them at the same rate causing each liquid to transform into a solid. The schematic figure below shows the temperature T vs time t plot for the two materials. We denote the specific heat in the liquid status to be CL1 and CL2 for materials 1 and 2 respectively, and latent heats of fusion U1 and U2 respectively.
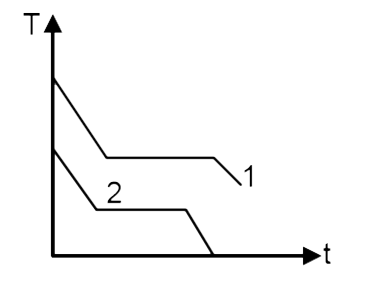
Choose the correct option.ACL1>CL2 and U1<U2BCL1>CL2 and U1>U2CCL1<CL2 and U1>U2DCL1<CL2 and U1<U2
The stress-strain graphs for two materials A and B are shown in the figure. The graphs are drawn to the same scale.

(a) Which material has a greater Young's modulus ?
(b) Which material is more ductile ?
(c) Which material is more brittle?
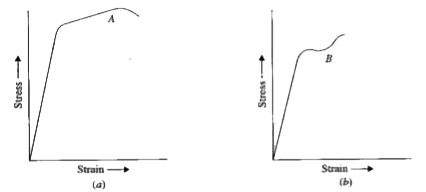
(d) Which of the two is the stronger material ?View SolutionThe stress versus strain graph for two materials A and B are shown in fig. the graph are on the same scale. ltbr> (a) Which material has greater Young's modulus?
(b) which of the two is stronger material?
 View Solution
The stress versus strain graphs for two materials A and B are shown in Figure. ( The graphs are drawn to the same scale) (a) Which material has greater Young's modulus ? (b) Which material is more ductile ? ( c) Which is more brittle ? ( d) Which of the two is the strong material?
 View Solution
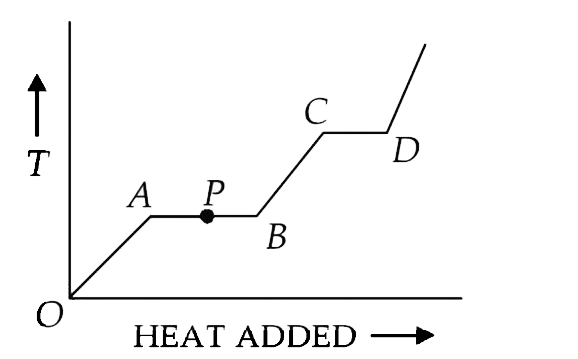
The variation of temperature of a material as heat is given to it at a constant rate is shown in the figure. The material is in solid state at the point O. The state of the material at the point P is…..
 View Solution
The variation of temperature of a material as heat is given to it at a constant rate is shown in the figure. The material is in solid state at the point O. The state of the material at the point P is…..
 View Solution
The variation of temprature of a material as heat is given to it at a constant rate is shown in the figure. The material is in solid state at the point O. The state of the material at the point P is…..
 View Solution
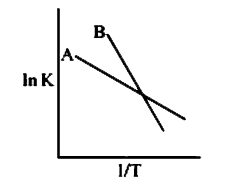
Plot ln K vs. 1/T for two reactions A and B are given below. Which reaction is more sensitive to temperature :-
 View Solution

