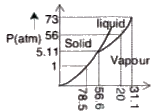
From the given P-T graph of CO2 you may concluded that it will be
A
Vapour at −76∘C under 1 atm
B
Liquid at −20∘Cand 56 atm
C
Solid at - 60∘Cand70 atm
D
Coexisting in three phases at −56.6∘Cand5.11 atm
Text Solution
The correct Answer is:A, B, C, D
|
Updated on:21/07/2023
Topper's Solved these Questions
- BOOK - AAKASH SERIESCHAPTER - CALORIMETRY EXERCISE - LECTURE SHEET (Matirx Matching Type Questions)2videos
CALORIMETRY
- BOOK - AAKASH SERIESCHAPTER - CALORIMETRY EXERCISE - PRACTICE SHEET (LEVEL - I Straight Objective Type Questions))14videos
CALORIMETRY
- BOOK - AAKASH SERIESCHAPTER - CALORIMETRY EXERCISE - ADDITIONAL PRACTICE EXERCISE (LEVEL - II) (LECTURE SHEET (ADVANCED)(Matrix Type Questions)1videos
CALORIMETRY
- BOOK - AAKASH SERIESCHAPTER - APPENDICES EXERCISE - GRAVITATION (EARTH SATELLITES AND ESCAPE SPEED)35videos
APPENDICES
- BOOK - AAKASH SERIESCHAPTER - CENTRE OF MASSEXERCISE - ADDITIONAL PRACTICE EXERCISE (PRACTICE SHEET (ADVANCED))3videos
CENTRE OF MASS
Similar Questions
Knowledge Check
- Question 1 - Select One or More
From the given P−T graph of CO2, you may conclude that it will be
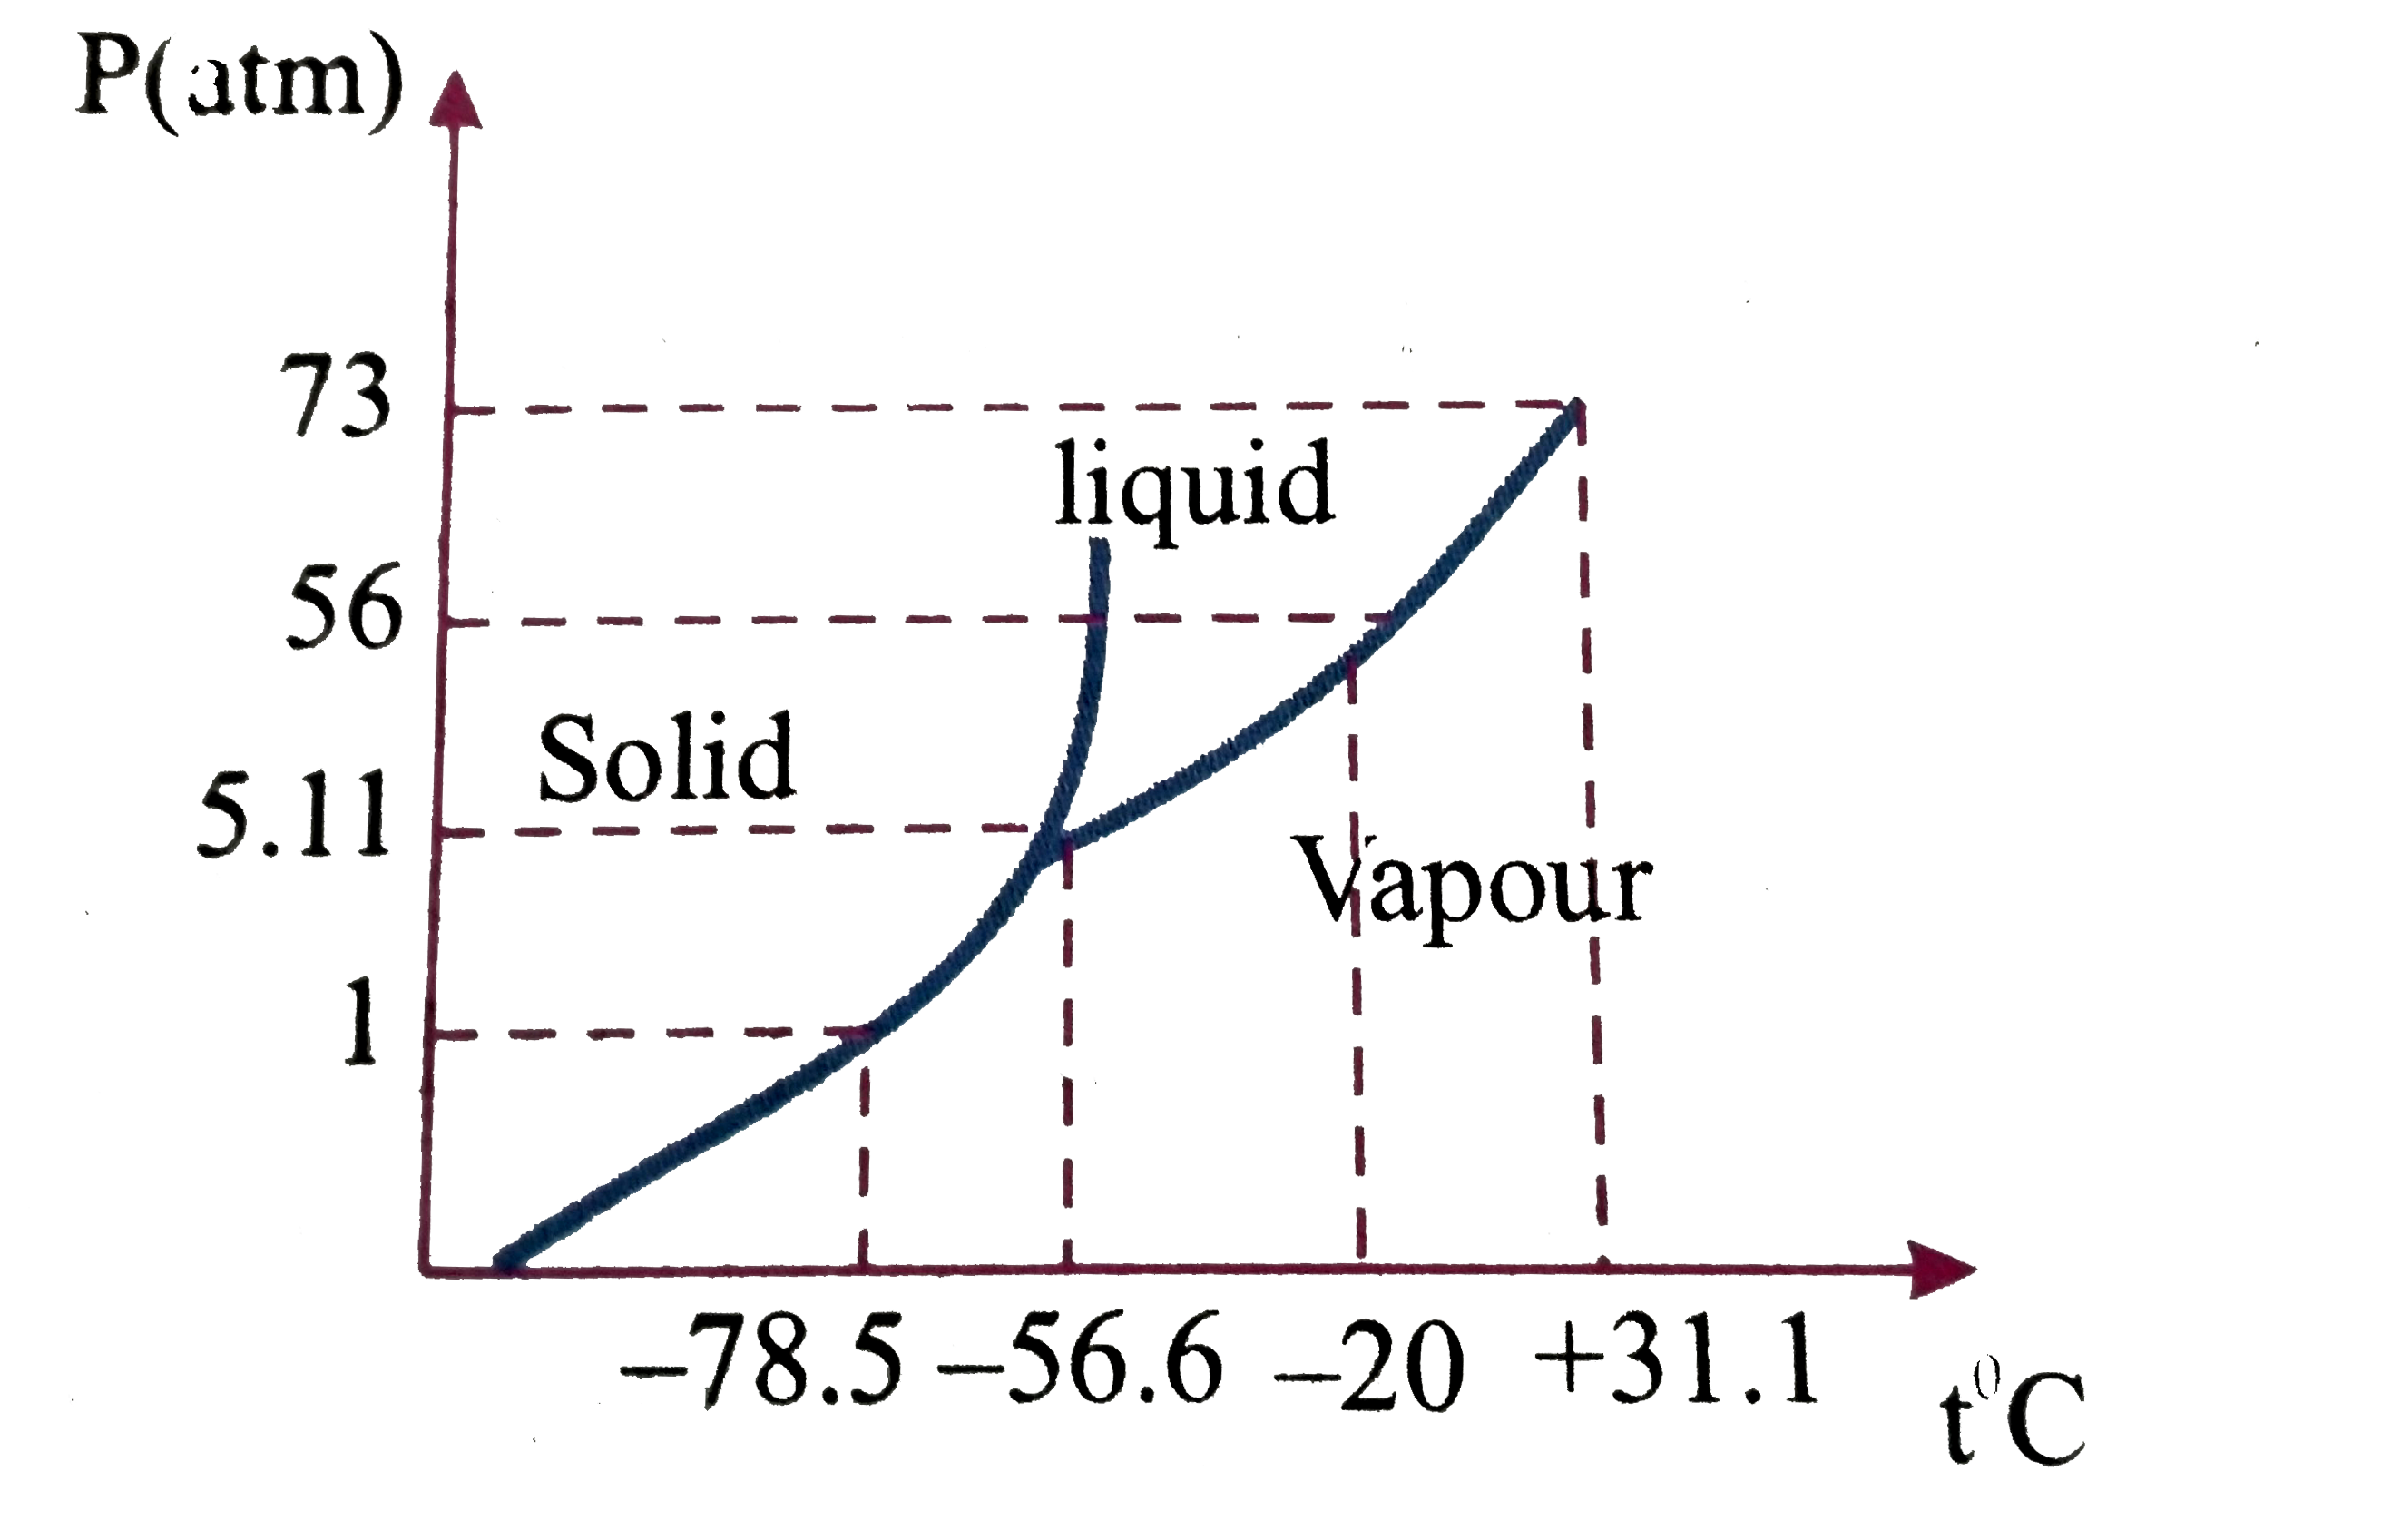 .AVapour at −79∘C under 1 atmBLiquid at −20∘C and 56 atmCsolid at −60∘C and 70 atmDCo-existing in three phase at −56.6∘C and 5.11 atm.
 - Question 2 - Select One
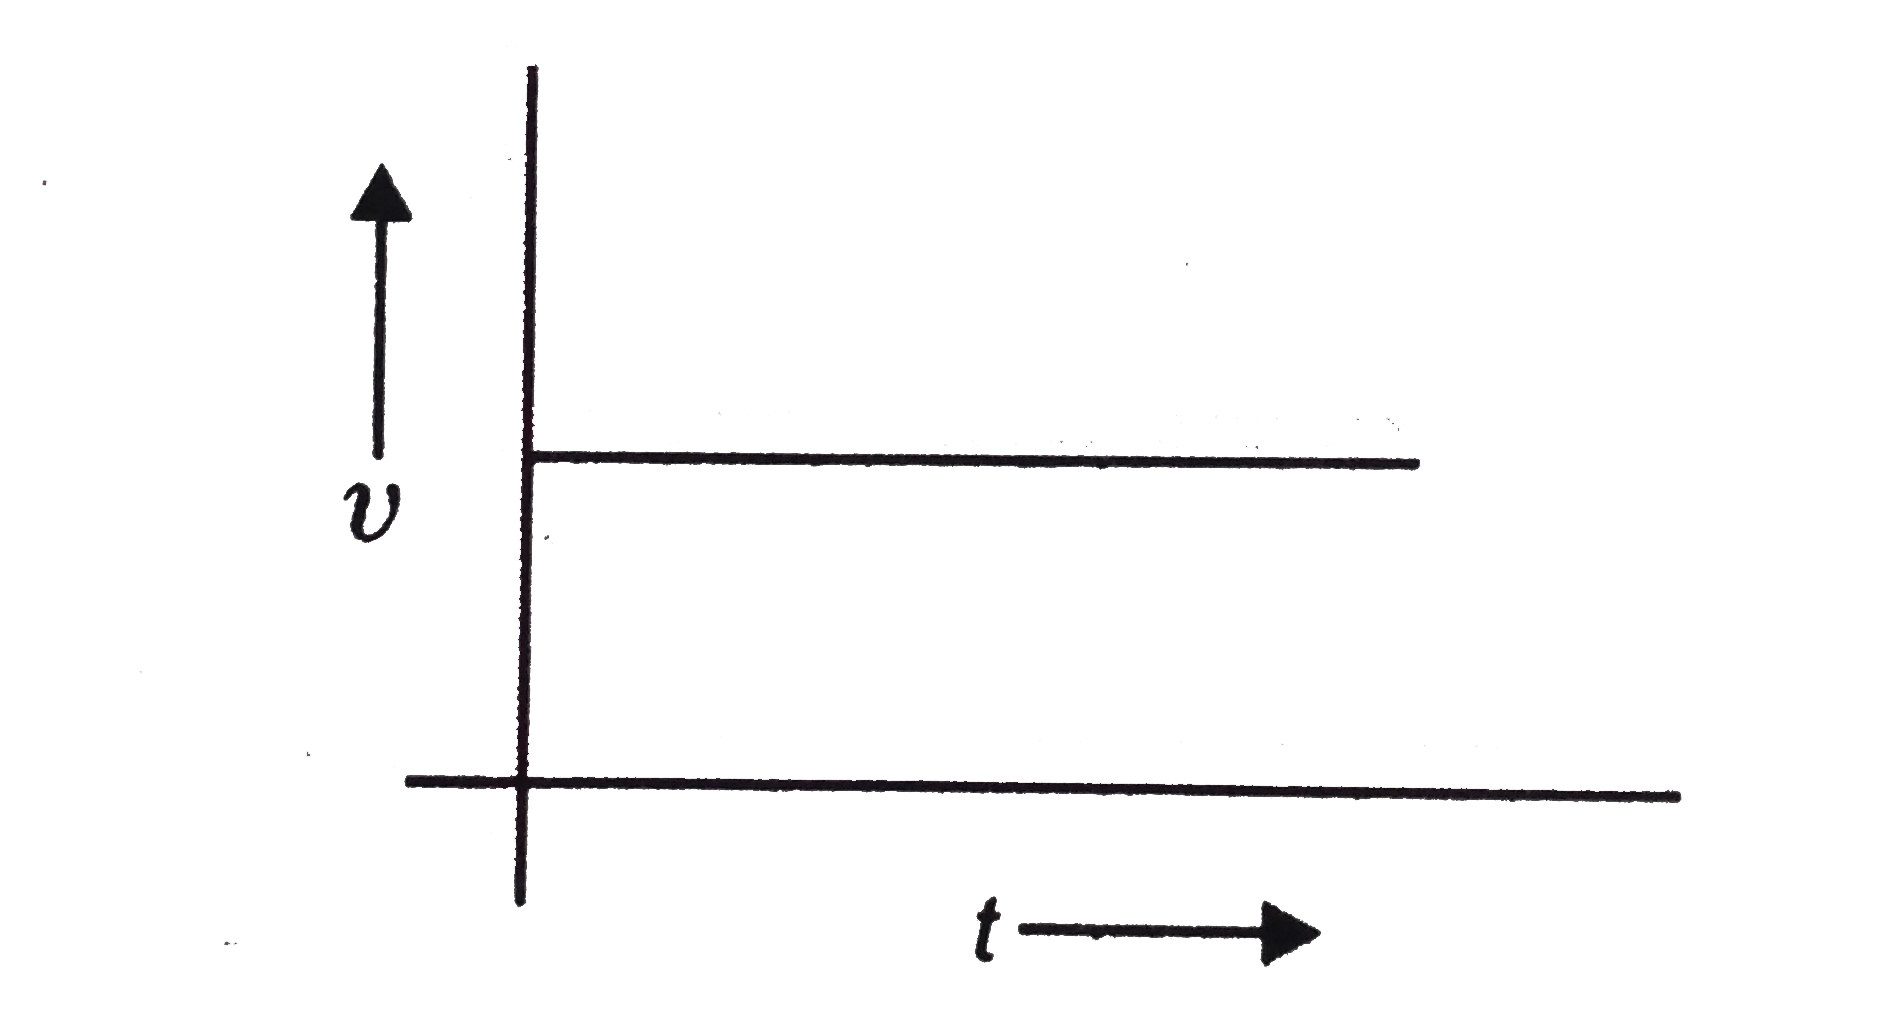
From the given v-t graph (see figure), it can be inferred that the object is
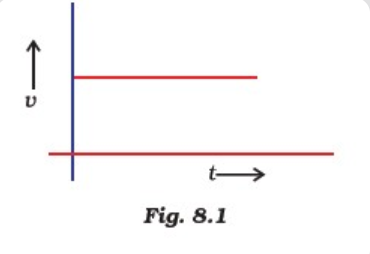 Ain uniform motionBat restCin non-uniform motionDmoving with uniform acceleration
 - Question 3 - Select One
From the given v-t graph (see figure ), It can be inferred that the object is
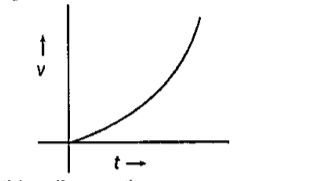 AIn uniform motionBat restCin non-uniform accelerated motionDmoving with uniform acceleration
For a reaction , the concentration of the reactant C varies with time t as shown by the following graph .
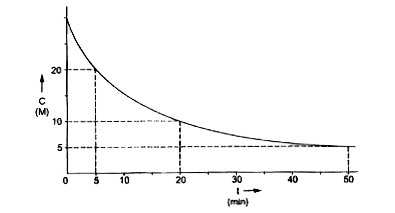
what do you conclude about the order of the reaction ?View SolutionFrom the following V−T diagram we can conclude:-
_E01_054_Q01.png) View Solution
View SolutionFrom the given v−t graph (Figure), it can be inferred that the object is
 View Solution
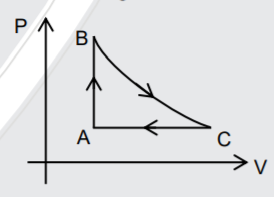
For the given P-V graph for an ideal gas, chose the correct V-T graph. Process BC is adiabatic.
 View Solution
From the following V−T diagram we can conclude:-
_E01_054_Q01.png) View Solution
View Solution

