For the given P-V graph for an ideal gas, chose the correct V-T graph. Process BC is adiabatic. 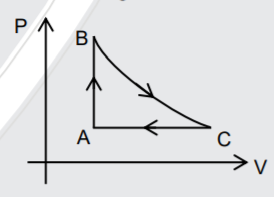
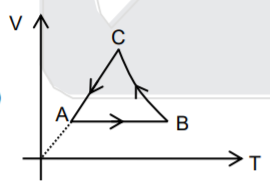
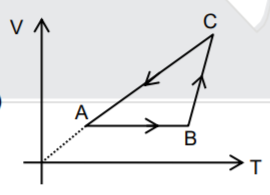
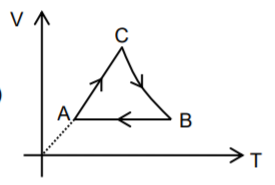
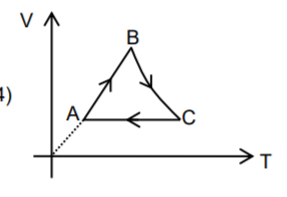
The correct Answer is:A
NA
Topper's Solved these Questions
Similar Questions
On the P−T graph of an ideal gas, choose the correct option(s):
View SolutionAssertion: Straight line on (p - T) graph for an ideal gas represents isochoric process.
Reason: If p∝T,V=constant.
View SolutionThe pressure P and volume V of an ideal gas both decreases in a process.
View SolutionStraight line on (p - T) graph for an ideal gas represents isochoric process.
If p∝T,V=constant.
View SolutionThe curves A and B in the figure shown P-V graphs for an isothermal and an adiabatic process for an idea gas. The isothermal process is represented by the curve A.
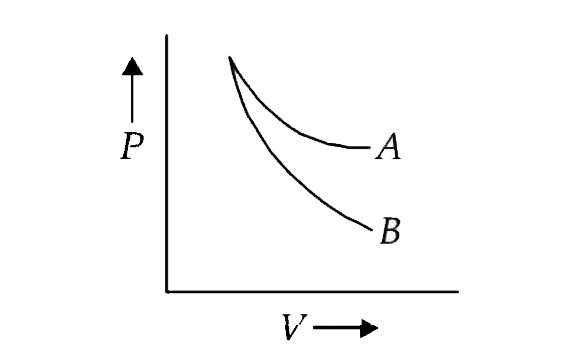
View SolutionThe curves A and B in the figure shown P-V graphs for an isothermal and an adiabatic process for an idea gas. The isothermal process is represented by the curve A.

View SolutionThe slope of P-V graph for isochoric process is
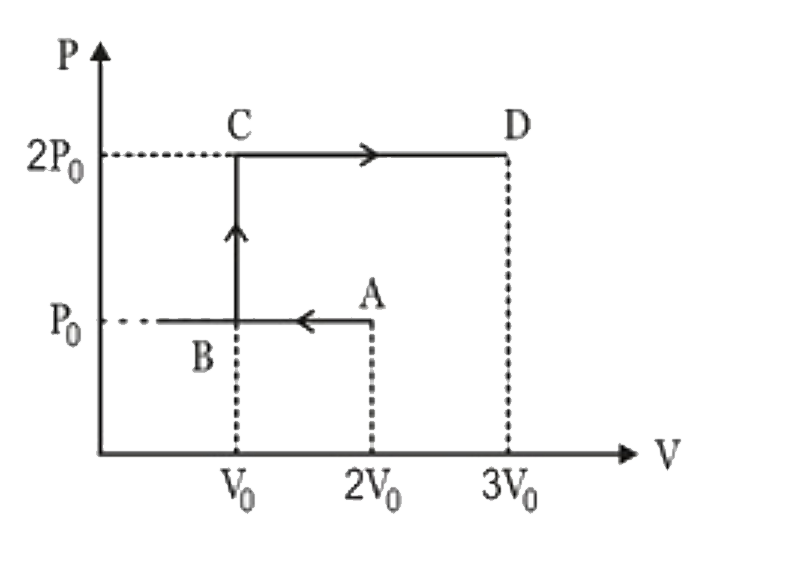
View SolutionP – V graph of an ideal gas is as shown in the diagram . Work done by the gas in the process ABCD is
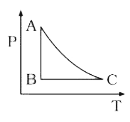
View SolutionAn ideal gas undergoes a cyclic process as shown in the given P-T diagram, where AC is adiabatic. The process is also represented by:
View SolutionThe pressure p and volume V of an ideal gas both increase in a process.
View Solution
