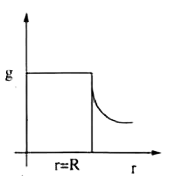
Assuming the earth to be a uniform sphere of mass M and radium R. which of the following graphs represents the variation of acceleration due to gravity with distance .r. from the centre of the earth.
A
B
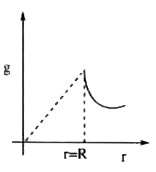
C
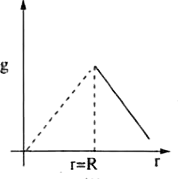
D
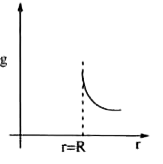
Text Solution
The correct Answer is:B
|
Similar Questions
Knowledge Check
Which graph correctly presents the variation of acceleration due to gravity with the distance form the centre of the earth?
A B
B C
C D
D
Which of the following graphs shows the variation of acceleration due to gravity g with depth h from the surface of the earth ?
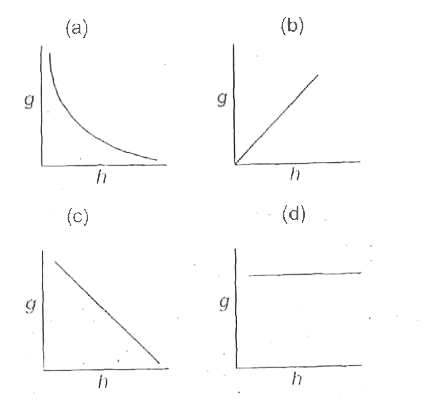 A(a)B(b)C(c )D(d)
Assuming the earth to have a constant density, point out which of the following curves show the variation of acceleration due to gravity from the centre of earth to the points far away from the surface of earth
A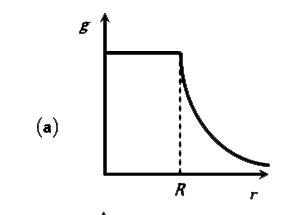 B
B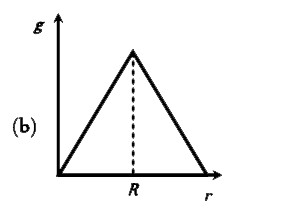 C
C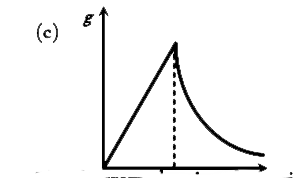 D
D
Find the acceleration due to gravity at a distance of 20000 kg from the centre of the earth.
View SolutionFind the acceleration due to gravity at a distance of 20000 km from the centre of the earth.
View SolutionStarting from the centre of the earth having radius R, the variation of g (acceleration due to gravity) is shown by
View SolutionIf g denotes the value of acceleration due to gravity at a point distance r from the centre of earth of radius R. If r<R, then
View SolutionStarting from the centre of the earth having radius R the variation of g (acceleration due to gravity) is shown by
View Solution
