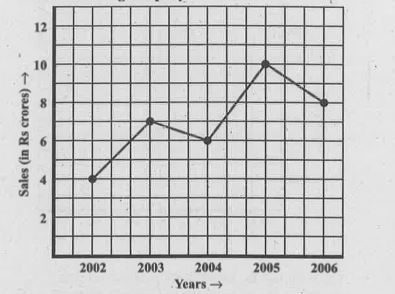
The following line graph shows the yearly sales figures for a manufacturing company. (a)What were the sales in (i)2002 (ii)2006? (b)What were the sales in(i)2003 (ii) 2005? (c)Compute the difference between the sales in 2002 and 2006. (d)In which year was there the greatest difference between the sales as compared to its previous year?
 Solution in Kannada
Step by step video & image solution for The following line graph shows the yearly sales figures for a manufacturing company. (a)What were the sales in (i)2002 (ii)2006? (b)What were the sales in(i)2003 (ii) 2005? (c)Compute the difference between the sales in 2002 and 2006. (d)In which year was there the greatest difference between the sales as compared to its previous year? by Maths experts to help you in doubts & scoring excellent marks in Class 8 exams.
Similar Questions
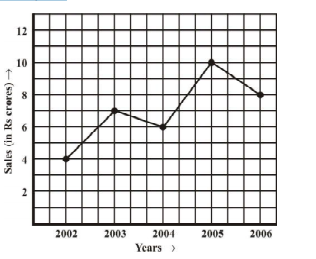
The following graph shows the sales of a construction company in different years: (i) In the year 2002 (ii) How many sales were in the year 2006?
01:28View SolutionThe following graph shows the sales of a construction company in different years: What was the difference in sales between 2002 and 2006?
01:40View SolutionThe following line graph shows the yearly sales figures for a manufacturing company: What were the sales in (i) 2003 (ii) 2005?
 01:57View Solution
एक निर्माता कम्पनी की विभिन्न वर्षों में की गई बिक्री निम्न आलेख द्वारा दर्शाई गई है :
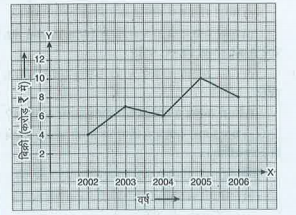
वर्ष 2002 तथा वर्ष 2006 की बिक्रियों में कितना अन्तर था?02:34View SolutionThe following line graph sows the yearly sales figures for a manufacturing company.
Compute the difference between the sales in 2002 and 2006.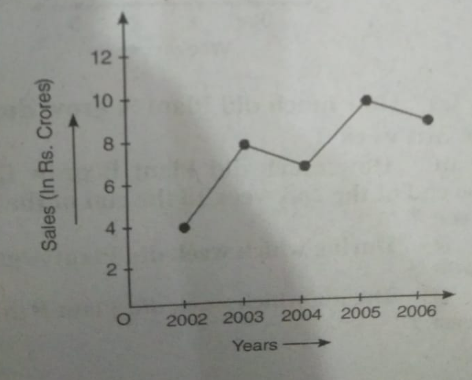 02:29View Solution
The following line graph sows the yearly sales figures for a manufacturing company.
In which year was there the greatest difference between the sales as compared to its previous year ?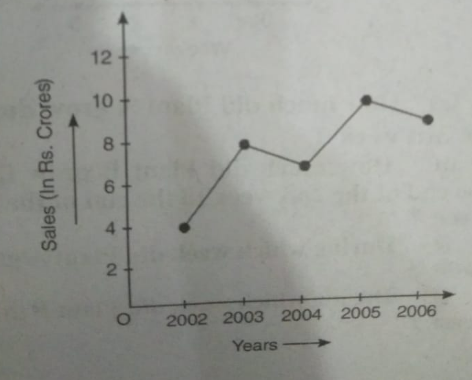 04:11View Solution
The following line graph shows the yearly sales figures for a manufacturing company: What were the sales in (i) 2002 (ii) 2006?
 01:31View Solution
The following line graph shows the yearly sales figures for a manufacturing company: What were the sales in (i) 2002 (ii) 2006?
 01:31View Solution
