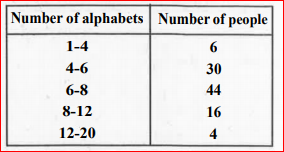
100 surnames were randomly picked up from a local telephone directory and a frequency distribution of the number of letters in the English alphabet in the surnames was found as follows:
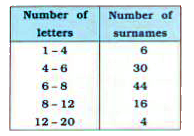
(i) Draw a histogram to depict the given information, (ii) Write the class interval in which the maximum number of surnames lie.Solution in Gujrati
Step by step video & image solution for 100 surnames were randomly picked up from a local telephone directory and a frequency distribution of the number of letters in the English alphabet in the surnames was found as follows: (i) Draw a histogram to depict the given information, (ii) Write the class interval in which the maximum number of surnames lie. by Maths experts to help you in doubts & scoring excellent marks in Class 9 exams.
Updated on:21/07/2023Topper's Solved these Questions
- STATISTICSBOOK - KUMAR PRAKASHANCHAPTER - STATISTICSEXERCISE - EXERCISE 14.4
6 Videos
- STATISTICSBOOK - KUMAR PRAKASHANCHAPTER - STATISTICSEXERCISE - SUM TO ENRICH REMEMBER
14 Videos
- STATISTICSBOOK - KUMAR PRAKASHANCHAPTER - STATISTICSEXERCISE - EXERCISE 14.2
9 Videos
- QUESTION PAPER 3 : FOR THE ANNUAL EXAMINATION BOOK - KUMAR PRAKASHANCHAPTER - QUESTION PAPER 3 : FOR THE ANNUAL EXAMINATION EXERCISE - SECTION -D
5 Videos
- SURFACE AREAS AND VOLUMESBOOK - KUMAR PRAKASHANCHAPTER - SURFACE AREAS AND VOLUMESEXERCISE - MULTIPLE CHOICE QUESTIONS
18 Videos
Similar Questions
The following number of goals were scored by a team in a series of 10 matches : 2, 3, 4, 5, 0, 1, 3, 3, 4, 3 Find the mean, median and mode of these scores.
View SolutionConsider the marks obtained by 10 students in a mathematics test as given below: 55 36 95 73 60 42 25 78 75 62 Find the range of the data.
View SolutionThe blood groups of 30 students of Class VIII are recorded as follows: A, B, O, O, AB, O, A, O, B, A, O, B, A, O, O, A, AB, O, A, A, O, O, AB, B, A, O, B, A, B, O. Represent this data in the form of a frequency distribution table. Which is the most common, and which is the rarest, blood group among these students ?
View SolutionProve that the angles opposite to equal sides of an isosceles triangle are equal.
View SolutionThe total surface area of a cuboid with length 20 cm, breadth 15 cm and height 10 cm is ……… cm2.
View Solution100 surnames were randomly picked up from a local telephone directory and the frequency distribution of the number of letters in the English alphabets in the surnames was obtained as follows:Determine the median number of letters in the surnames. Find the mean number of letters in the surnames? Also, find the modal size of the surnames.

View Solution100 surnames were randomly picked up from a local telephone directory and a frequency distribution of the number of letters in the English alphabet in the surnames was found as follows:
(i) Draw a histogram
(ii) write the class interval in which maximum number of surnames lie .

View Solution100 surnames were randomly picked up from a local telephone directory and a frequency distribution of the number of letter in English alphabet in the surnames was found as follows:

(i) Draw a histogram to depict the given information.
(ii) Write the class interval in which the maximum number of surnames lie.
View Solution100 surnames were randomly picked up from a local telephone directory and the frequency distribution of the number of letters in the English alphabets in the surnames was obtained as follows:

Determine the median number of letters in the surnames. Find the mean number of letters in the surnames? Also, find the model size of the surnames.
View Solution100 surnames were randomly randomly picked up from a local telephone directory and a frequency distribution of the number of letters in the English alphabet in the surnames was found as follows :
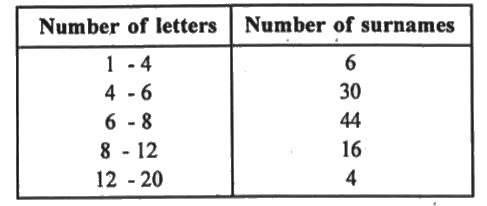
(i) Draw a histogram to depict the given information.
View Solution100 surnames ware randomly picked up from a local telephone directory and the frequency distribution of the number of letters in the English alphabets in the surnames was obtained as follows :
Determine the median number of letters in the surnames.

View SolutionFind the mode of the given data 8,5,4,6,7,4,4,3,5,4,5,4,4,4,3
View Solution100 surnames were randomly picked up from a local telephone directory and the frequency distribution of the number of letters in the English alphabet in the surnames was obtained as follows

Determine the median number of letters in the surnames . Find the mean number of letters in the surnames ? Also, find the modal size of the surnames.
View SolutionIn a city, the weekly observations made in a study on the cost of living index are given in the following table :
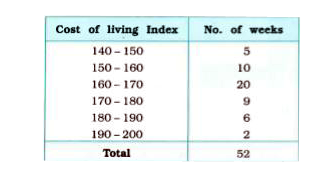
Draw a frequency polygon for the data above (without constructing a histogram).
View Solution100 surnames were randomly picked up from a local telephone directory and a frequency distribution of the number of letters in the English alphabet in the surnames was found as follows :
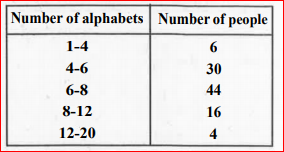 : Draw a histogram to depict the given information.
View Solution100 surnames were randomly picked up from a local telephone directory and a frequency distribution of the number of letters in the English alphabet in the surnames was found as follows :
 : Write the class interval in which the maximum number of surnames lie.
View Solution
