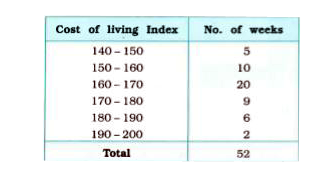
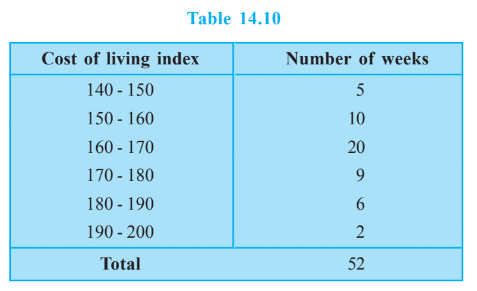
In a city, the weekly observations made in a study on the cost of living index are given in the following table :

Draw a frequency polygon for the data above (without constructing a histogram).Solution in Gujrati
Step by step video & image solution for In a city, the weekly observations made in a study on the cost of living index are given in the following table : Draw a frequency polygon for the data above (without constructing a histogram). by Maths experts to help you in doubts & scoring excellent marks in Class 9 exams.
Updated on:21/07/2023Topper's Solved these Questions
- STATISTICSBOOK - KUMAR PRAKASHANCHAPTER - STATISTICSEXERCISE - EXERCISE 14.4
6 Videos
- STATISTICSBOOK - KUMAR PRAKASHANCHAPTER - STATISTICSEXERCISE - SUM TO ENRICH REMEMBER
14 Videos
- STATISTICSBOOK - KUMAR PRAKASHANCHAPTER - STATISTICSEXERCISE - EXERCISE 14.2
9 Videos
- QUESTION PAPER 3 : FOR THE ANNUAL EXAMINATION BOOK - KUMAR PRAKASHANCHAPTER - QUESTION PAPER 3 : FOR THE ANNUAL EXAMINATION EXERCISE - SECTION -D
5 Videos
- SURFACE AREAS AND VOLUMESBOOK - KUMAR PRAKASHANCHAPTER - SURFACE AREAS AND VOLUMESEXERCISE - MULTIPLE CHOICE QUESTIONS
18 Videos
Similar Questions
The following number of goals were scored by a team in a series of 10 matches : 2, 3, 4, 5, 0, 1, 3, 3, 4, 3 Find the mean, median and mode of these scores.
View SolutionConsider the marks obtained by 10 students in a mathematics test as given below: 55 36 95 73 60 42 25 78 75 62 Find the range of the data.
View SolutionThe blood groups of 30 students of Class VIII are recorded as follows: A, B, O, O, AB, O, A, O, B, A, O, B, A, O, O, A, AB, O, A, A, O, O, AB, B, A, O, B, A, B, O. Represent this data in the form of a frequency distribution table. Which is the most common, and which is the rarest, blood group among these students ?
View SolutionProve that the angles opposite to equal sides of an isosceles triangle are equal.
View SolutionThe total surface area of a cuboid with length 20 cm, breadth 15 cm and height 10 cm is ……… cm2.
View SolutionIn a city of weekly observations made in a study on the cost of loving index are given in the following to draw a frequency polygon (without constructing histogram )

View SolutionHow many lines of symmetry does the above figure have ?
View SolutionDetermine the point of symmetry of a regular hexagon.
View SolutionDtermine the images of the following figure about the given line :
View SolutionMatch the following Column A to Column B

View SolutionMatch the following Column A to Column B

View SolutionMatch the following Column A to Column B

View SolutionThe inequation represented by the graph given below is :
View SolutionThe inequation that best describes the graph given below is _________
View SolutionThe inequation that best describes the following graph is _________
View SolutionWhich inequations represent the shaded region in the given figure
View Solution
