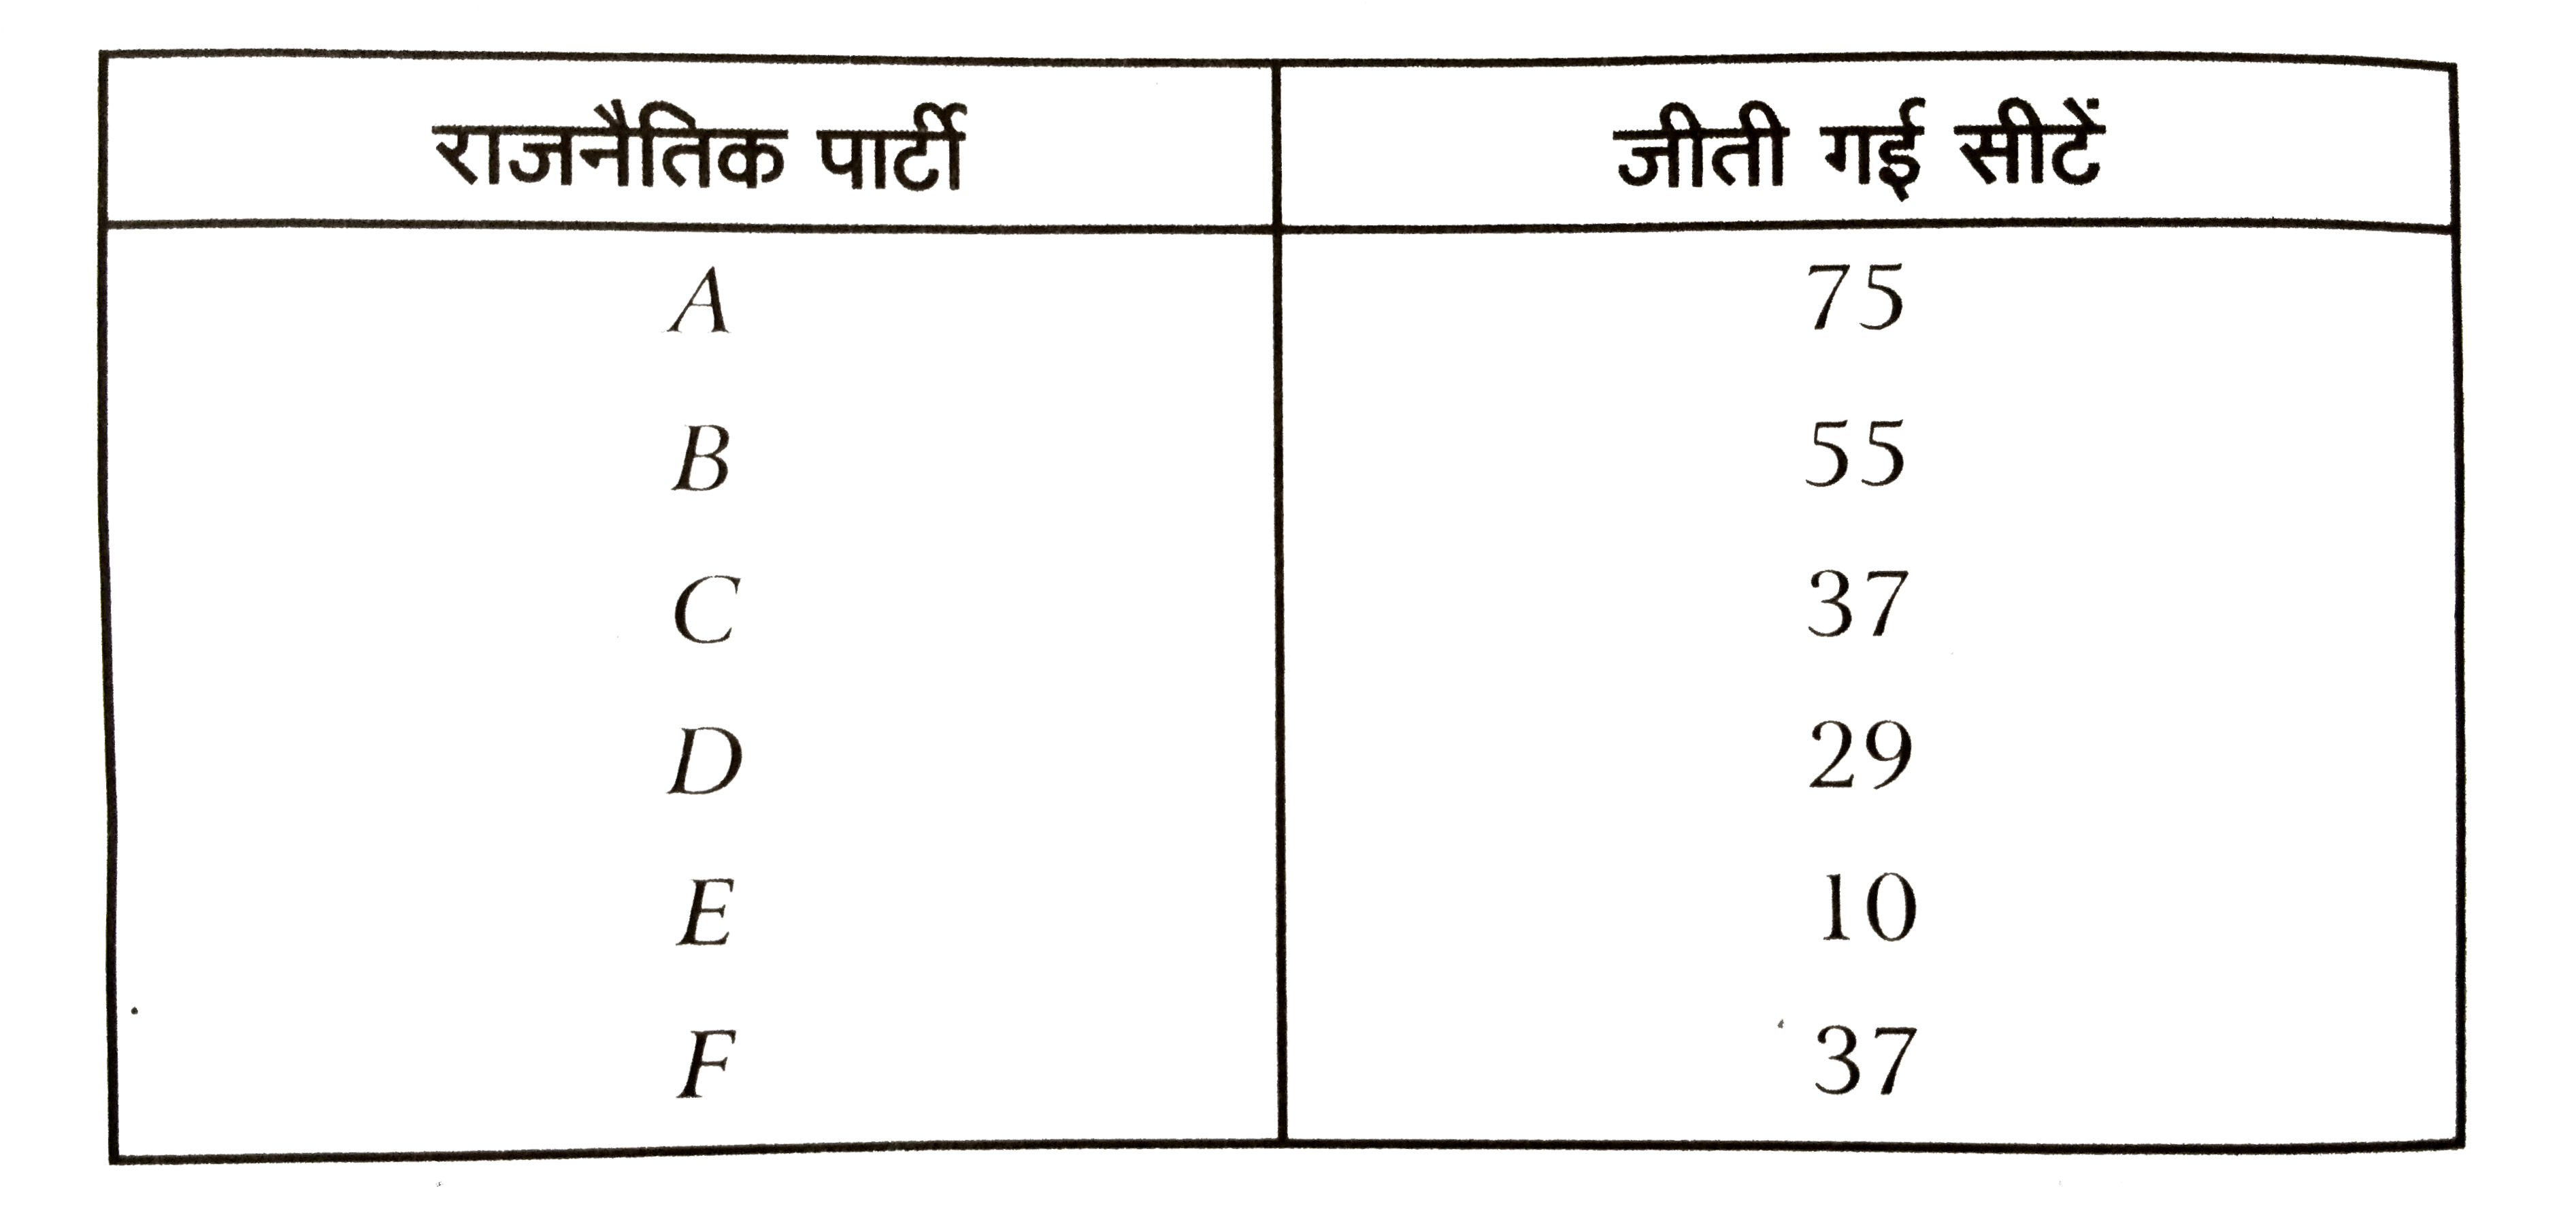
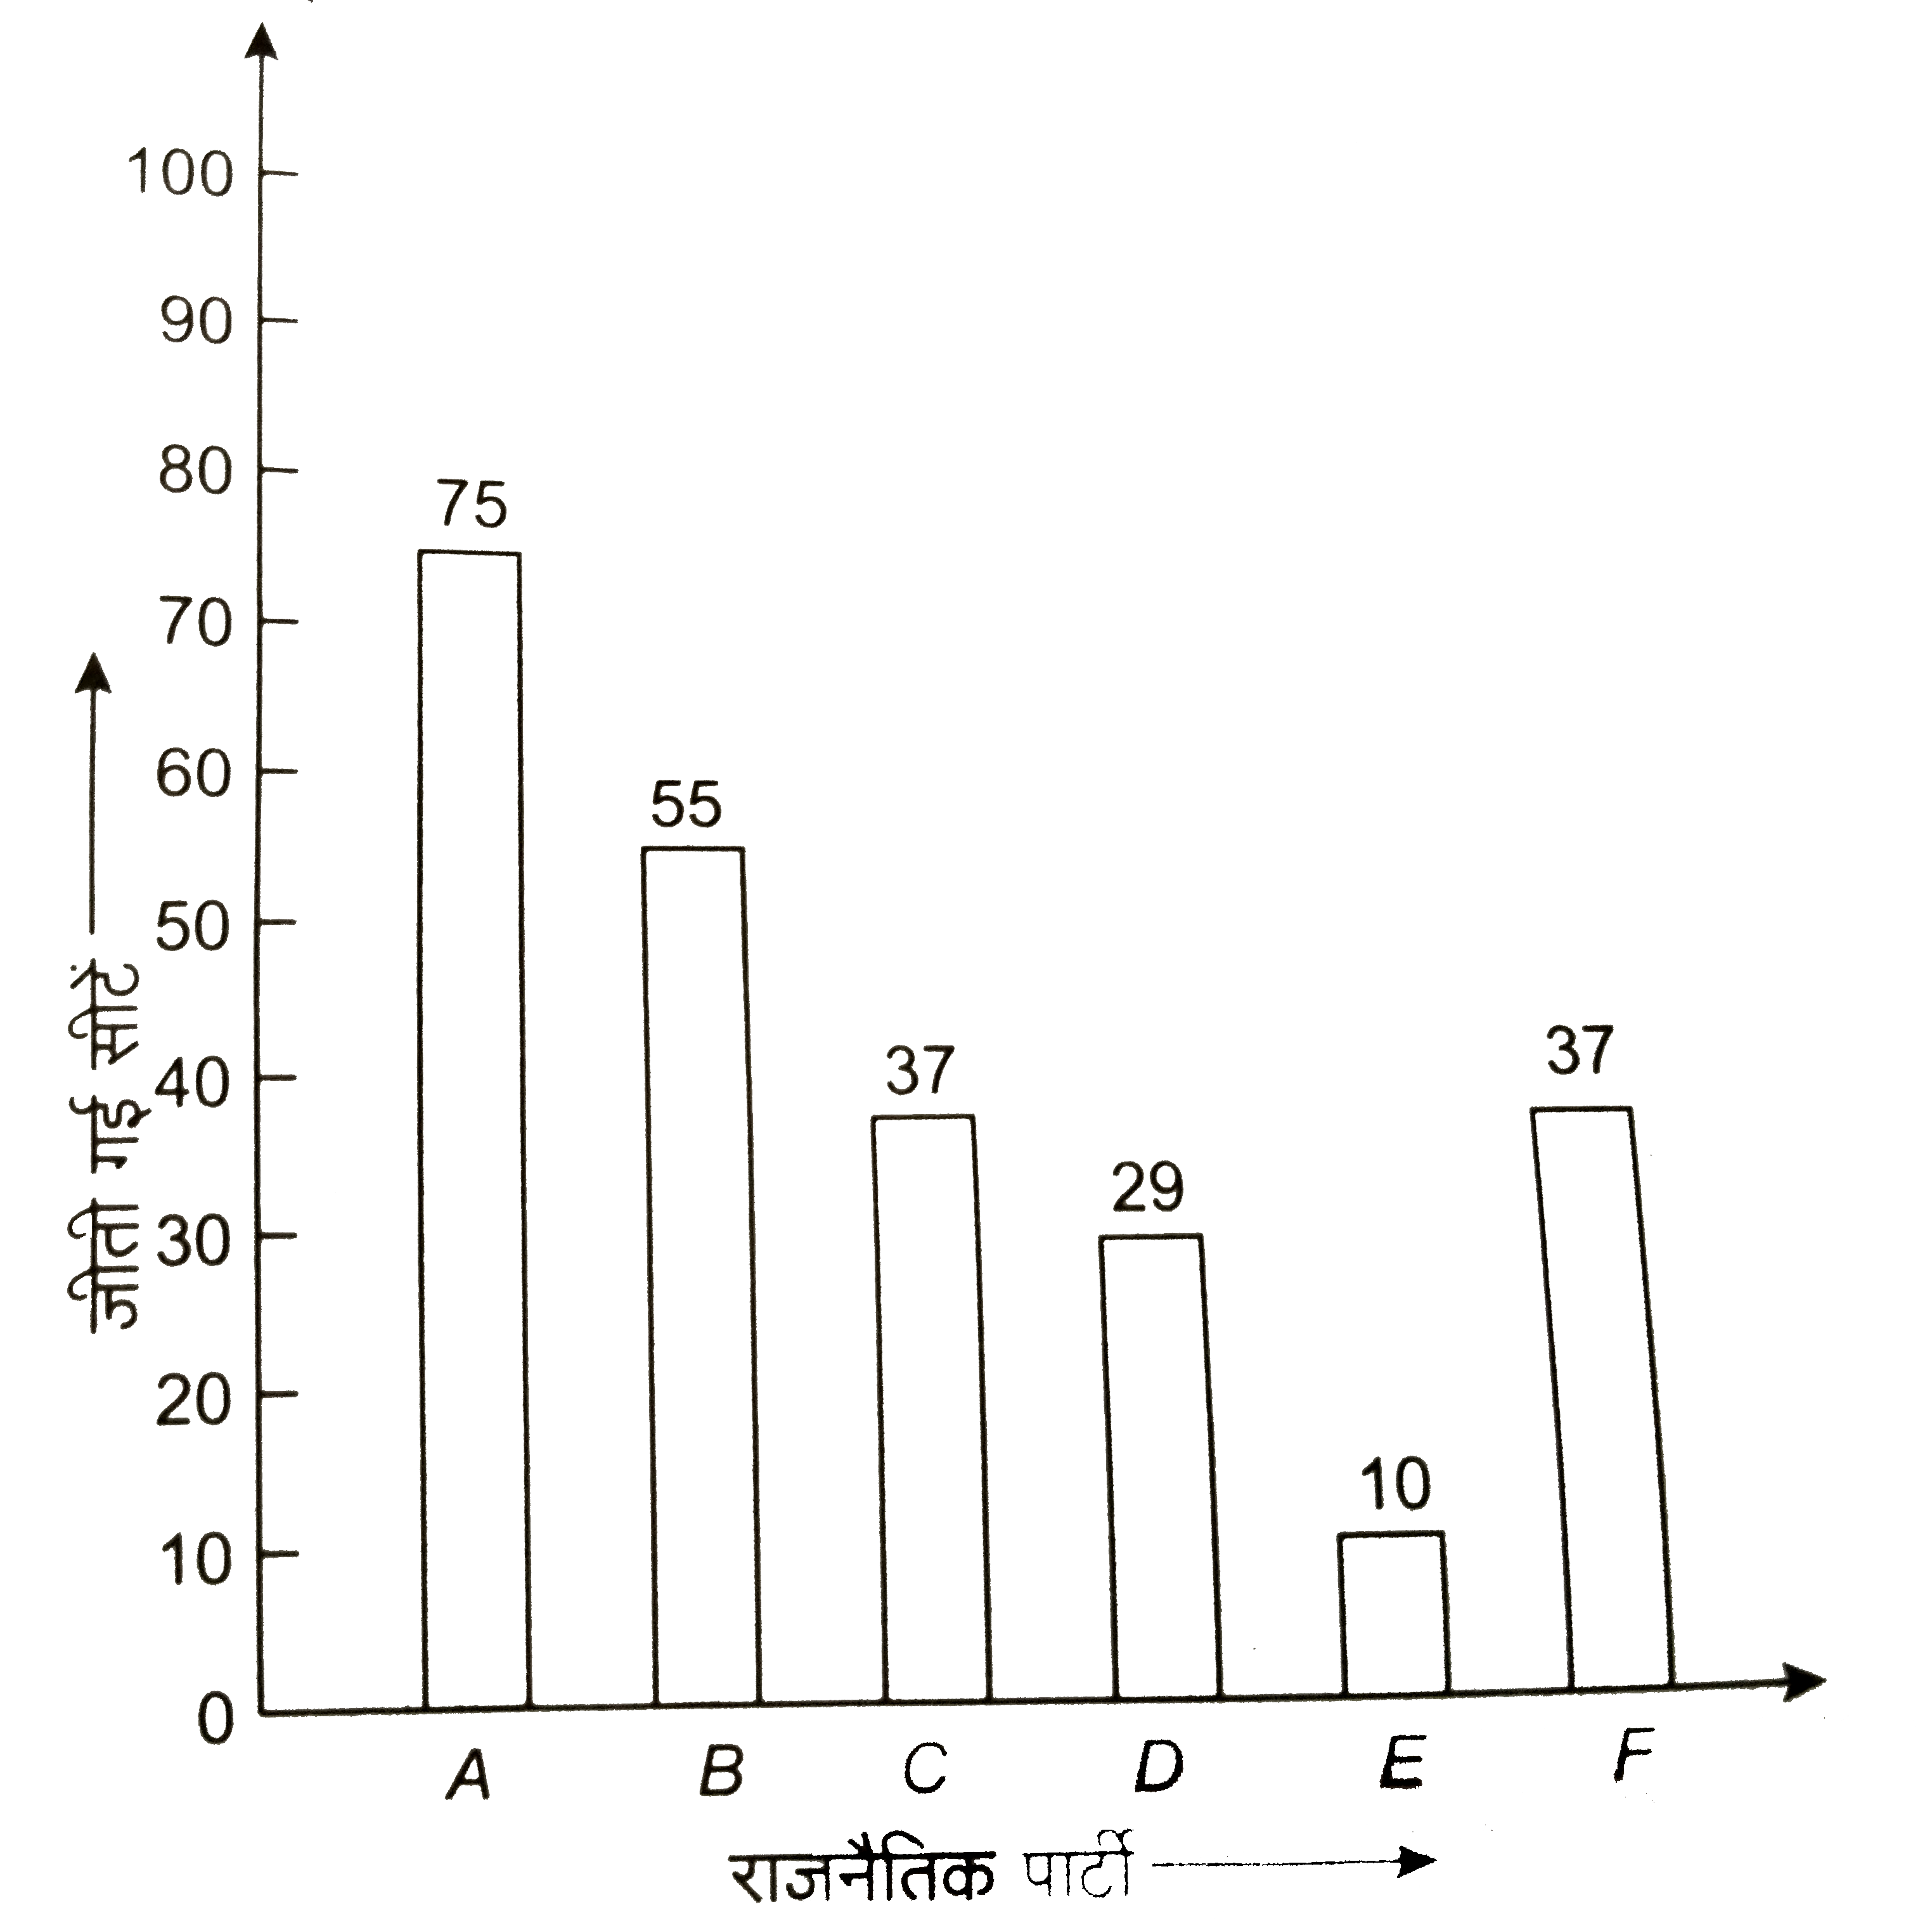
Given below are the seats won by different political parties in the polling outcome of a state assembly elections :

(i) Draw a bar graph to represent the polling results. (ii) Which political party won the maximum number of seats?Solution in Gujrati
Step by step video & image solution for Given below are the seats won by different political parties in the polling outcome of a state assembly elections : (i) Draw a bar graph to represent the polling results. (ii) Which political party won the maximum number of seats? by Maths experts to help you in doubts & scoring excellent marks in Class 9 exams.
Updated on:21/07/2023Topper's Solved these Questions
- STATISTICSBOOK - KUMAR PRAKASHANCHAPTER - STATISTICSEXERCISE - EXERCISE 14.4
6 Videos
- STATISTICSBOOK - KUMAR PRAKASHANCHAPTER - STATISTICSEXERCISE - SUM TO ENRICH REMEMBER
14 Videos
- STATISTICSBOOK - KUMAR PRAKASHANCHAPTER - STATISTICSEXERCISE - EXERCISE 14.2
9 Videos
- QUESTION PAPER 3 : FOR THE ANNUAL EXAMINATION BOOK - KUMAR PRAKASHANCHAPTER - QUESTION PAPER 3 : FOR THE ANNUAL EXAMINATION EXERCISE - SECTION -D
5 Videos
- SURFACE AREAS AND VOLUMESBOOK - KUMAR PRAKASHANCHAPTER - SURFACE AREAS AND VOLUMESEXERCISE - MULTIPLE CHOICE QUESTIONS
18 Videos
Similar Questions
The following number of goals were scored by a team in a series of 10 matches : 2, 3, 4, 5, 0, 1, 3, 3, 4, 3 Find the mean, median and mode of these scores.
View SolutionConsider the marks obtained by 10 students in a mathematics test as given below: 55 36 95 73 60 42 25 78 75 62 Find the range of the data.
View SolutionThe blood groups of 30 students of Class VIII are recorded as follows: A, B, O, O, AB, O, A, O, B, A, O, B, A, O, O, A, AB, O, A, A, O, O, AB, B, A, O, B, A, B, O. Represent this data in the form of a frequency distribution table. Which is the most common, and which is the rarest, blood group among these students ?
View SolutionProve that the angles opposite to equal sides of an isosceles triangle are equal.
View SolutionThe total surface area of a cuboid with length 20 cm, breadth 15 cm and height 10 cm is ……… cm2.
View SolutionGiven below are the seats won by different political parties in the polling outcome of a state assembly elections: (i) Draw a bar graph to represent the polling result

View SolutionGiven below are the seats won by different political parties in the polling outcome of a state assembly elections

(i) Draw a bar graph to represent the polling results.
(ii) Which political party won the maximum number of seats?
View SolutionMatch the following Column A to Column B

View SolutionThe inequation represented by the graph given below is :
View SolutionThe inequation that best describes the graph given below is _________
View SolutionThe inequation that best describes the following graph is _________
View Solutionएक राज्य के विधान सभा के चुनाव में विभिन्न राजनैतिक पार्टियों द्वारा जीती गई सीटों के परिणाम नीचे दिए गए हैं:

(i) मतदान के परिणामों को निरूपित करने वाला एक दंड आलेख खीचिए।
(ii) किस राजनैतिक पार्टी ने अधिकतम सीटें जीती हैं।
View Solution

(i) मतदान के परिणामों को निरूपित करने वाला एक दंड आलेख खींचिए|
(ii) किस राजनैतिक पार्टी ने अधिकतम सीटें जीती है ?

View SolutionGiven below are the seats won by different political parties in the polling outcome of a state assembly elections:

(i) Draw a bar graph to represent the polling results.
View SolutionGiven below are the seats won by different political parties in the polling outcome of a state assembly elections:

(ii) Which political party won the maximum number of seats ?
View Solution
