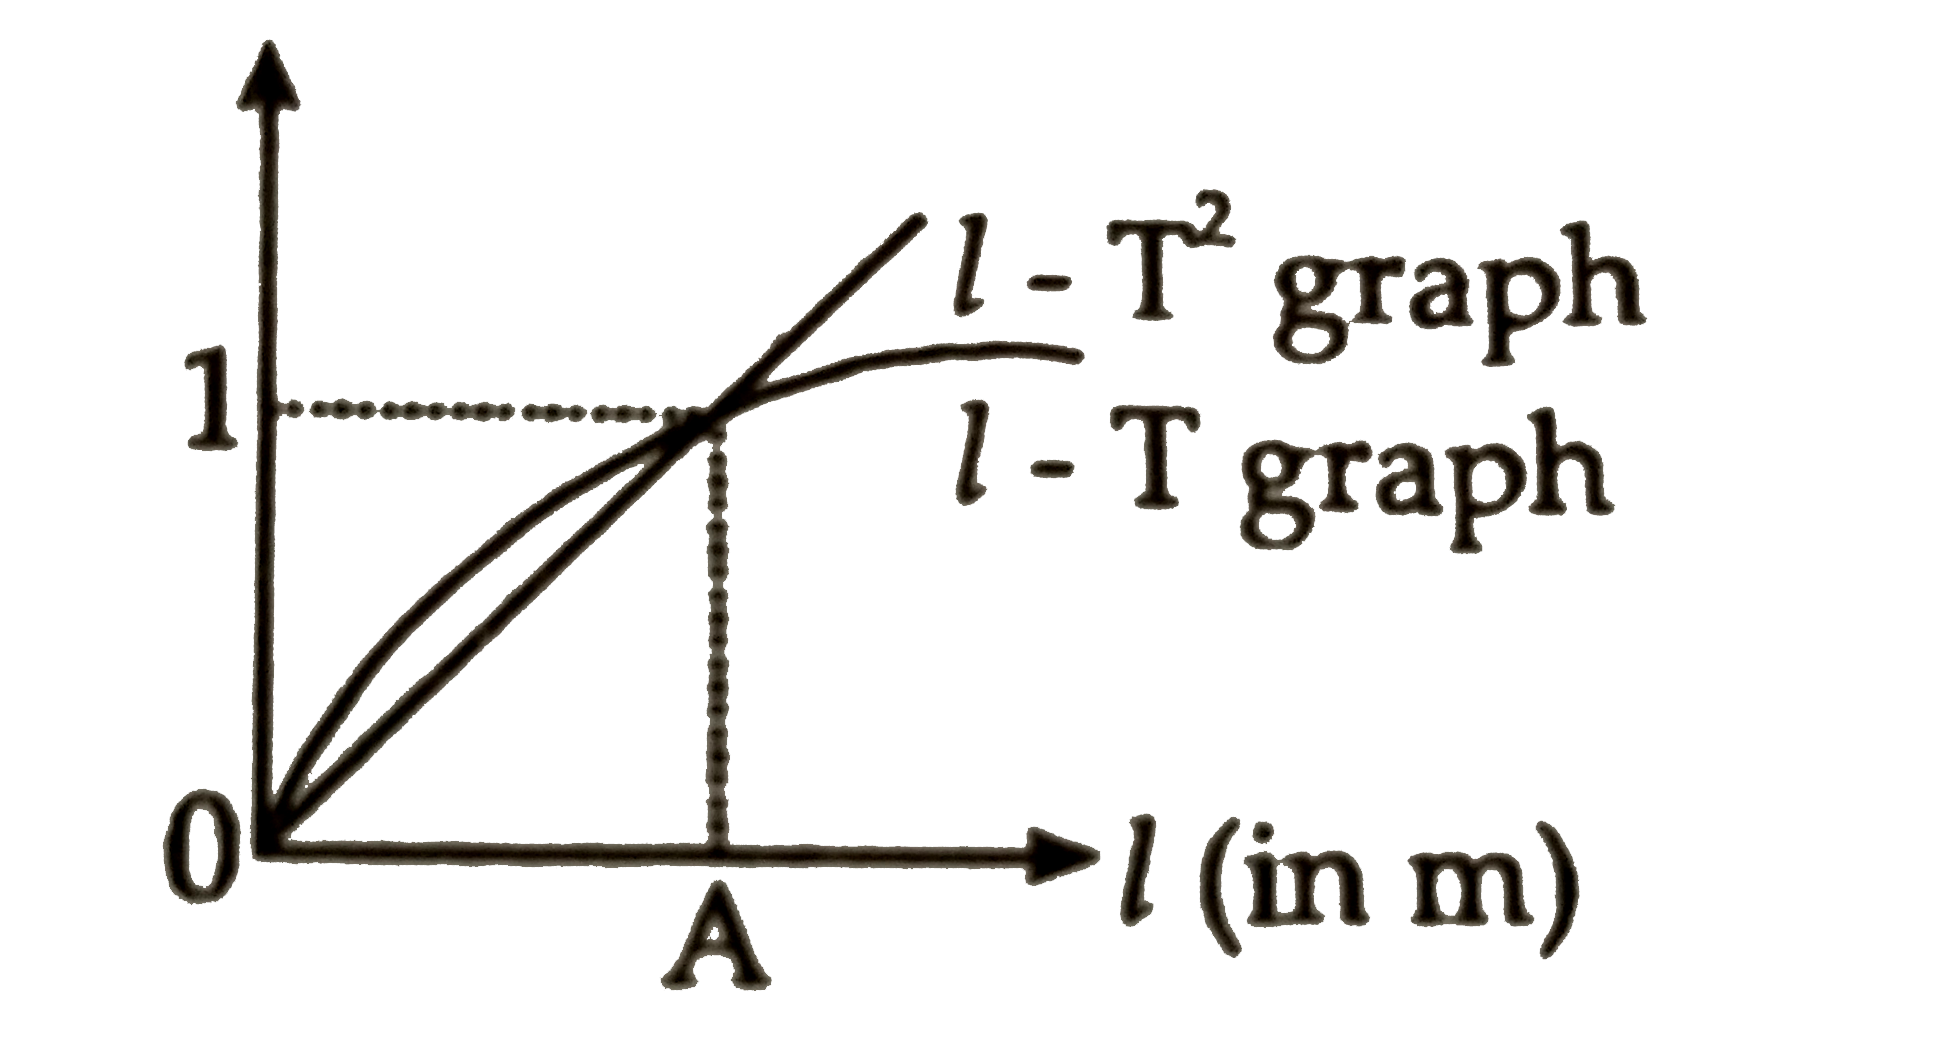
The shape of l-T graph of simple pendulum is
Straight line
parabola
curve
Hyperbole
The correct Answer is:B
Topper's Solved these Questions
- OSCILLATIONSBOOK - AAKASH SERIESCHAPTER - OSCILLATIONSEXERCISE - Practice exercise
140 Videos
- OSCILLATIONSBOOK - AAKASH SERIESCHAPTER - OSCILLATIONSEXERCISE - EXERCISE -I Equation of S.H.M
51 Videos
- OSCILLATIONSBOOK - AAKASH SERIESCHAPTER - OSCILLATIONSEXERCISE - EXERCISE I
184 Videos
- OSCILLATIONBOOK - AAKASH SERIESCHAPTER - OSCILLATIONEXERCISE - QUESTIONS FOR DESCRIPTIVE ANSWERS
12 Videos
- PHYSICAL WORLDBOOK - AAKASH SERIESCHAPTER - PHYSICAL WORLDEXERCISE - VERY SHORT ANSWER TYPE QUESTIONS
5 Videos
Similar Questions
Knowledge Check
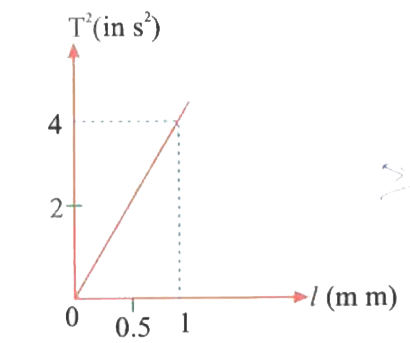
The l−T2 graph of a simple pendulum is an shown in the figure. The time period of the pendulum of length 0.5 mm is
 A1sB1.2 sC√2 sD1√2s
The period (T) of a simple pendulum is measured for different length (L), then graph of Log T against log L is
Aa parabolaBa circleCa straight line with a slope 12Da straight line with a slope 2The graph between the length and square of the period of a simple pendulum is a
AcircleBparabolaCstraight lineDhyperbola
The time period of a simple pendulum is given by T=2π√lg
where 'l' is the length of the pendulum and 'g' is the acceleration due to gravity at that place.
(a) Express 'g' in terms of T
(b) What is the length of the seconds pendulum ? (Take g=10ms−2)
View SolutionThe graph of l against T for a simple pendulum is
View SolutionList - IList - II(A) x-t graph of simple harmonic oscillator(E) Straight line with +ve slope(B) a-x graph of SHO(F) Straight line with -ve slope(C) l-T graph of a simple pendulum(G) Sine curve(D) l-T2graph of a simple pendulum(H) Parabola
View SolutionThe graph of time period (T) of simple pendulum versus its length (l) is
View SolutionThe graph between time period (T) and length (l) of a simple pendulum is
View Solution

