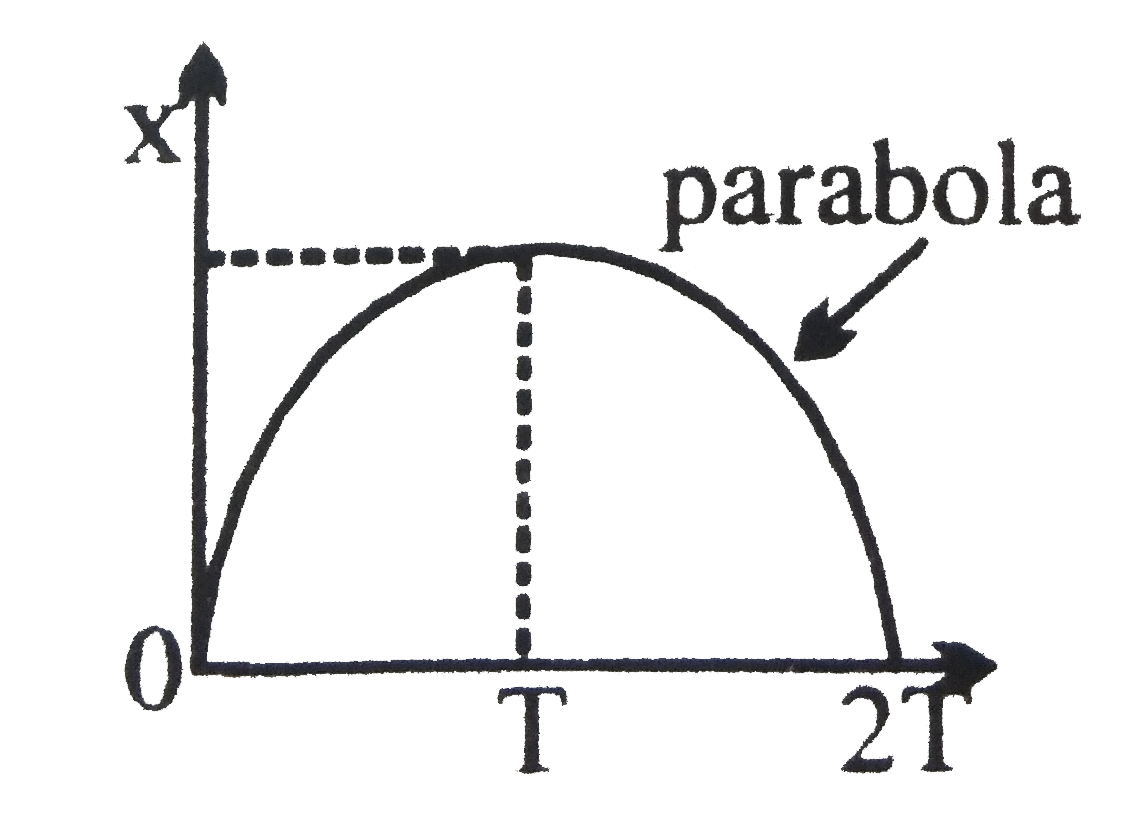
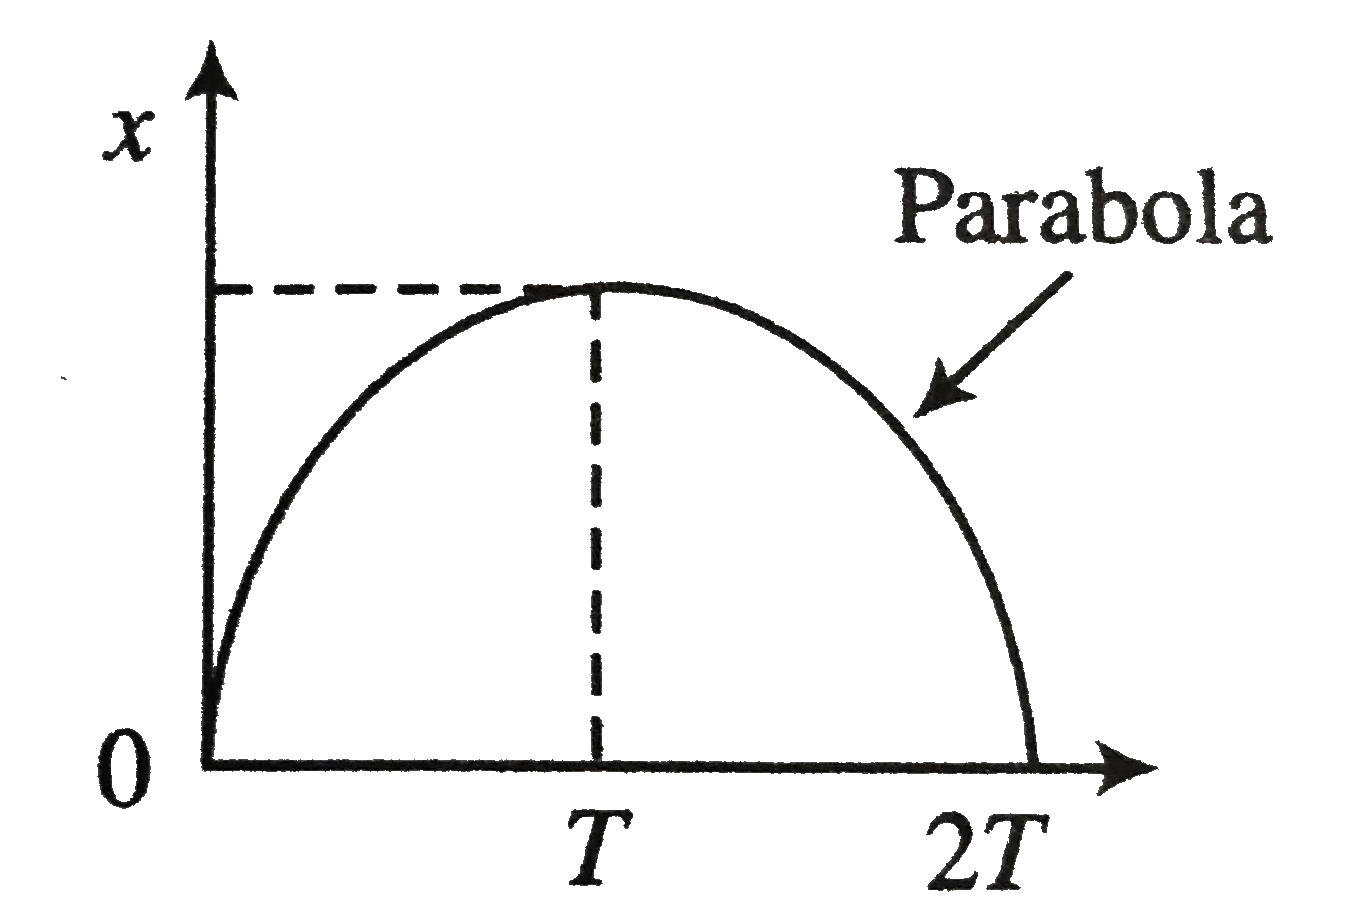
List - IList - II(A) x-t graph of simple harmonic oscillator(E) Straight line with +ve slope(B) a-x graph of SHO(F) Straight line with -ve slope(C) l-T graph of a simple pendulum(G) Sine curve(D) l-T2graph of a simple pendulum(H) Parabola
a - e, b - f, c - g, d - h
a - g, b - f, c - h, d - e
a - g, b - e, c - h, d - f
a - g, b - f, c - e, d - h
The correct Answer is:B
To solve the problem of matching the items in List I with those in List II, we will analyze each item in List I and determine the corresponding item in List II based on the characteristics of the graphs involved.
1. Identify the x-t graph of a simple harmonic oscillator (SHO):
- The displacement x of a simple harmonic oscillator varies sinusoidally with time t. The general equation is given by:
x(t)=Asin(ωt+ϕ)
- This graph is a sine curve, which oscillates between +A and −A.
- Match: (A) corresponds to (G) Sine curve.
2. Identify the a-x graph of SHO:
- The acceleration a of a simple harmonic oscillator is proportional to the negative of the displacement x:
a=−ω2x
- This relationship indicates that the graph of acceleration versus displacement is a straight line with a negative slope.
- Match: (B) corresponds to (F) Straight line with -ve slope.
3. Identify the l-T graph of a simple pendulum:
- The time period T of a simple pendulum is given by:
T=2π√Lg
- When plotting L against T, it resembles a square root function, which is a part of a parabola.
- Match: (C) corresponds to (H) Parabola.
4. Identify the l-T² graph of a simple pendulum:
- If we square the time period equation, we get:
T2=4π2gL
- This is a linear relationship between T2 and L, which can be expressed in the form y=mx where m is positive.
- Match: (D) corresponds to (E) Straight line with +ve slope.
Final Matches:
- (A) → (G) Sine curve
- (B) → (F) Straight line with -ve slope
- (C) → (H) Parabola
- (D) → (E) Straight line with +ve slope
Summary of Matches:
- A - G
- B - F
- C - H
- D - E
- The displacement x of a simple harmonic oscillator varies sinusoidally with time t. The general equation is given by:
x(t)=Asin(ωt+ϕ)
- This graph is a sine curve, which oscillates between +A and −A.
- Match: (A) corresponds to (G) Sine curve.
- The acceleration a of a simple harmonic oscillator is proportional to the negative of the displacement x:
a=−ω2x
- This relationship indicates that the graph of acceleration versus displacement is a straight line with a negative slope.
- Match: (B) corresponds to (F) Straight line with -ve slope.
- The time period T of a simple pendulum is given by:
T=2π√Lg
- When plotting L against T, it resembles a square root function, which is a part of a parabola.
- Match: (C) corresponds to (H) Parabola.
- If we square the time period equation, we get:
T2=4π2gL
- This is a linear relationship between T2 and L, which can be expressed in the form y=mx where m is positive.
- Match: (D) corresponds to (E) Straight line with +ve slope.
- (A) → (G) Sine curve
- (B) → (F) Straight line with -ve slope
- (C) → (H) Parabola
- (D) → (E) Straight line with +ve slope
- A - G
- B - F
- C - H
- D - E
Topper's Solved these Questions
- BOOK - NARAYNACHAPTER - OSCILLATIONSEXERCISE - EXERCISE - II (H.W)19videos
OSCILLATIONS
- BOOK - NARAYNACHAPTER - OSCILLATIONSEXERCISE - EXERCISE - III29videos
OSCILLATIONS
- BOOK - NARAYNACHAPTER - OSCILLATIONSEXERCISE - EXERCISE - I (H.W)66videos
OSCILLATIONS
- BOOK - NARAYNACHAPTER - NEWTONS LAWS OF MOTIONEXERCISE - PASSAGE TYPE QUESTION6videos
NEWTONS LAWS OF MOTION
- BOOK - NARAYNACHAPTER - PHYSICAL WORLDEXERCISE - C.U.Q10videos
PHYSICAL WORLD
Similar Questions
Knowledge Check
- Question 1 - Select One
The graph of l against T for a simple pendulum is
Aa curveBa straight lineCa parabolaDan ellipse - Question 2 - Select One
The x−t graph of particle moving along a straight line is shown in figure
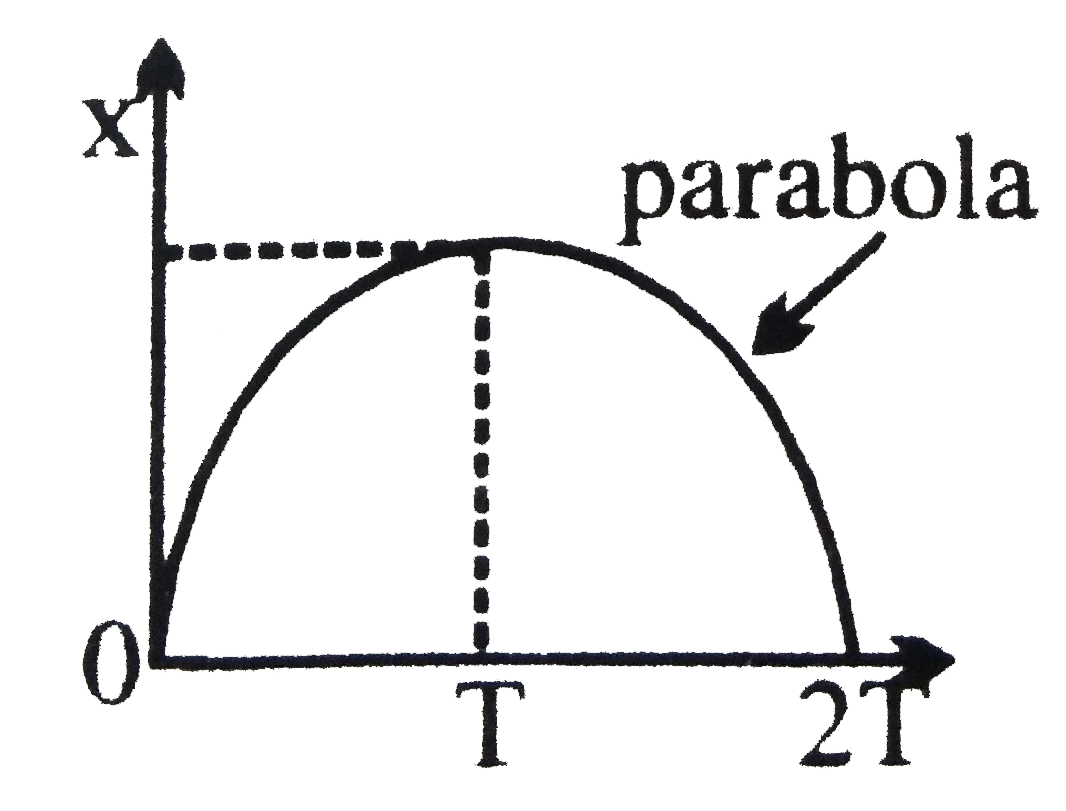
The a−t graph of the particle is correctly shown byA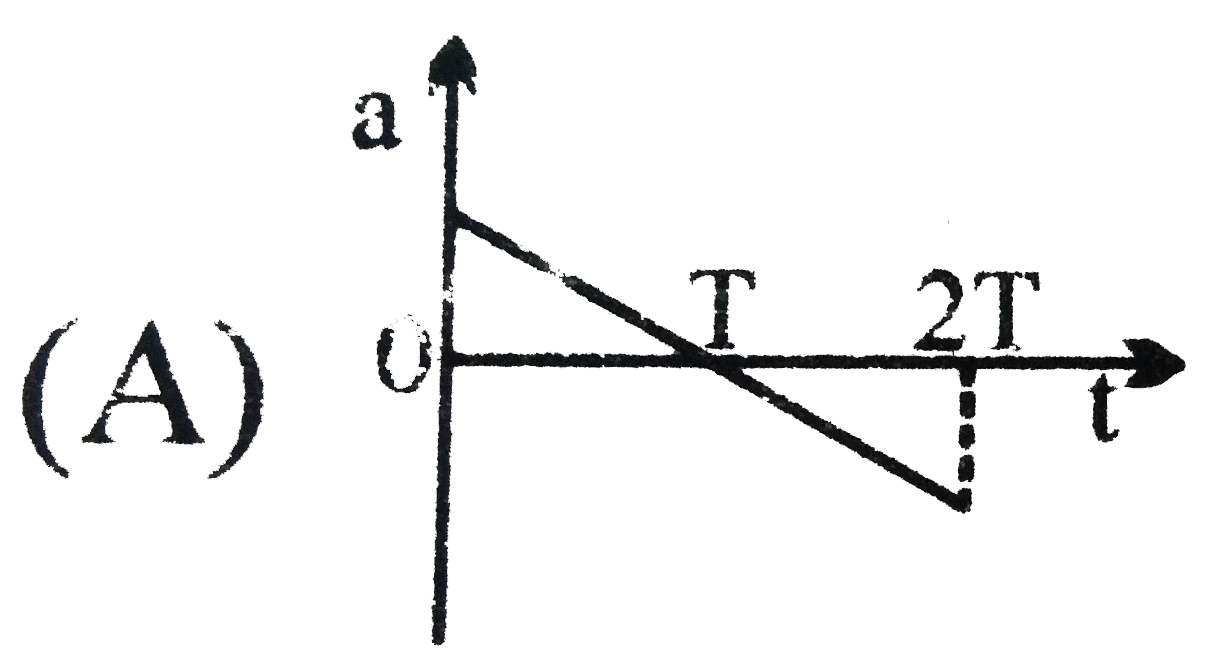 B
B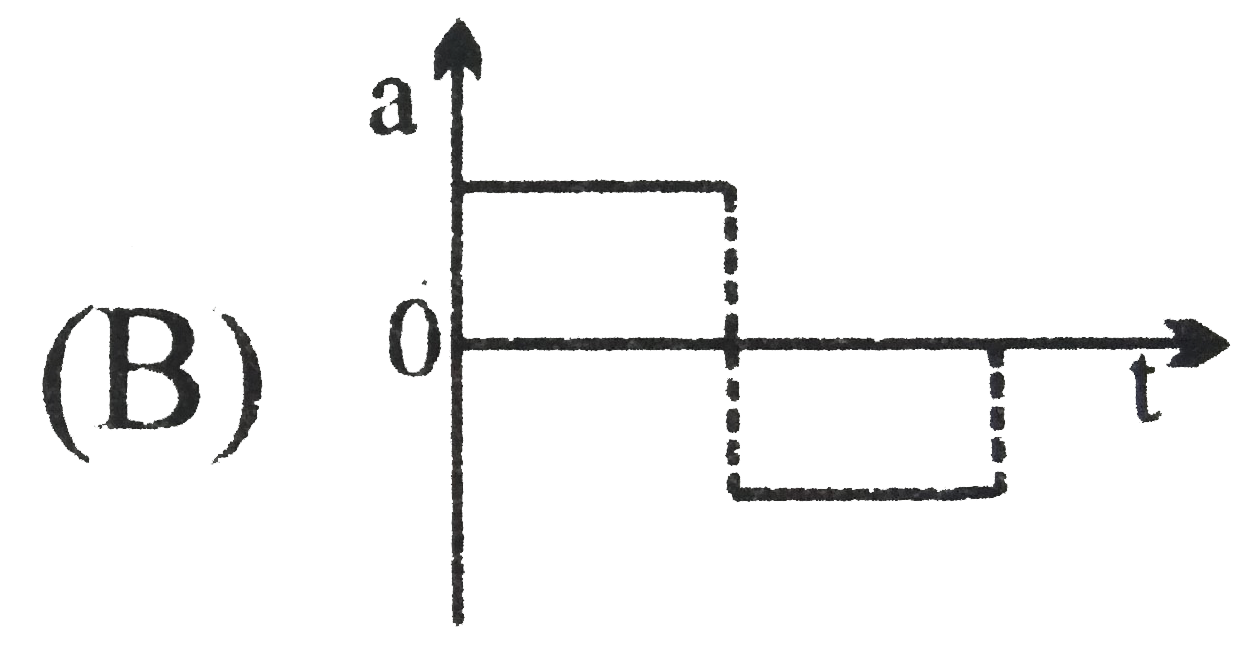 C
C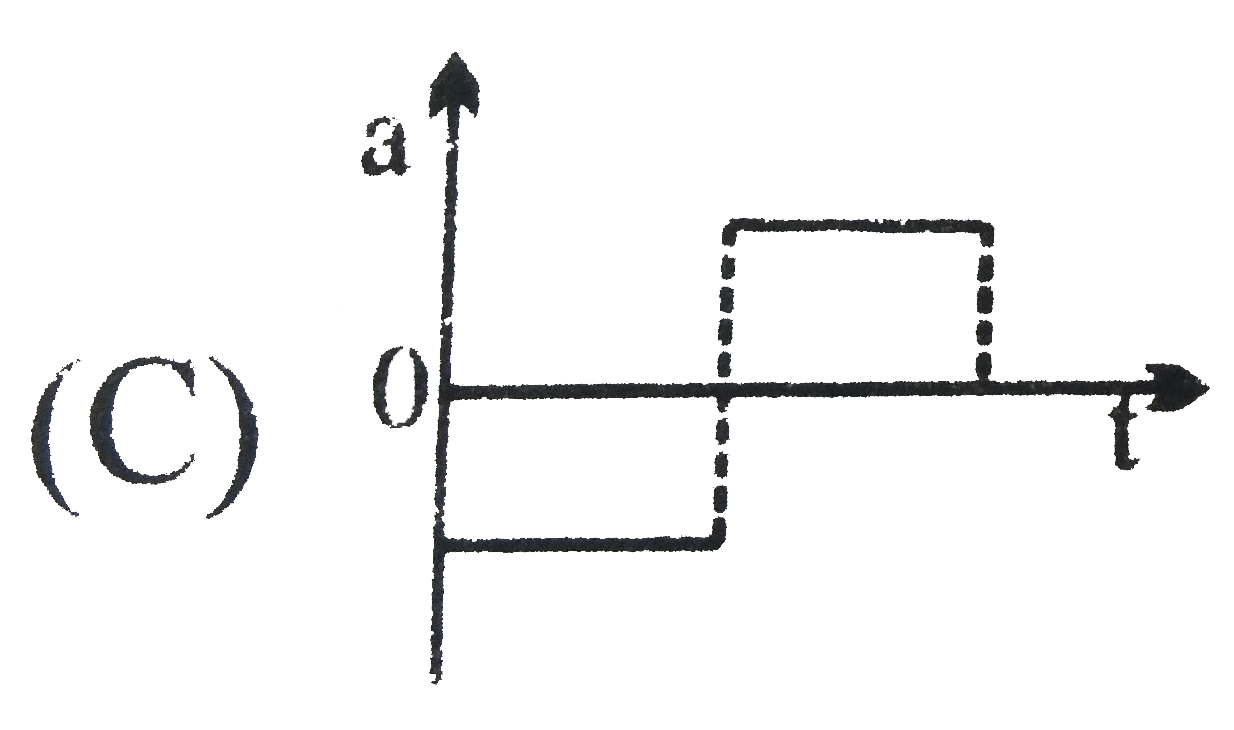 D
D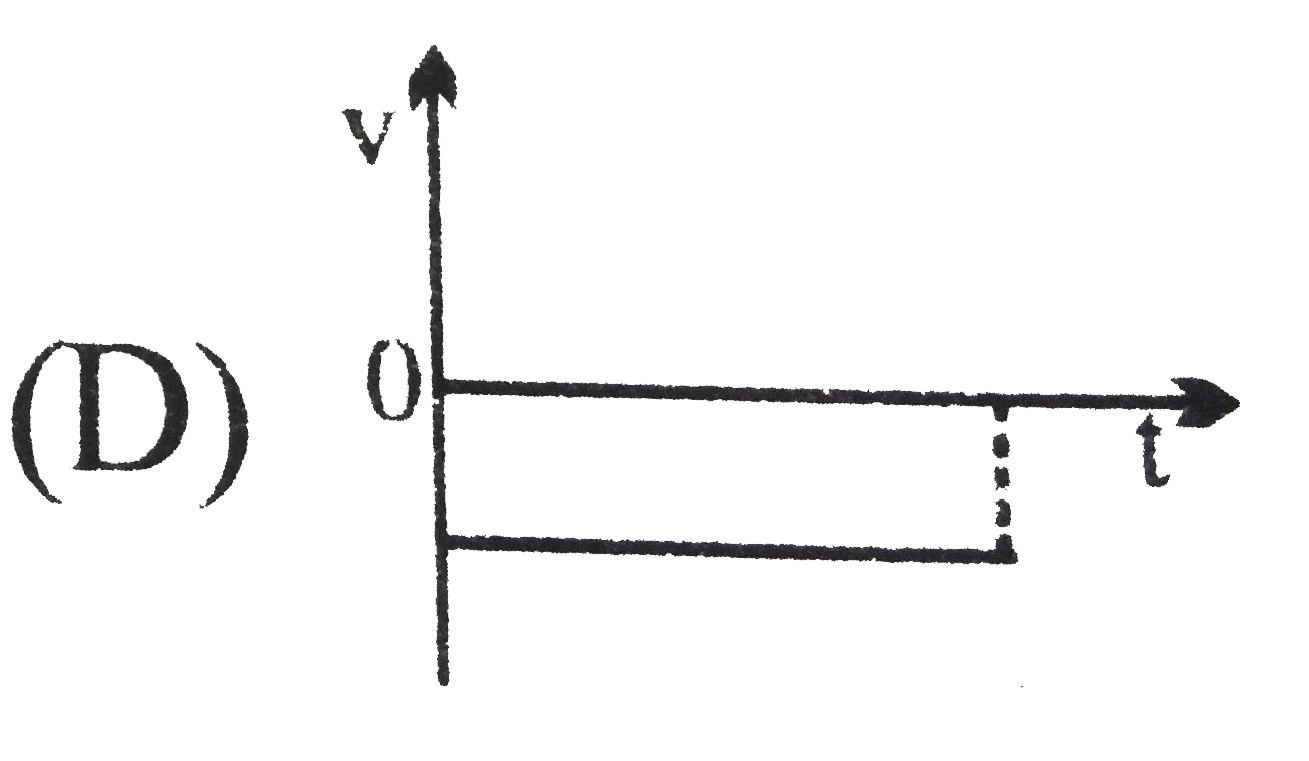
- Question 3 - Select One
The graph between time period (T) and length (l) of a simple pendulum is
A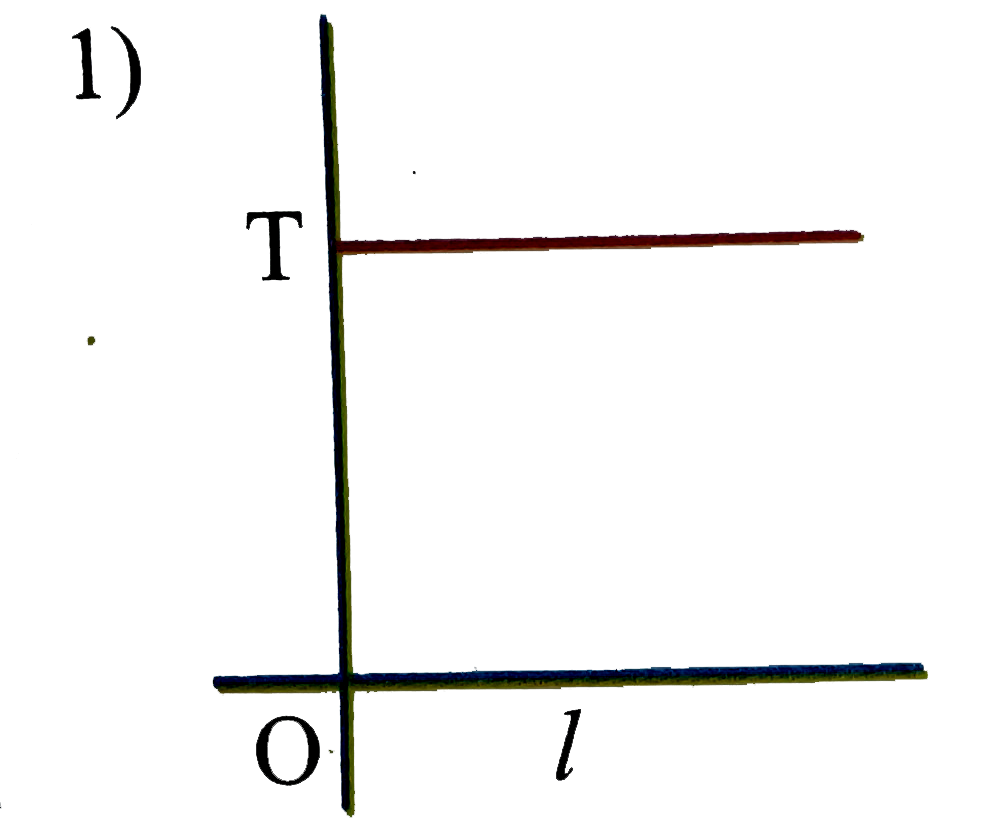 B
B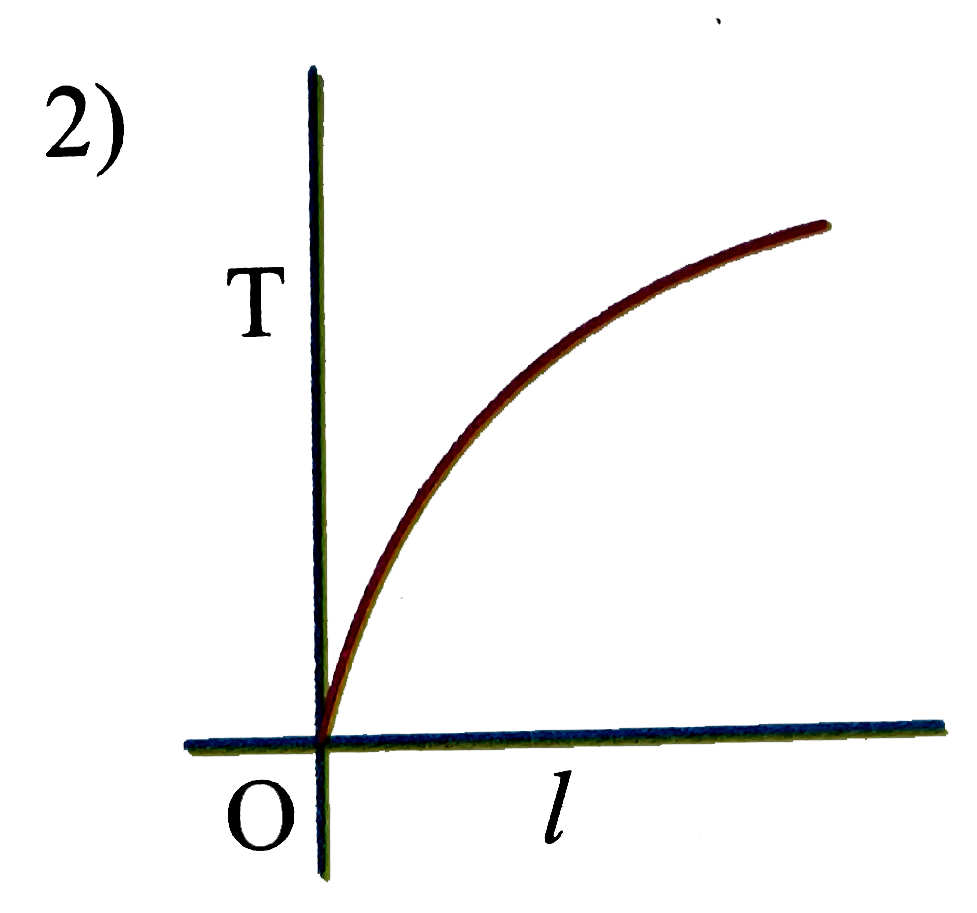 C
C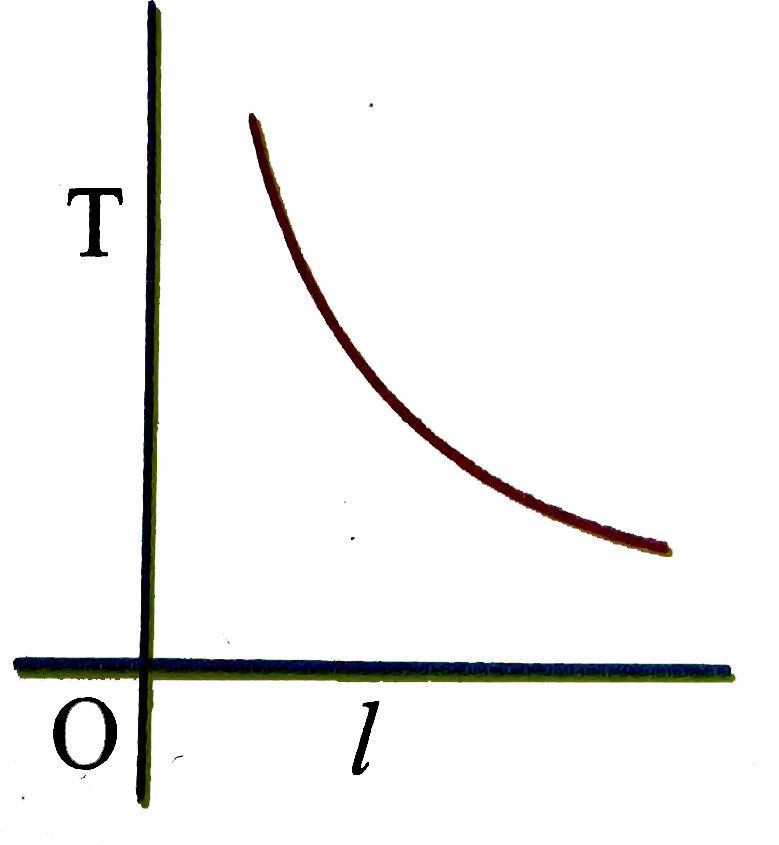 D
D
The x-t graph of a particle moving along a straight line is shown in figure

The v-t graph of the particle is correctly shown byView SolutionThe x−t graph of particle moving along a straight line is shown in figure
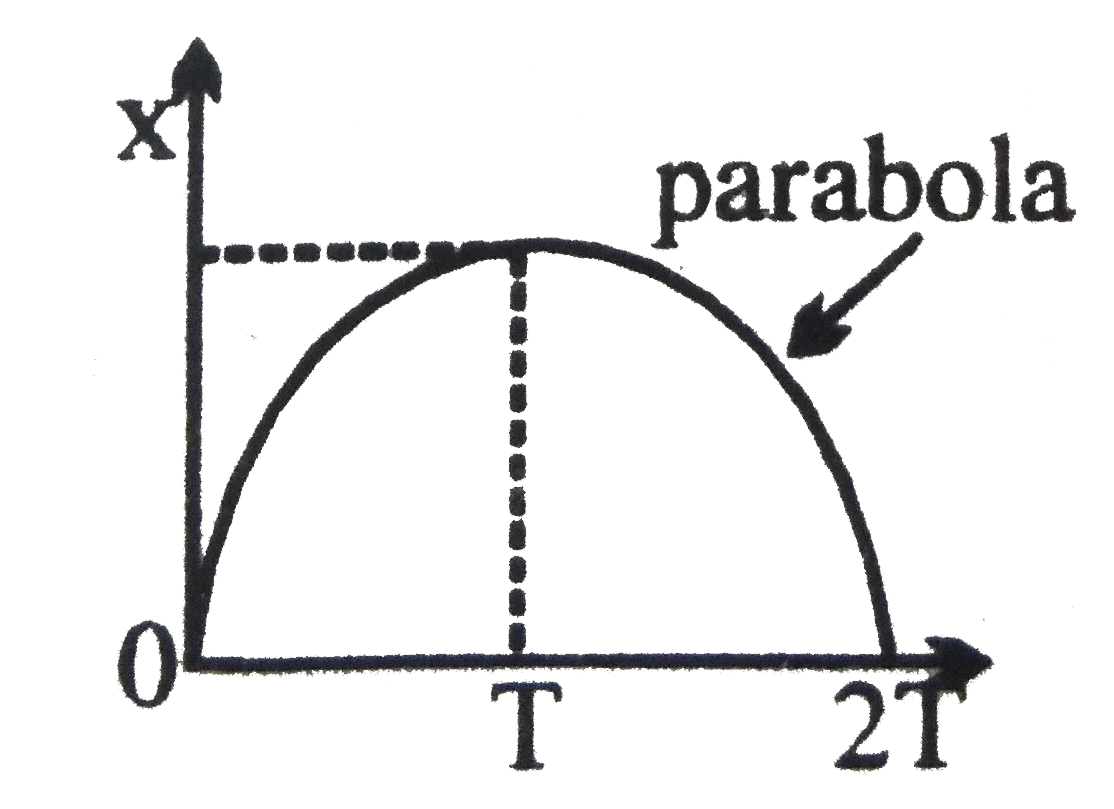
The speed-time graph of the particle si correctly shown byView SolutionThe x-t graph of a particle moving along a straight line is shown in figure
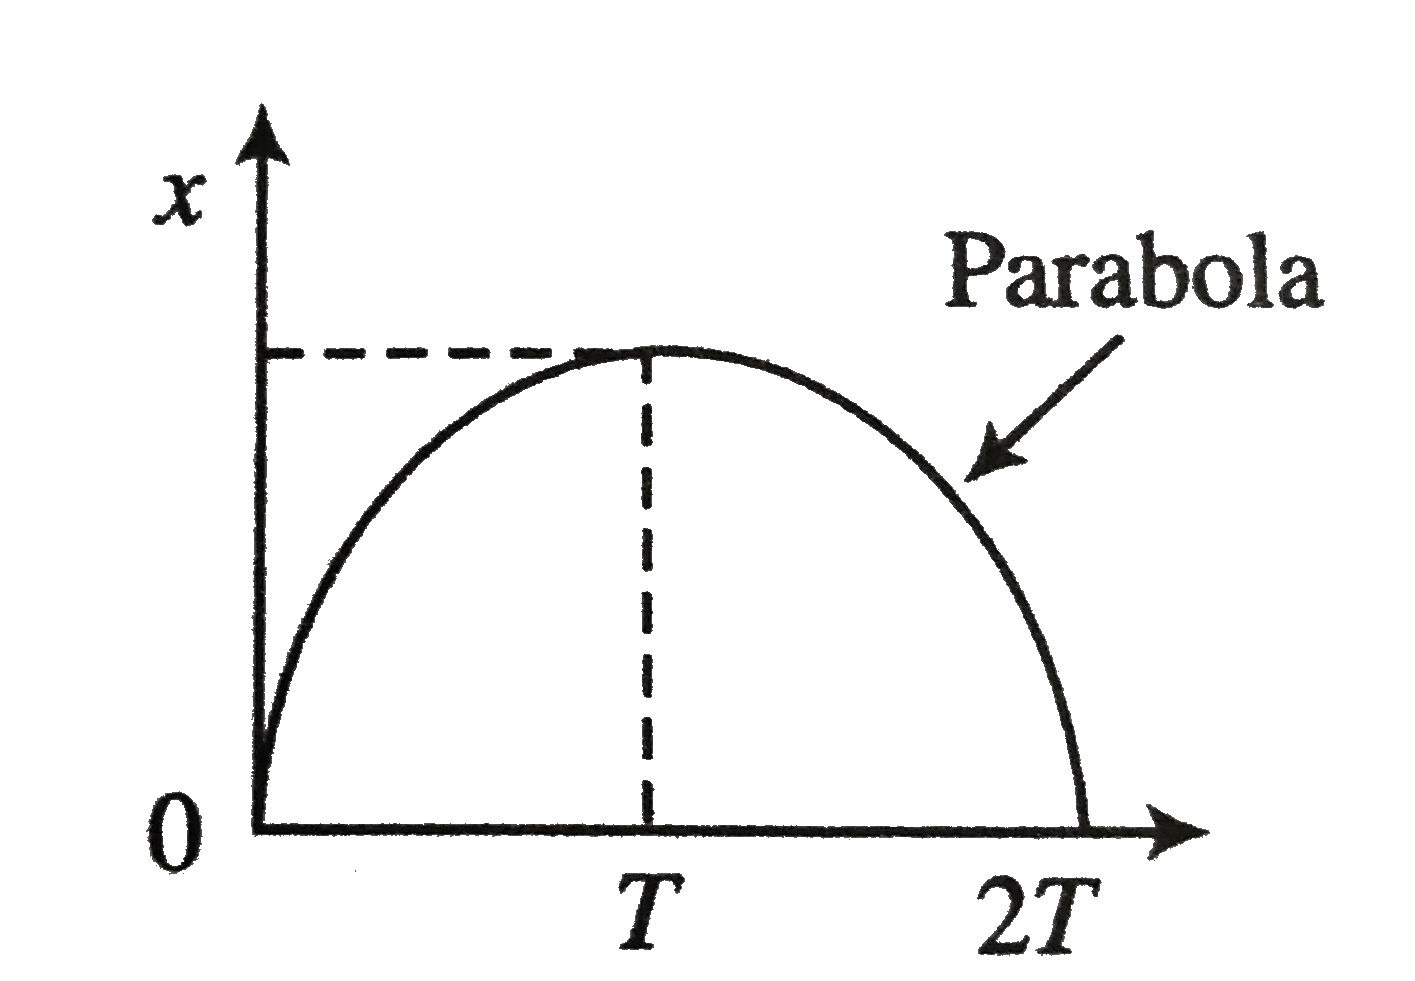
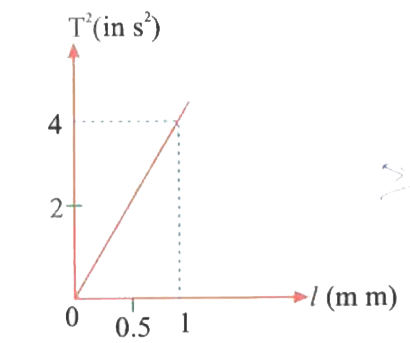
The speed-time graph of the particle is correctly shown byView SolutionThe l−T2 graph of a simple pendulum is an shown in the figure. The time period of the pendulum of length 0.5 mm is
 View Solution
The graph of time period (T) of simple pendulum versus its length (l) is
View Solution


