Which one of the given graphs shows the effect of pH on the velocity of a typical enzymatic reaction (V) ?
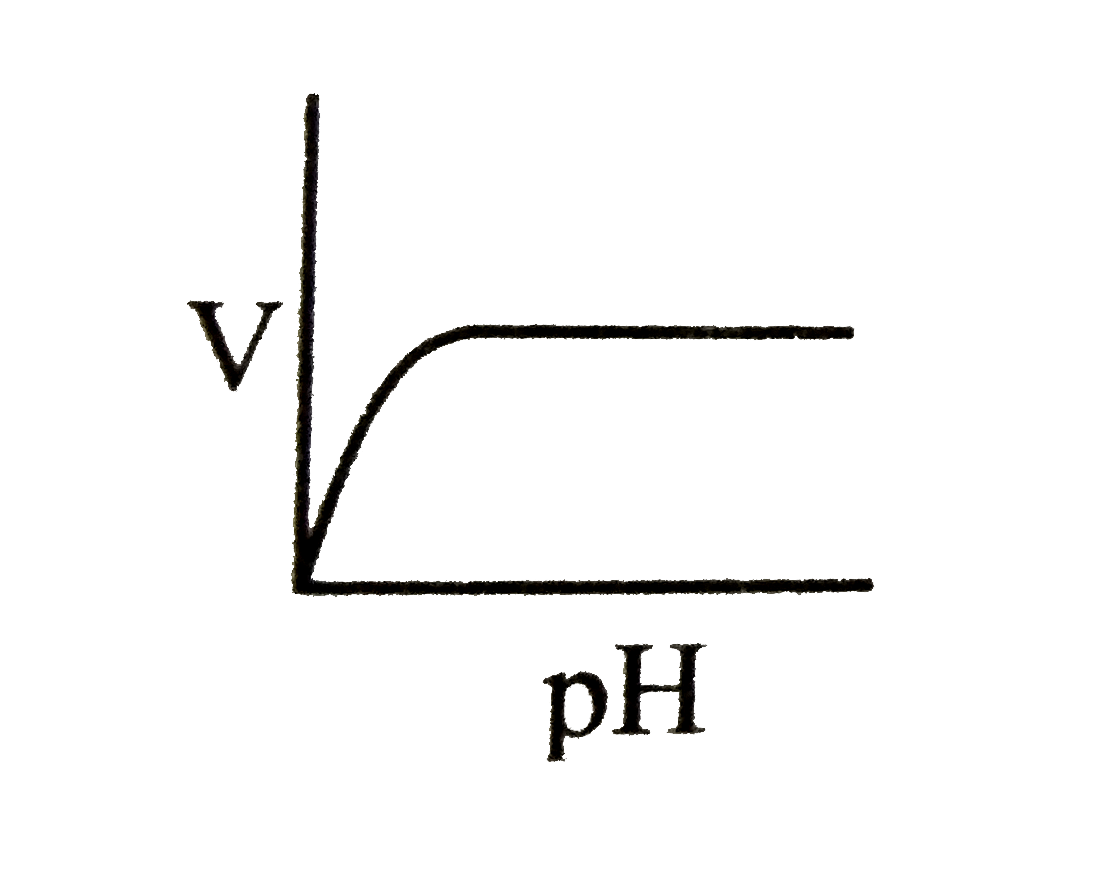
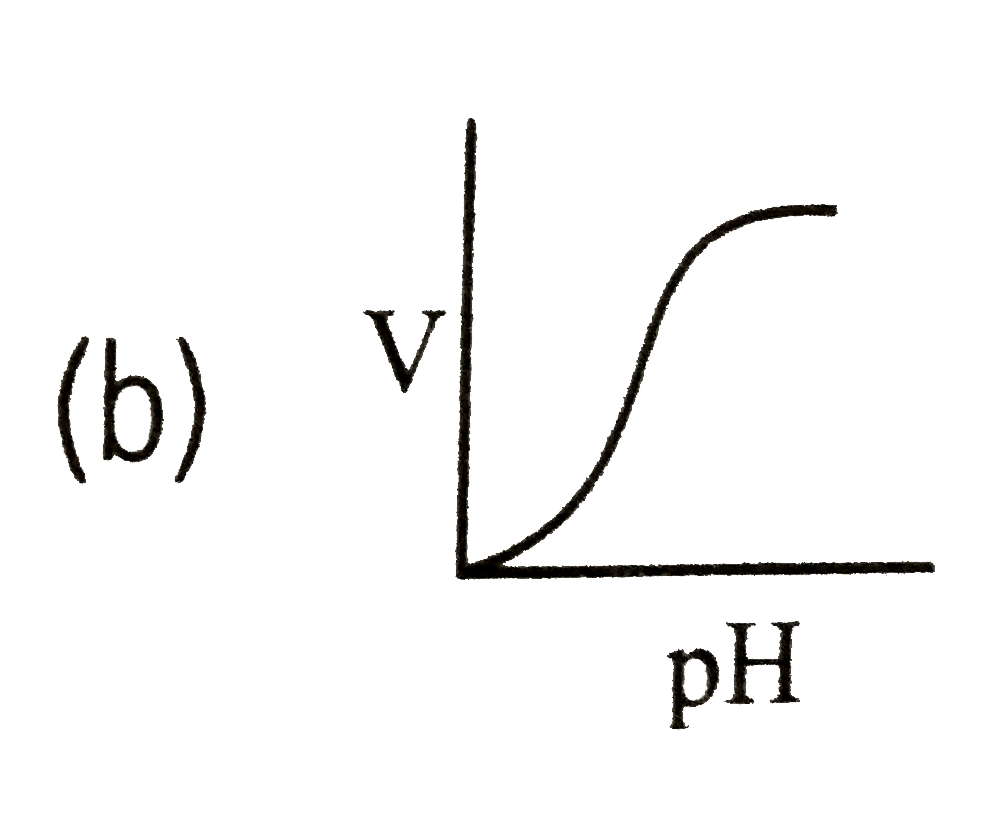
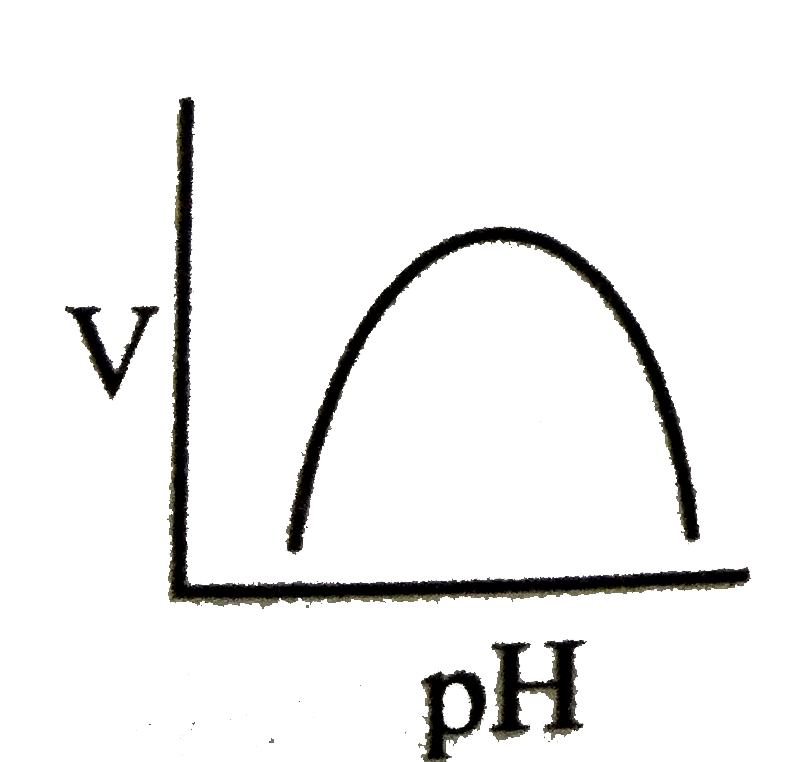
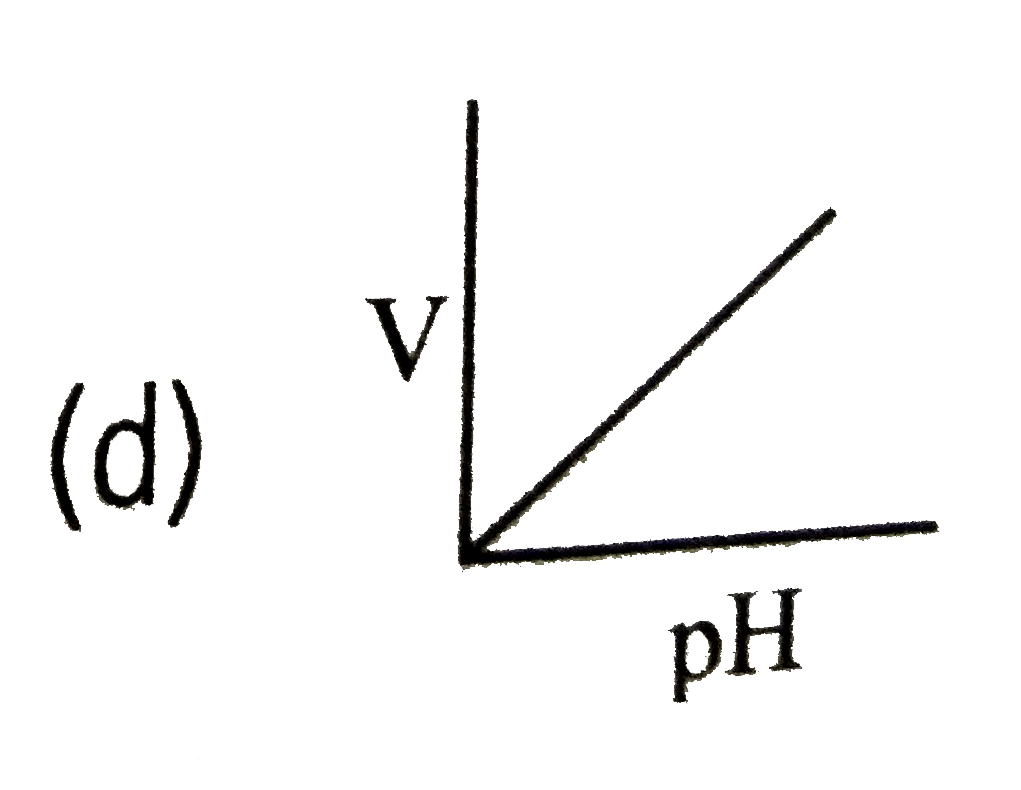
The correct Answer is:C
To determine which graph shows the effect of pH on the velocity of a typical enzymatic reaction, we can follow these steps:
1. Understand the Relationship: Enzymatic reactions are influenced by various factors, including pH. The velocity (V) of an enzymatic reaction typically varies with changes in pH.
2. Graph Axes: In the graph, the x-axis represents pH levels, while the y-axis represents the velocity (or rate) of the enzymatic reaction.
3. Identify the Shape of the Graph: The effect of pH on enzyme activity usually produces a bell-shaped curve. This means that:
- At low pH levels (acidic conditions), the enzyme activity is low.
- As pH increases, the enzyme activity rises until it reaches an optimum pH.
- Beyond this optimum pH, the enzyme activity decreases, leading to a decline in reaction velocity.
4. Optimum pH: The point at which the enzyme activity is at its maximum is known as the optimum pH. This is a critical feature of the graph.
5. Select the Correct Graph: Based on the typical bell-shaped curve described, you would look for a graph that shows:
- A rise in velocity as pH increases to a certain point (optimum pH).
- A decline in velocity as pH continues to increase beyond the optimum.
6. Conclusion: After analyzing the options provided, select the graph that matches the described characteristics. In this case, the correct option is option C, which depicts the expected bell-shaped curve illustrating the effect of pH on the velocity of an enzymatic reaction.
Final Answer:
The correct graph showing the effect of pH on the velocity of a typical enzymatic reaction is option C.
---
- At low pH levels (acidic conditions), the enzyme activity is low.
- As pH increases, the enzyme activity rises until it reaches an optimum pH.
- Beyond this optimum pH, the enzyme activity decreases, leading to a decline in reaction velocity.
- A rise in velocity as pH increases to a certain point (optimum pH).
- A decline in velocity as pH continues to increase beyond the optimum.
The correct graph showing the effect of pH on the velocity of a typical enzymatic reaction is option C.
Topper's Solved these Questions
- BIOMOLECULESBOOK - NCERT FINGERTPS ENGLISHCHAPTER - BIOMOLECULESEXERCISE - Biomolecules
137 Videos
- BIOLOGICAL CLASSIFICATIONBOOK - NCERT FINGERTPS ENGLISHCHAPTER - BIOLOGICAL CLASSIFICATIONEXERCISE - Biological Classification
132 Videos
- BODY FLUIDS AND CIRCULATIONBOOK - NCERT FINGERTPS ENGLISHCHAPTER - BODY FLUIDS AND CIRCULATIONEXERCISE - Body Fluids And Circulation
151 Videos
Similar Questions
Knowledge Check
Which of the following graphs shows the relationship between the rate of an enzymatic activity and substrate concentration (S) ?
A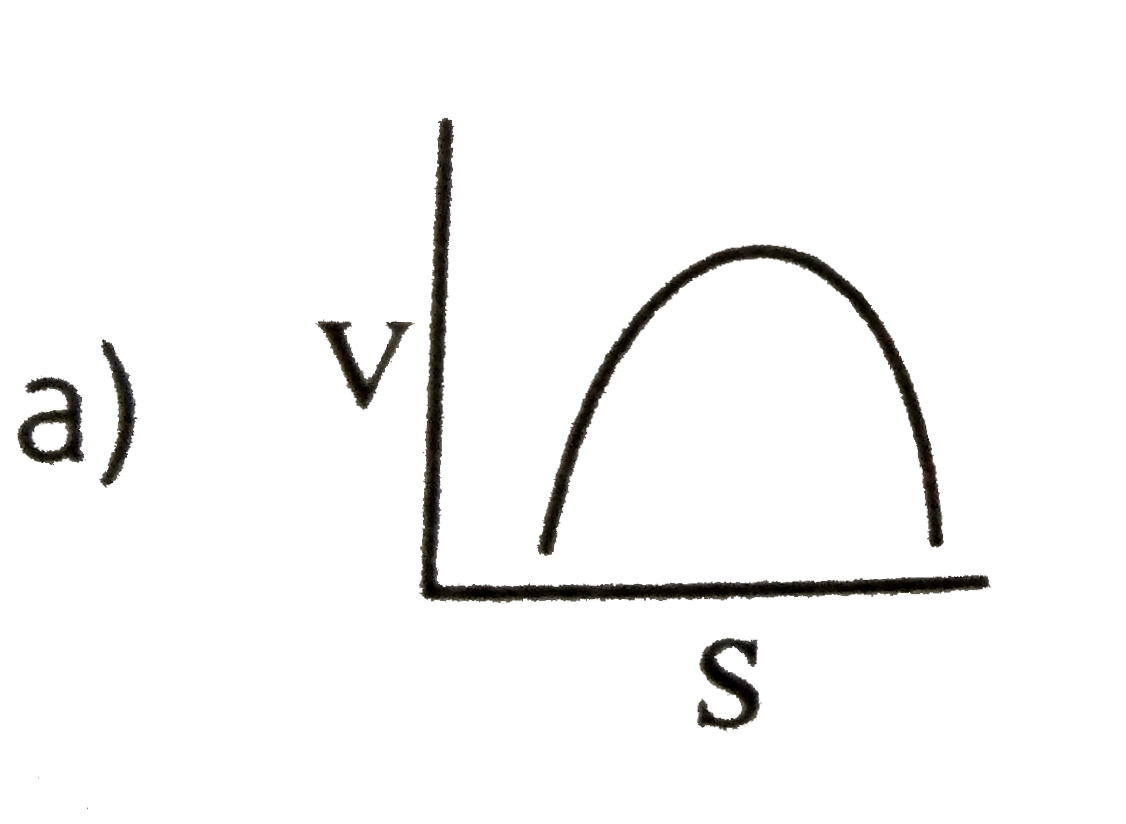 B
B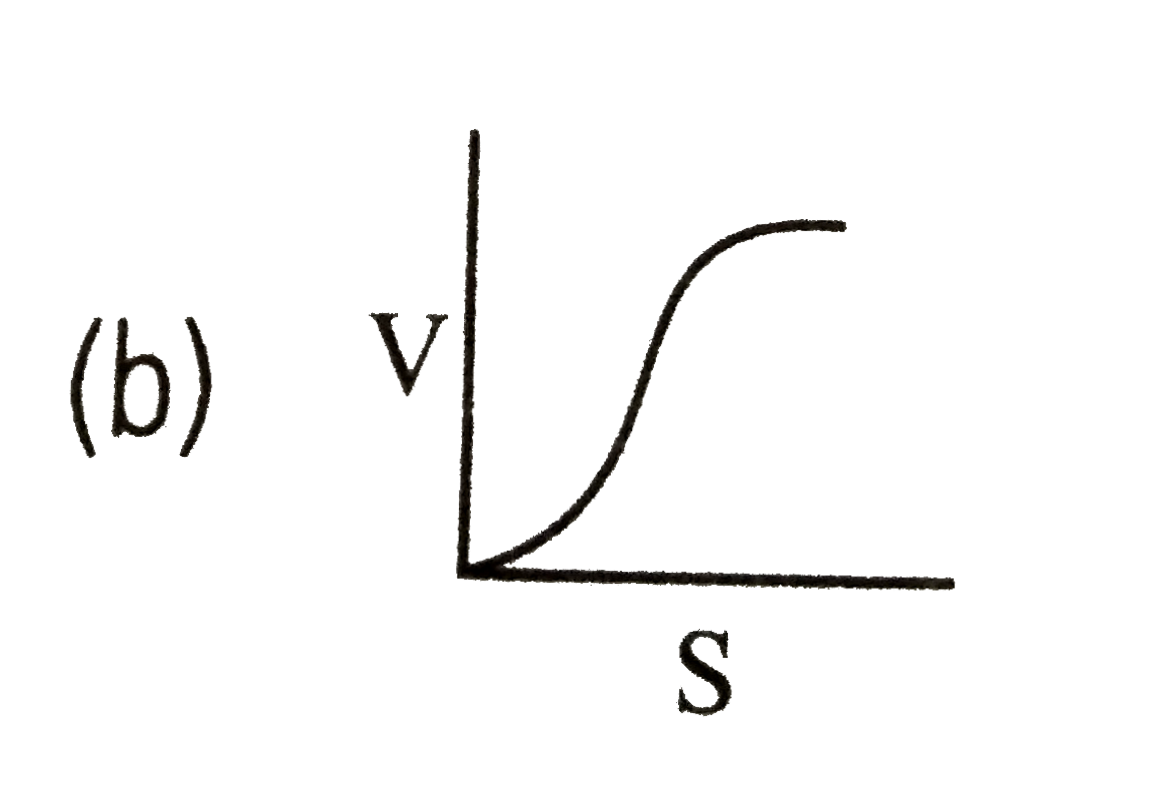 C
C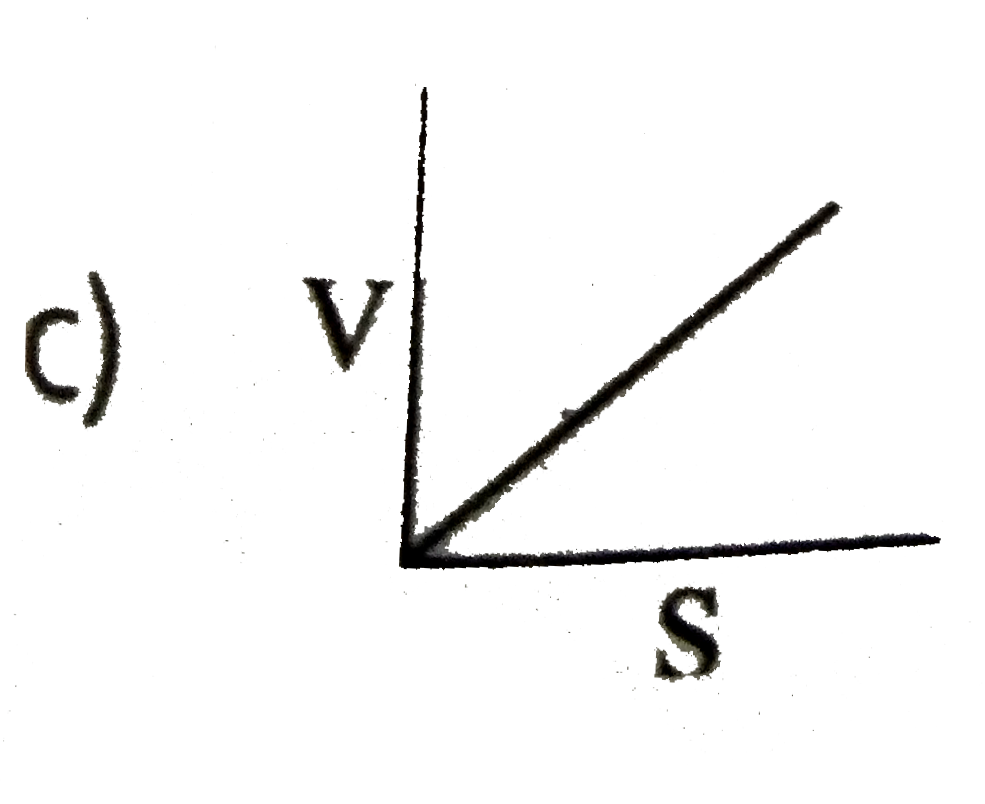 D
D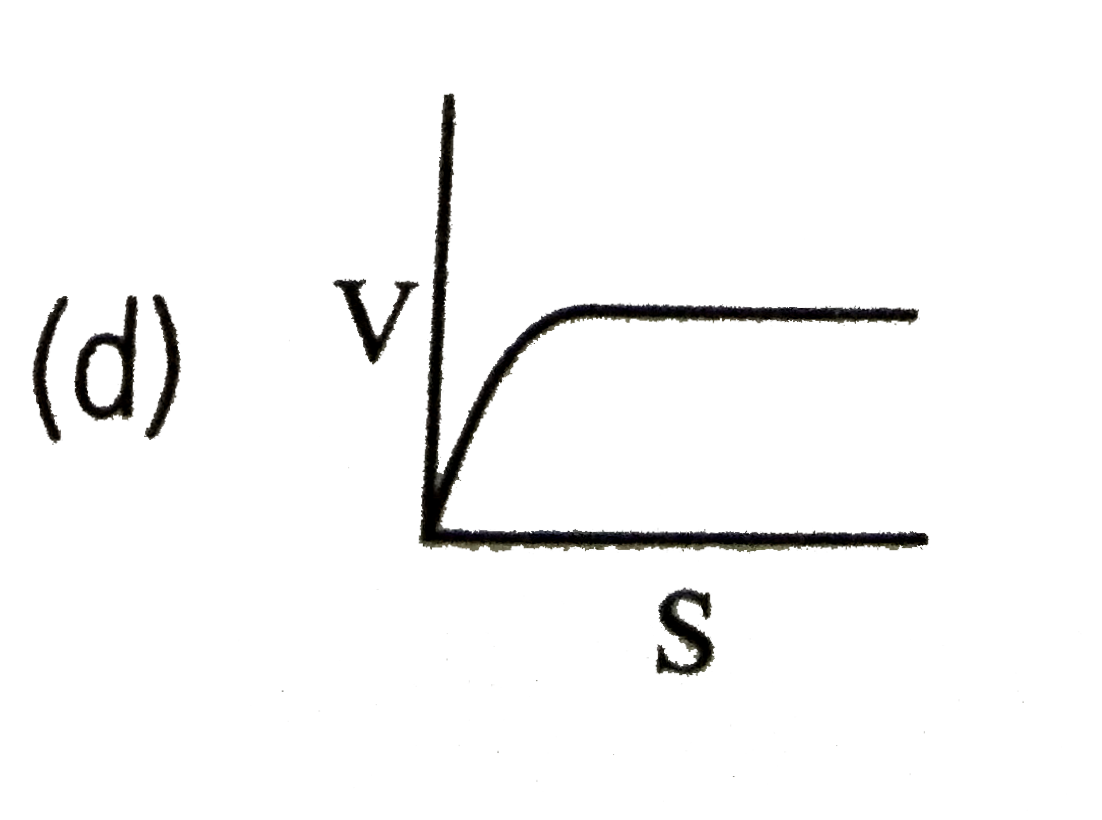
Which of the following will show Tyndall effect?
AAqueous solution of soap below critical micelle concentrationBAqueous solution of soap above critical micelle concentrationCAqueous solution of sodium chlorideDAqueous solution of sugar
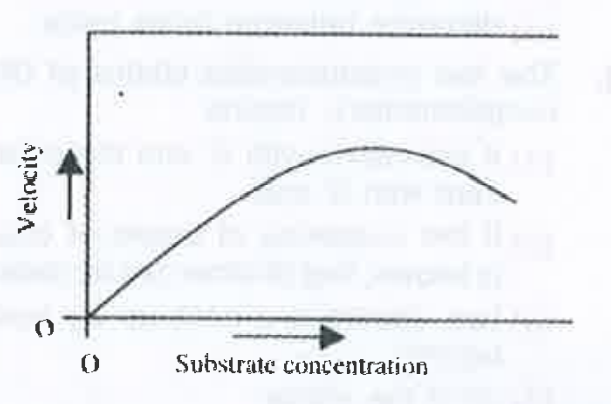
What does the graph indicate ?
The graph given below shows the effect of substrate concentration on the rate of reaction of the enzyme green- gram-phos-phatase.
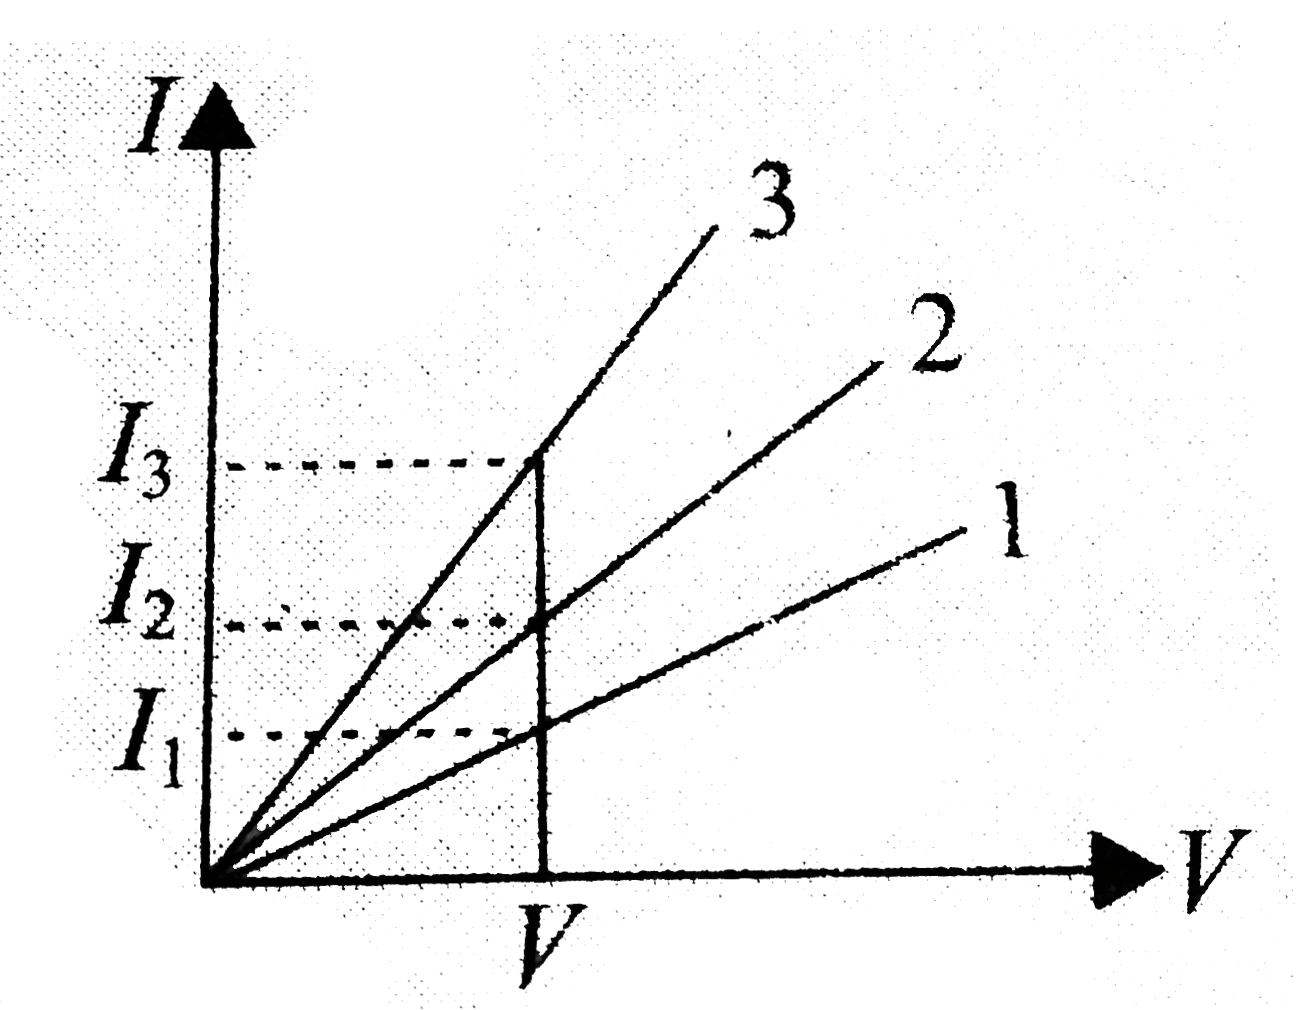
View SolutionWhich one of the following graphs in figure shows the variation of photoelectric current (I) with voltage (V) between the electrodes in a photoelectric cell?
View SolutionThe V - I graphs for two resistors and their series combination are shown in Fig 5.23. Which one of these graphs represents the series combination of the two resistors? Given reason for your answer.
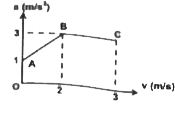
View SolutionA particle starts its motion from the origin in positive x-direction. The given graph shows the variation of acceleration (a) with velocity (v). Plot the corresponding graph between velocity and time.
View SolutionWhich of the following solution will have no effect on Ph on dilution ?
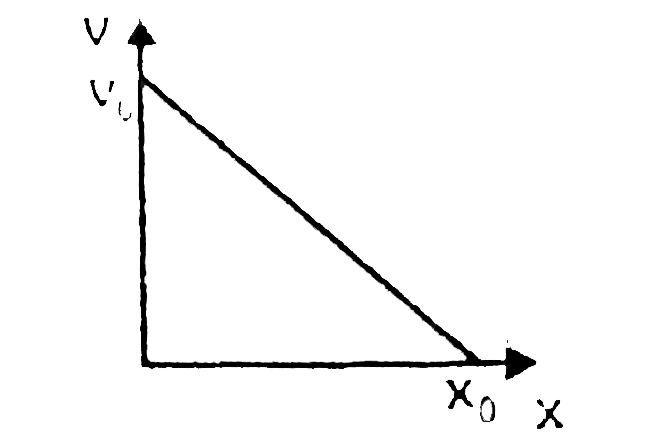
View SolutionThe given graph shows the variation of velocity with displacement. Which one of the graph given below correctly represents the variation of acceleration with displacement :-
View Solution