Which one of the given graphs shows the effect of temperature on the velocity of a typical enzymatic reaction ?
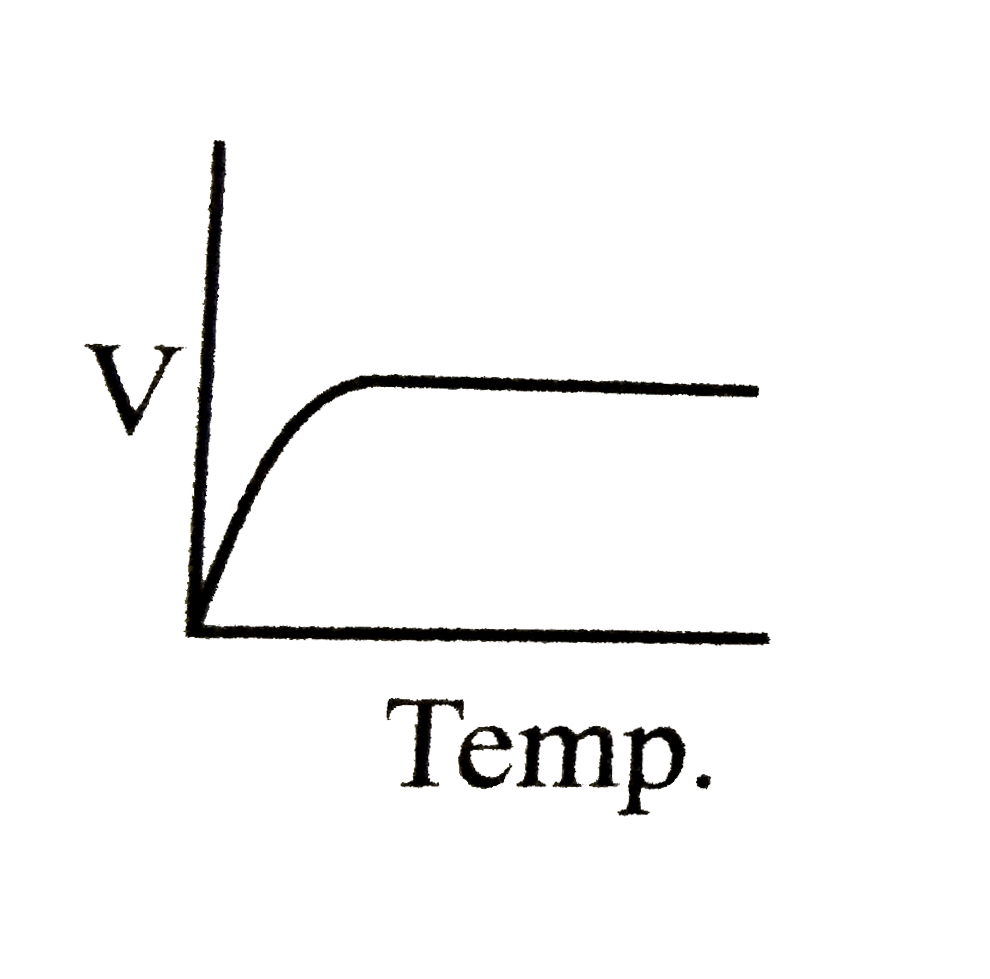
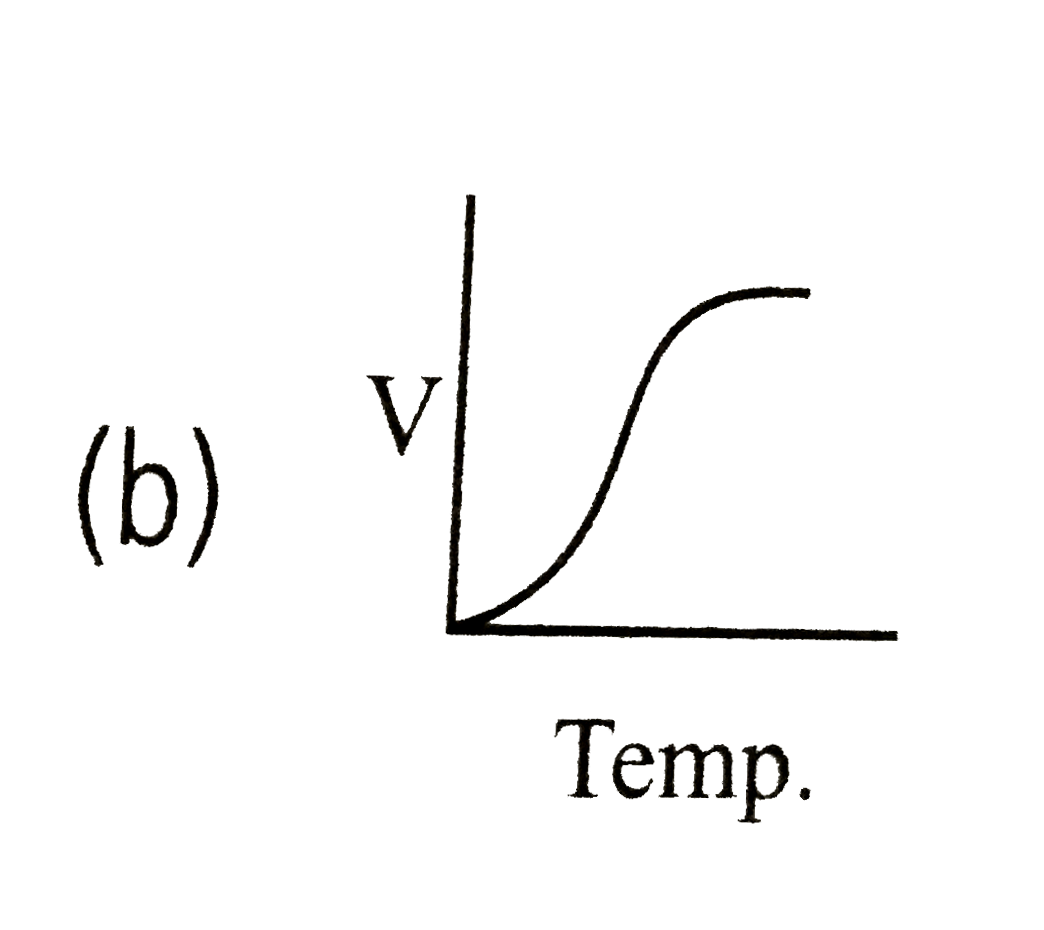
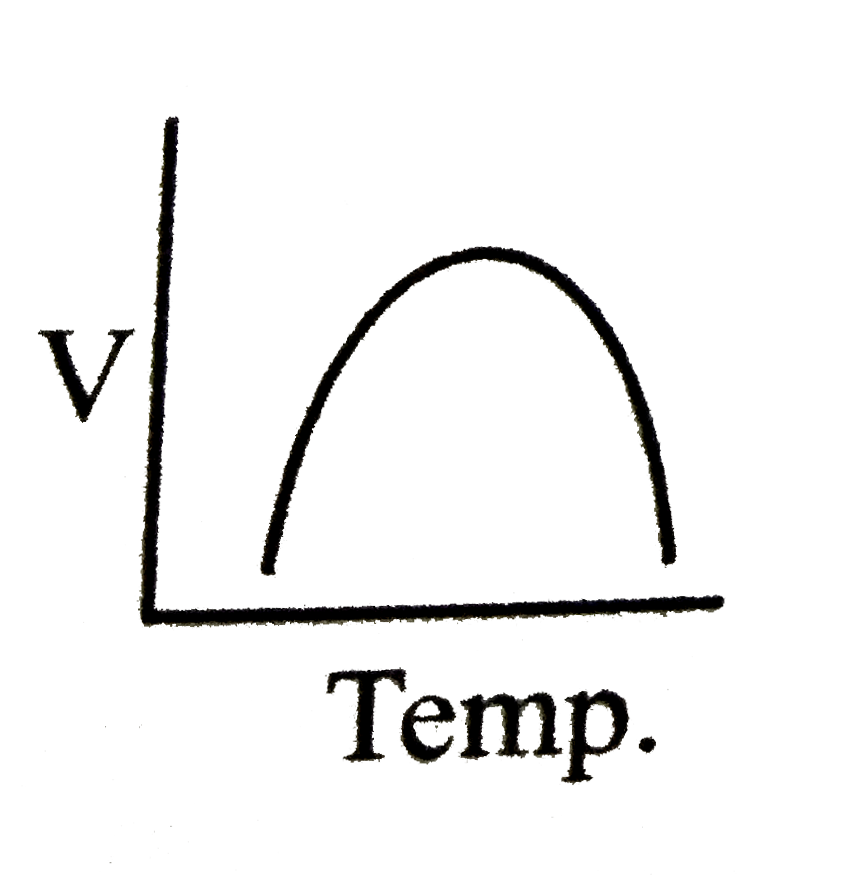
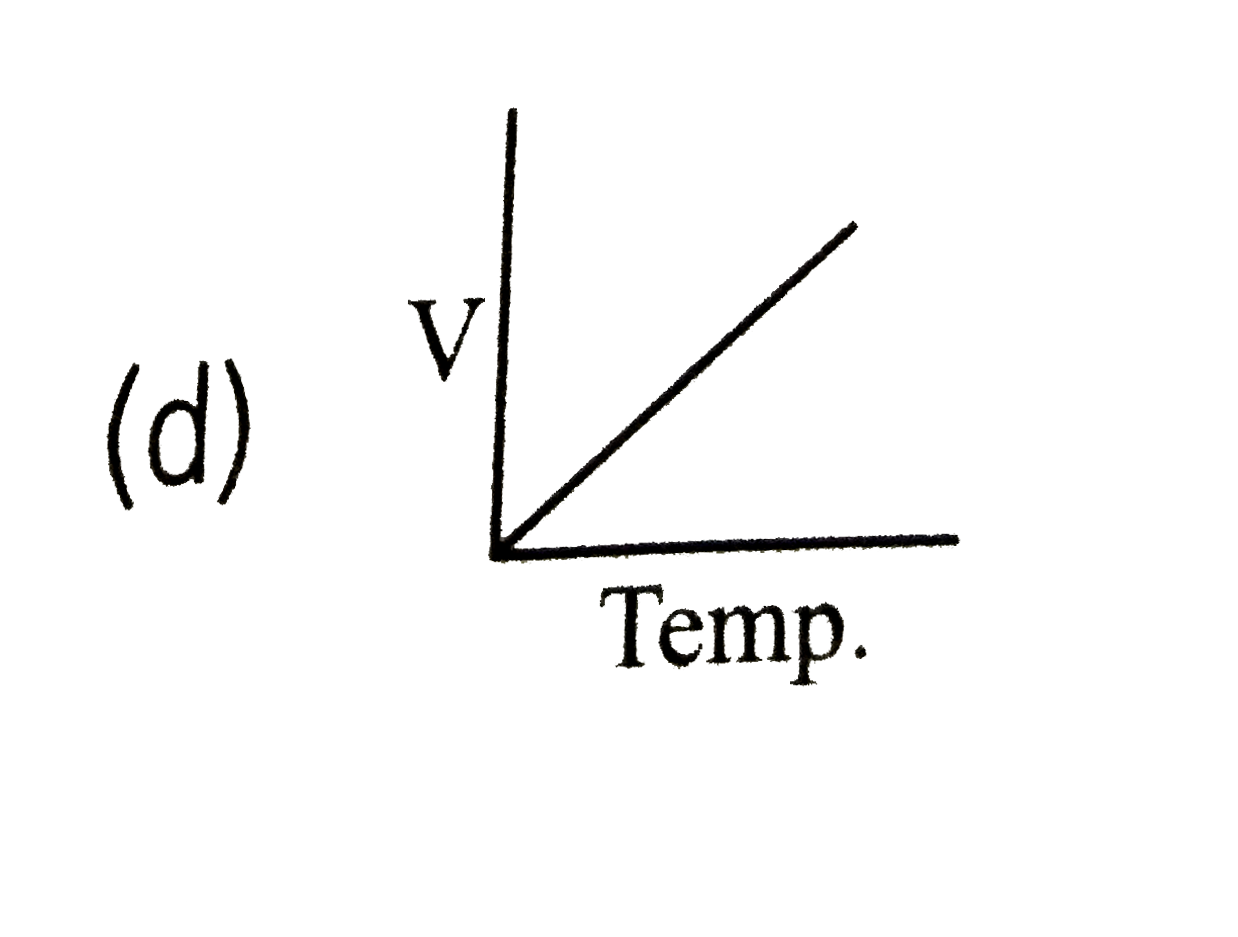
The correct Answer is:C
To determine which graph shows the effect of temperature on the velocity of a typical enzymatic reaction, we can follow these steps:
1. Understanding the Relationship:
- Enzymatic reactions are influenced by temperature. Generally, as temperature increases, the rate of reaction (or velocity) also increases, up to a certain point.
2. Graph Axes:
- On the x-axis, we will plot temperature, and on the y-axis, we will plot the rate of reaction (velocity).
3. Low Temperature Effect:
- At low temperatures, the rate of reaction is low because the enzyme activity is reduced. This means that the graph starts at a lower point on the y-axis.
4. Increasing Temperature:
- As we increase the temperature, the rate of reaction increases. This is due to the increased kinetic energy of molecules, which leads to more frequent collisions between enzymes and substrates.
5. Optimal Temperature:
- There is an optimal temperature range where the rate of reaction reaches its maximum. This peak represents the highest velocity of the enzymatic reaction.
6. High Temperature Effect:
- Beyond this optimal temperature, the rate of reaction begins to decrease. This is because high temperatures can denature enzymes, causing them to lose their functional shape and thus reducing their activity.
7. Final Graph Shape:
- The resulting graph will typically show a rise in the rate of reaction as temperature increases, reaching a peak at the optimal temperature, and then a decline as the temperature continues to rise.
8. Identifying the Correct Graph:
- Based on this understanding, we can identify that the correct graph will resemble a bell-shaped curve, starting low, peaking at an optimal temperature, and then declining.
Conclusion:
- The graph that best represents the effect of temperature on the velocity of a typical enzymatic reaction is Option C, which illustrates the described bell-shaped curve.
- Enzymatic reactions are influenced by temperature. Generally, as temperature increases, the rate of reaction (or velocity) also increases, up to a certain point.
- On the x-axis, we will plot temperature, and on the y-axis, we will plot the rate of reaction (velocity).
- At low temperatures, the rate of reaction is low because the enzyme activity is reduced. This means that the graph starts at a lower point on the y-axis.
- As we increase the temperature, the rate of reaction increases. This is due to the increased kinetic energy of molecules, which leads to more frequent collisions between enzymes and substrates.
- There is an optimal temperature range where the rate of reaction reaches its maximum. This peak represents the highest velocity of the enzymatic reaction.
- Beyond this optimal temperature, the rate of reaction begins to decrease. This is because high temperatures can denature enzymes, causing them to lose their functional shape and thus reducing their activity.
- The resulting graph will typically show a rise in the rate of reaction as temperature increases, reaching a peak at the optimal temperature, and then a decline as the temperature continues to rise.
- Based on this understanding, we can identify that the correct graph will resemble a bell-shaped curve, starting low, peaking at an optimal temperature, and then declining.
- The graph that best represents the effect of temperature on the velocity of a typical enzymatic reaction is Option C, which illustrates the described bell-shaped curve.
Topper's Solved these Questions
- BIOMOLECULESBook:NCERT FINGERTPS ENGLISHChapter:BIOMOLECULESExercise:Biomolecules
Explore 137 Videos
- BIOLOGICAL CLASSIFICATIONBook:NCERT FINGERTPS ENGLISHChapter:BIOLOGICAL CLASSIFICATIONExercise:Biological Classification
Explore 132 Videos
- BODY FLUIDS AND CIRCULATIONBook:NCERT FINGERTPS ENGLISHChapter:BODY FLUIDS AND CIRCULATIONExercise:Body Fluids And Circulation
Explore 151 Videos
Similar Questions
Knowledge Check
Which of the following graphs shows the relationship between the rate of an enzymatic activity and substrate concentration (S) ?
A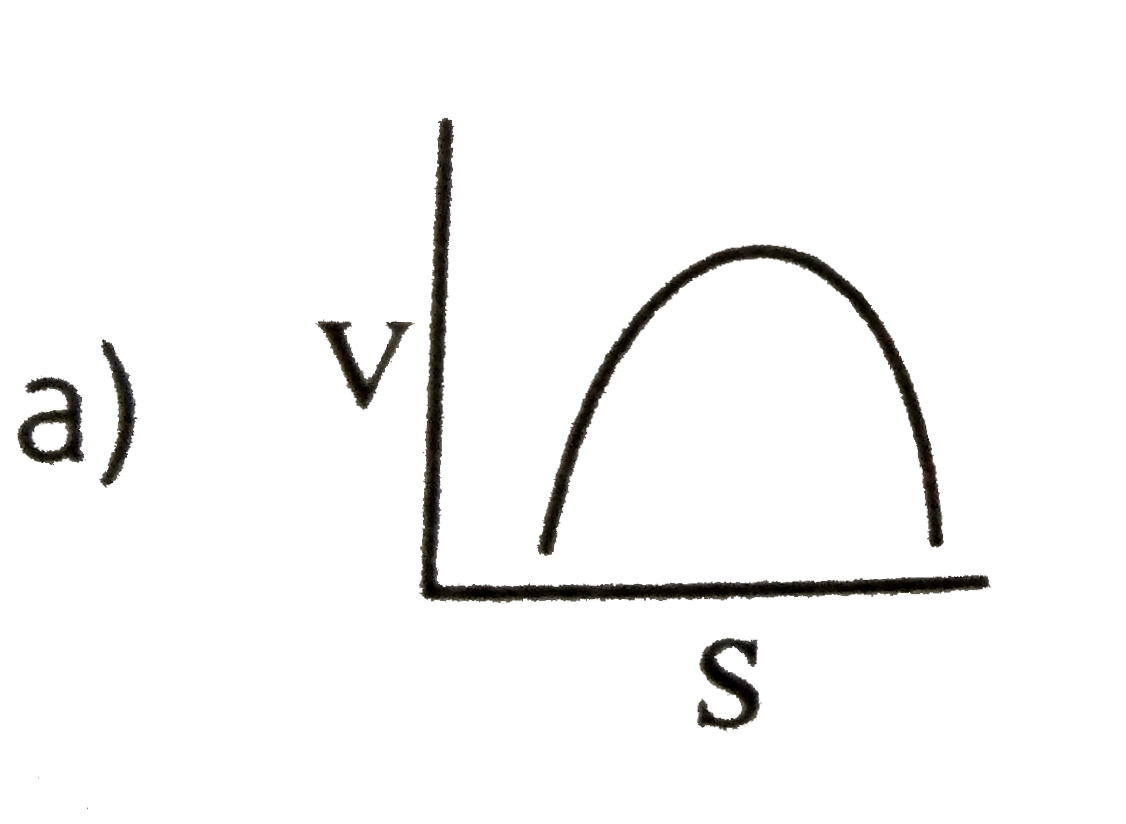 B
B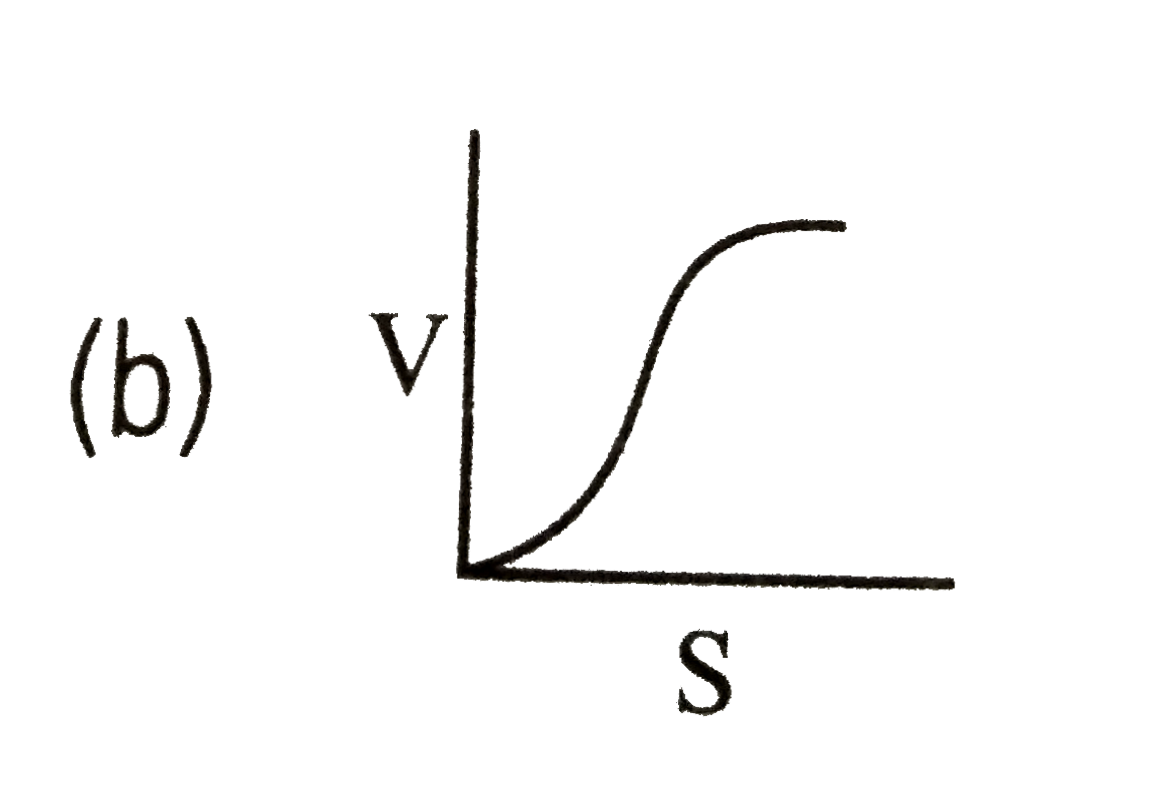 C
C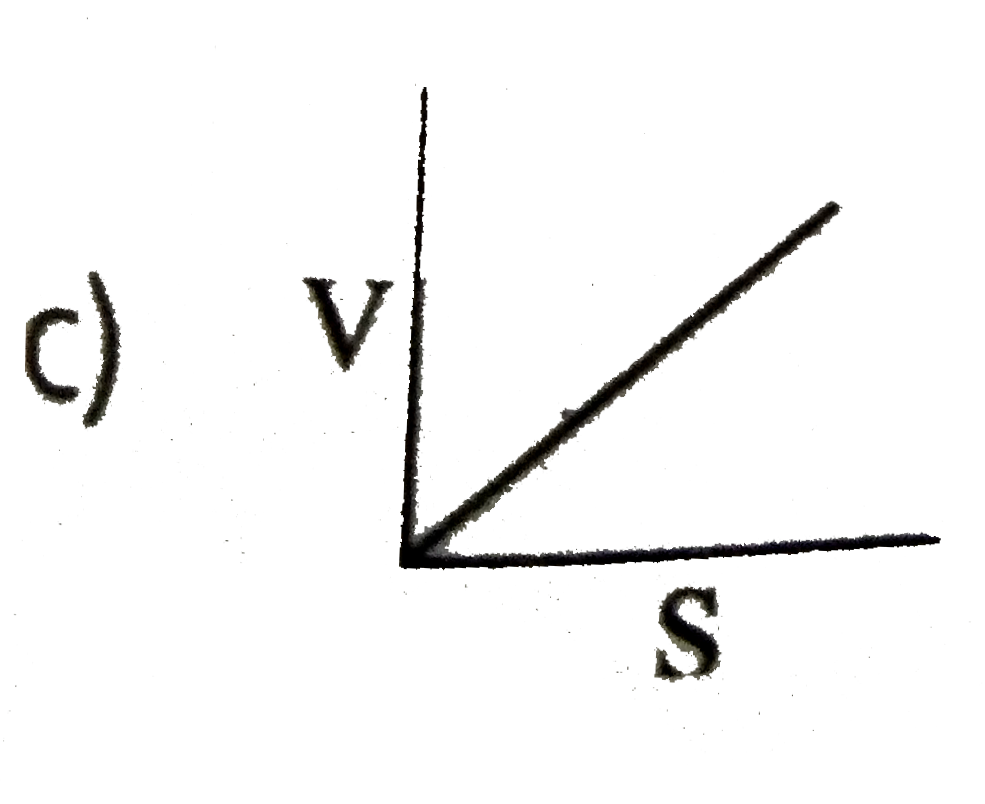 D
D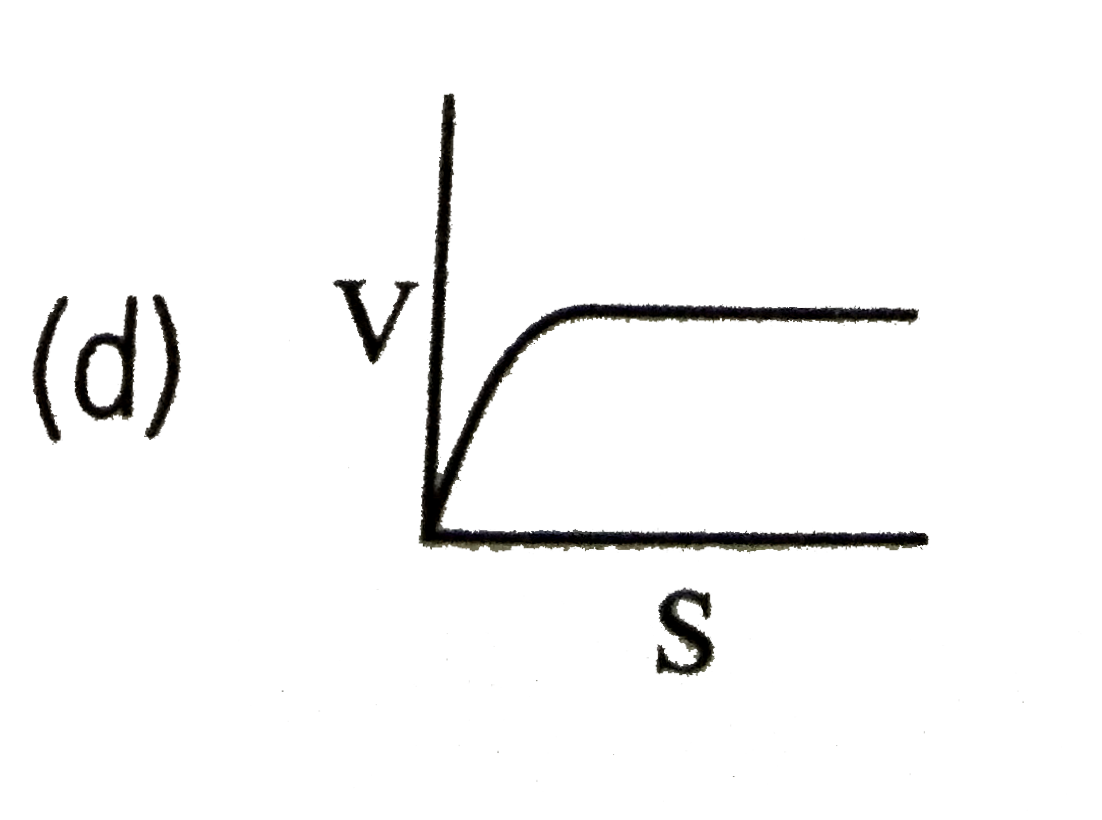
Show graphically the effect of temperature on the density of water.
View SolutionThe effect of temperature on the rate constant of a reaction is given by
View SolutionDiscuss the Maxwell's distribution of velocities in a gas. What is the effect of temperature on this distribution ?
View SolutionWhich graphs shows the correct description of effect of pH on the enzymatic activity
View SolutionOut of the given values of temperature, which one is the highest?
View SolutionThe Arrhenius equation expressing the effect of temperature on the rate constant of a reaction is given as
View SolutionWhat does the graph indicate ?
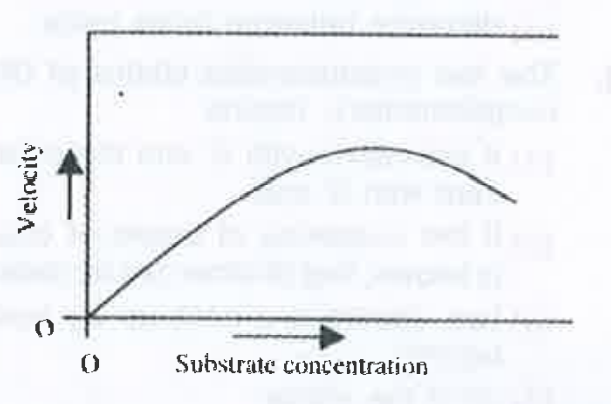
The graph given below shows the effect of substrate concentration on the rate of reaction of the enzyme green- gram-phos-phatase.
View Solution