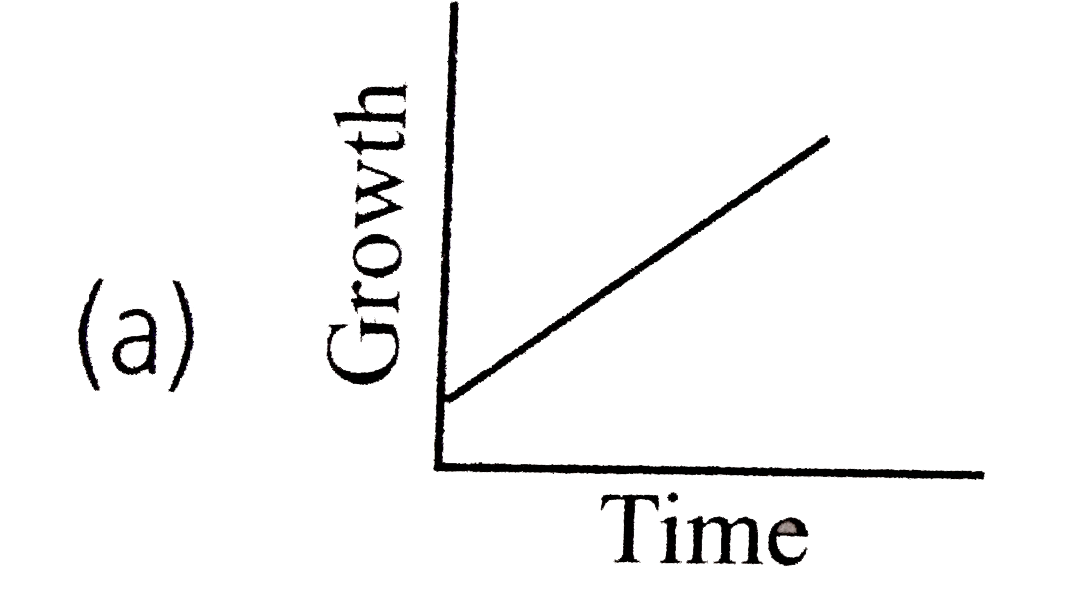
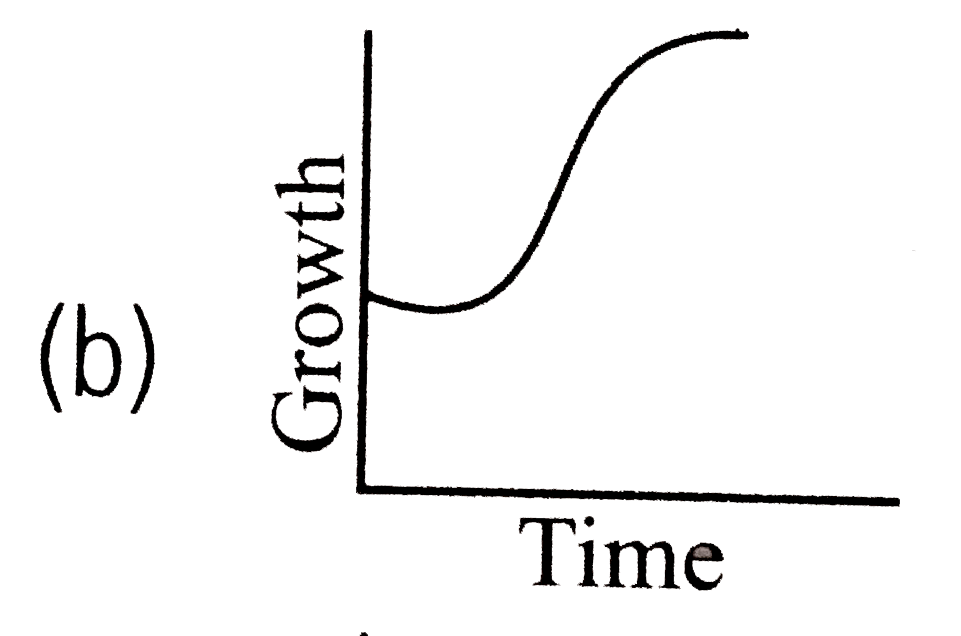
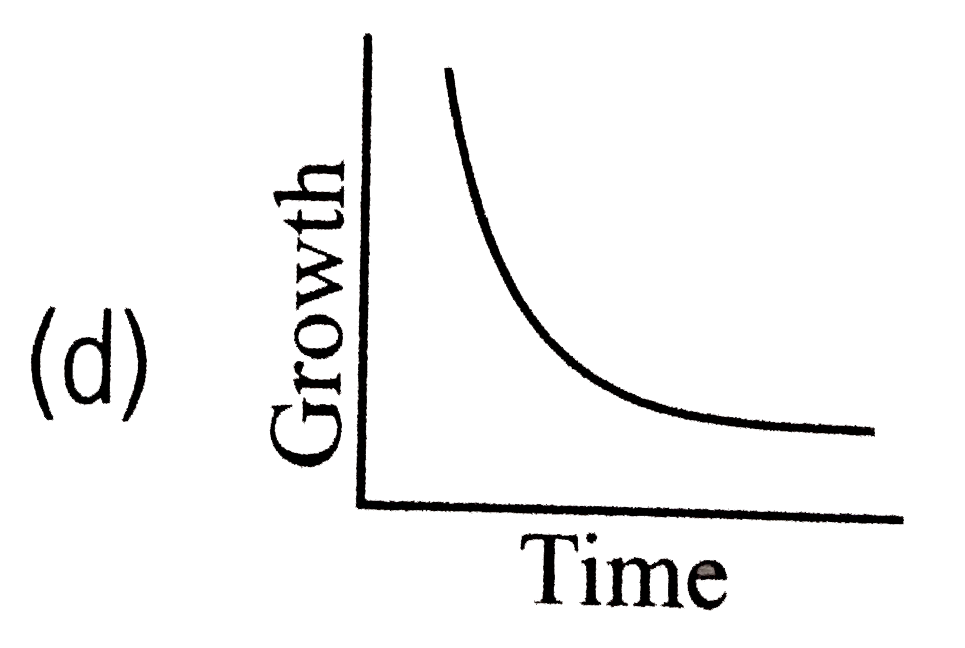
Which one is the correct graph for arithmetic growth?

The correct Answer is:A
To determine the correct graph for arithmetic growth, we need to follow these steps:
1. Understand Arithmetic Growth:
- Arithmetic growth occurs when a fixed amount is added to the initial quantity at regular intervals. In the context of plant growth, this means that a cell divides and produces a constant number of new cells over time.
2. Identify the Characteristics of Arithmetic Growth:
- In arithmetic growth, the increase in size or number is linear. This means that as time progresses, the growth occurs at a constant rate.
3. Mathematical Representation:
- The growth can be expressed mathematically as:
L(t)=L0+rt
where:
- L(t) is the length at time t,
- L0 is the original length,
- r is the rate of growth,
- t is the time.
4. Graphical Representation:
- In a graph representing arithmetic growth, the x-axis typically represents time, while the y-axis represents growth (length, number of cells, etc.).
- The graph should show a straight line that slopes upwards, indicating a constant increase over time.
5. Select the Correct Graph:
- Among the options provided, identify the graph that depicts a straight line with a constant slope. This is the graph that represents arithmetic growth.
Conclusion:
The correct graph for arithmetic growth is the one that shows a straight line with a constant slope, indicating a linear increase over time.
---
- Arithmetic growth occurs when a fixed amount is added to the initial quantity at regular intervals. In the context of plant growth, this means that a cell divides and produces a constant number of new cells over time.
- In arithmetic growth, the increase in size or number is linear. This means that as time progresses, the growth occurs at a constant rate.
- The growth can be expressed mathematically as:
L(t)=L0+rt
where:
- L(t) is the length at time t,
- L0 is the original length,
- r is the rate of growth,
- t is the time.
- In a graph representing arithmetic growth, the x-axis typically represents time, while the y-axis represents growth (length, number of cells, etc.).
- The graph should show a straight line that slopes upwards, indicating a constant increase over time.
- Among the options provided, identify the graph that depicts a straight line with a constant slope. This is the graph that represents arithmetic growth.
The correct graph for arithmetic growth is the one that shows a straight line with a constant slope, indicating a linear increase over time.
Topper's Solved these Questions
- BOOK - NCERT FINGERTPS ENGLISHCHAPTER - PLANT GROWTH AND DEVELOPMENTEXERCISE - Plant growth regulators70videos
PLANT GROWTH AND DEVELOPMENT
- BOOK - NCERT FINGERTPS ENGLISHCHAPTER - PLANT GROWTH AND DEVELOPMENTEXERCISE - Photoperiosim8videos
PLANT GROWTH AND DEVELOPMENT
- BOOK - NCERT FINGERTPS ENGLISHCHAPTER - PHOTOSYNTHESIS IN HIGHER PLANTSEXERCISE - Photosynthesis In Higher Plants136videos
PHOTOSYNTHESIS IN HIGHER PLANTS
- BOOK - NCERT FINGERTPS ENGLISHCHAPTER - PLANT KINGDOMEXERCISE - Plant Kingdom160videos
PLANT KINGDOM
Similar Questions
Knowledge Check
- Question 1 - Select One
Read the following statements regarding arithmetic growth and select the correct answer.
(i) Rate of growth is constant.
(ii) One daughter cell remains meristematic while the other one differentiates and matures.
(iii) Mathematical expression is Lt=L0+rt.Astatements (i) and (ii) are correct.Bstatements (ii) and (iii) are correctCstatements (i) and (iii) are correctDAll statements are correct - Question 2 - Select One
Which of the following represents the correct graph for SN2 reaction ?
A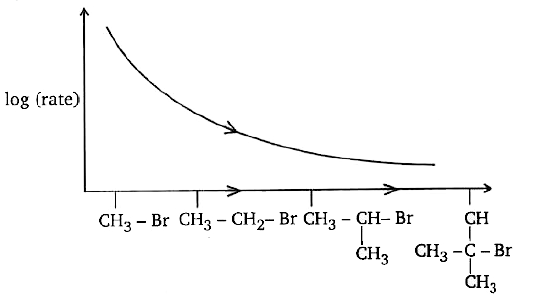 B
B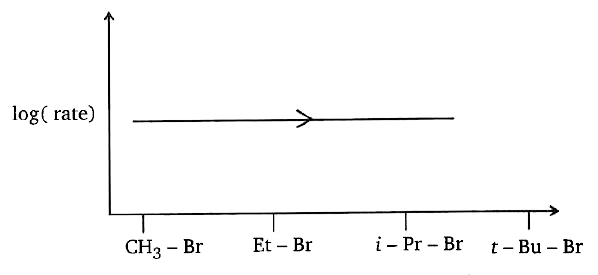 C
C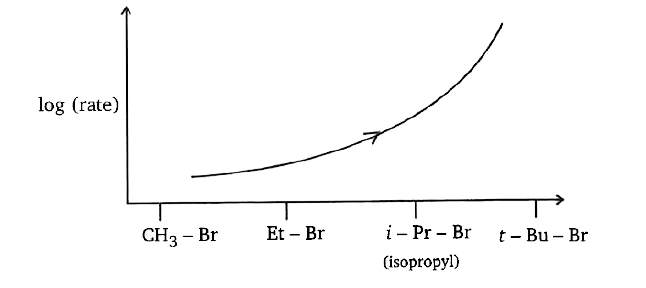 D
D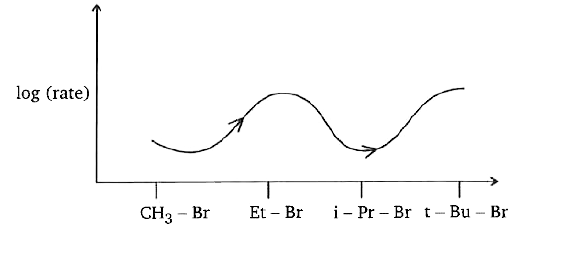
Write the expression for arithmetic growth.
View SolutionMark the correct statement/s about arithmetic growth.
View SolutionWhich of the following is correct graph for the reaction?
 View Solution
Which of the following is the correct graph for EN values of carbon family :
View SolutionWhich one is not a growth promoter ?
View SolutionFor an endothermic the correct graph is
View Solution

