Which is/are correct graph ?
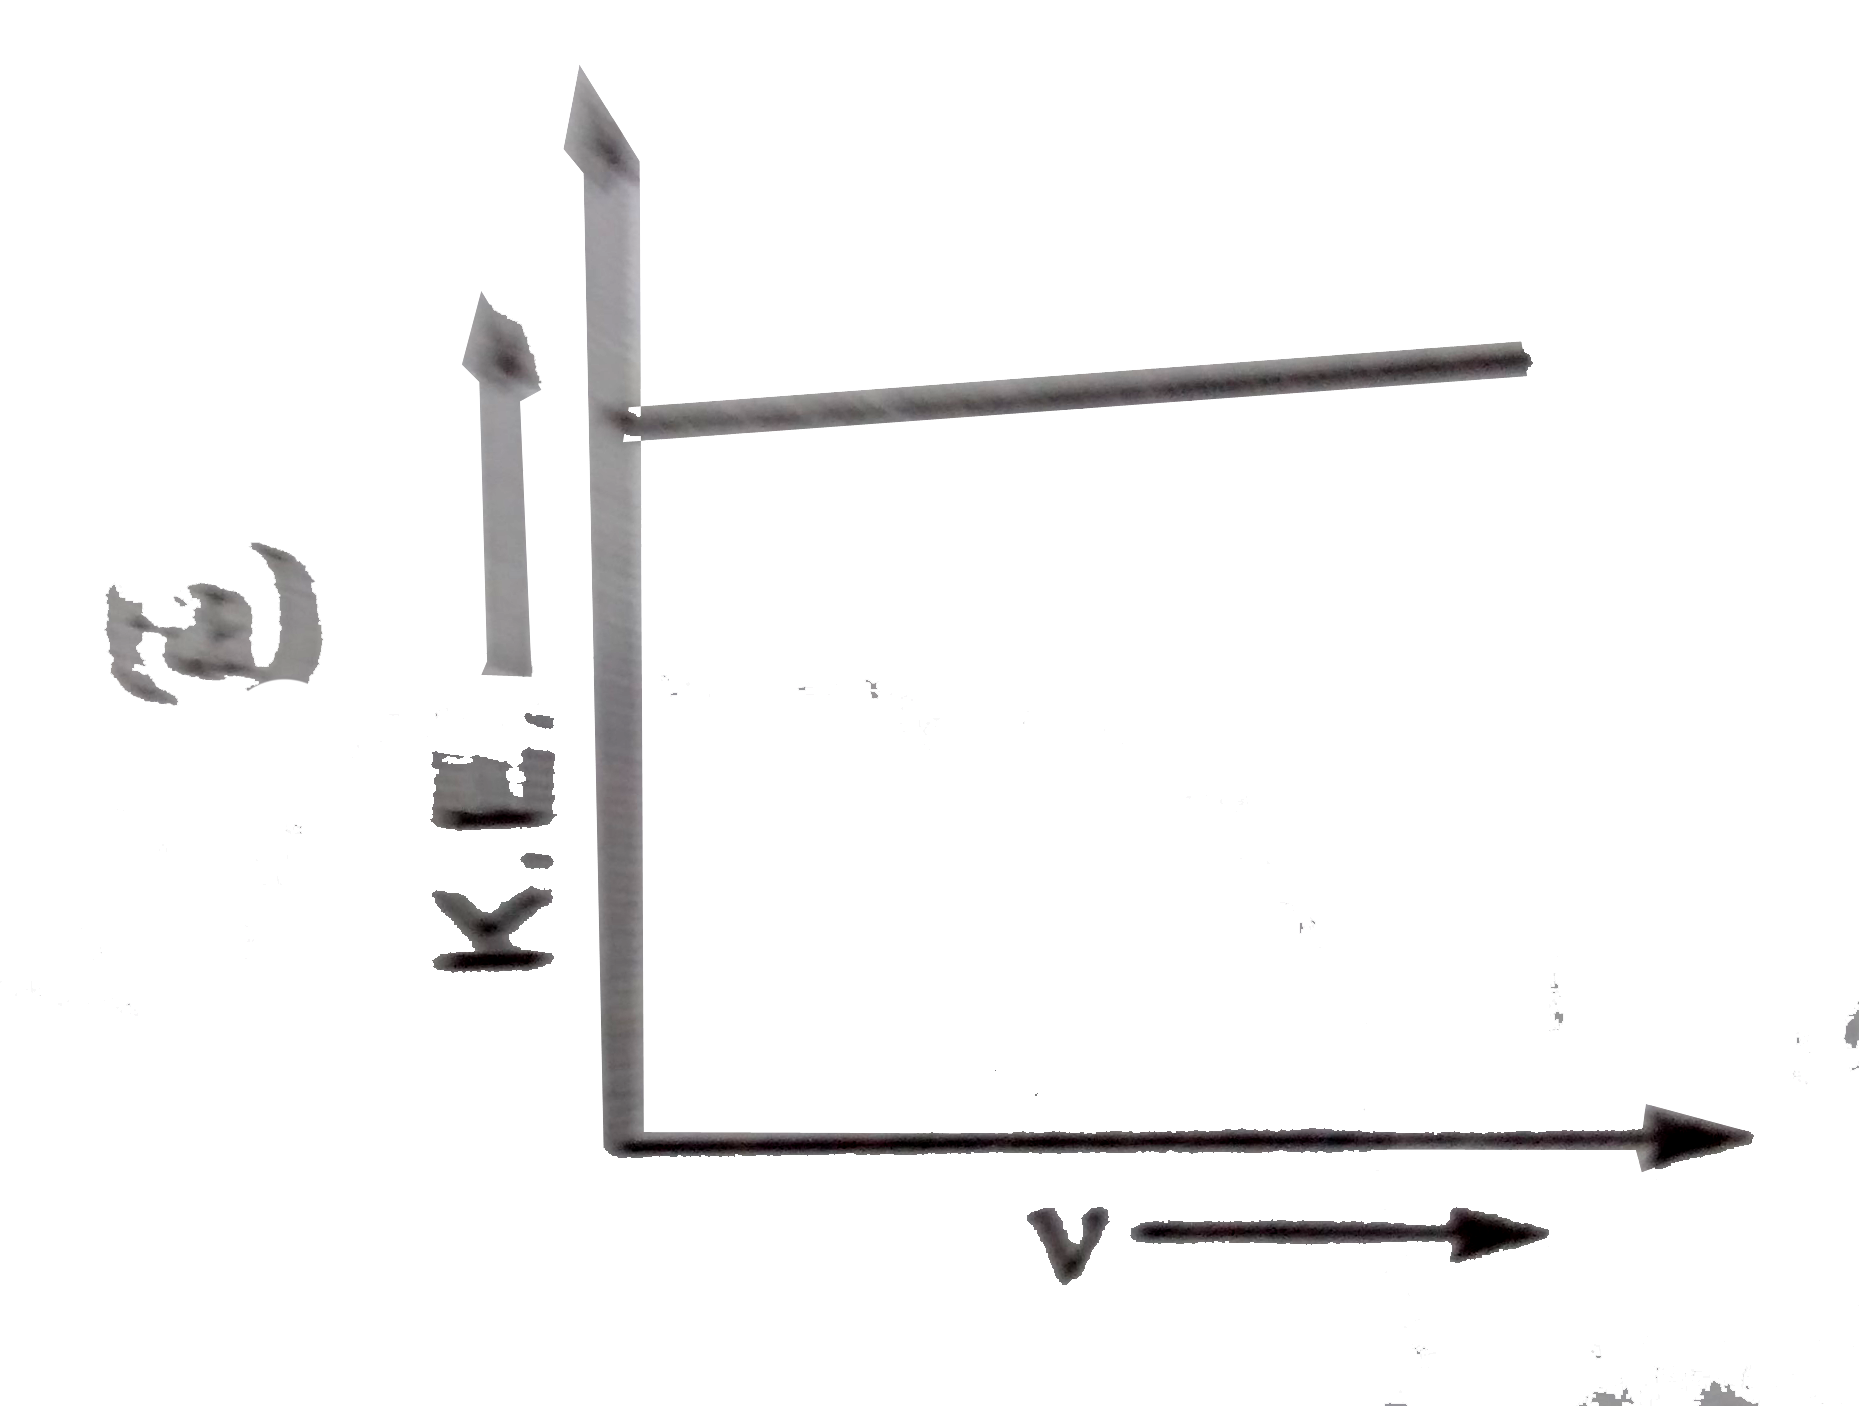


The correct Answer is:A,B,C,D
To determine which graph(s) are correct based on the relationship between kinetic energy and frequency, we can follow these steps:
Step 1: Understand the Relationship
The kinetic energy (KE) of a photoelectron is given by the equation:
KE=hν−ϕ
where:
- KE is the kinetic energy,
- h is Planck's constant,
- ν (mu) is the frequency of the incident light,
- ϕ (phi) is the work function of the material.
Step 2: Rearrange the Equation
We can rearrange the equation to express kinetic energy in terms of frequency:
KE=hν−hν0
where ν0 is the threshold frequency (the frequency corresponding to the work function).
Step 3: Identify the Graph Characteristics
From the rearranged equation, we can see that:
- The equation is linear in the form y=mx+c, where:
- y is the kinetic energy,
- x is the frequency,
- m (the slope) is equal to h (which is positive),
- c is the y-intercept (which is negative since it represents the work function).
Step 4: Analyze the Graphs
Since the slope m is positive, the graph of kinetic energy versus frequency will be a straight line that rises as frequency increases. The line will intersect the y-axis at a negative value, indicating that kinetic energy is zero when the frequency is equal to the threshold frequency ν0.
Step 5: Conclusion
All graphs that show a straight line with a positive slope and a negative y-intercept are correct representations of the kinetic energy as a function of frequency. Therefore, if all provided graphs exhibit these characteristics, they are all correct.
Final Answer
All the graphs with a positive slope and a negative y-intercept are correct.
---
The kinetic energy (KE) of a photoelectron is given by the equation:
KE=hν−ϕ
where:
- KE is the kinetic energy,
- h is Planck's constant,
- ν (mu) is the frequency of the incident light,
- ϕ (phi) is the work function of the material.
We can rearrange the equation to express kinetic energy in terms of frequency:
KE=hν−hν0
where ν0 is the threshold frequency (the frequency corresponding to the work function).
From the rearranged equation, we can see that:
- The equation is linear in the form y=mx+c, where:
- y is the kinetic energy,
- x is the frequency,
- m (the slope) is equal to h (which is positive),
- c is the y-intercept (which is negative since it represents the work function).
Since the slope m is positive, the graph of kinetic energy versus frequency will be a straight line that rises as frequency increases. The line will intersect the y-axis at a negative value, indicating that kinetic energy is zero when the frequency is equal to the threshold frequency ν0.
All graphs that show a straight line with a positive slope and a negative y-intercept are correct representations of the kinetic energy as a function of frequency. Therefore, if all provided graphs exhibit these characteristics, they are all correct.
All the graphs with a positive slope and a negative y-intercept are correct.
Similar Questions
Which is correct graph :
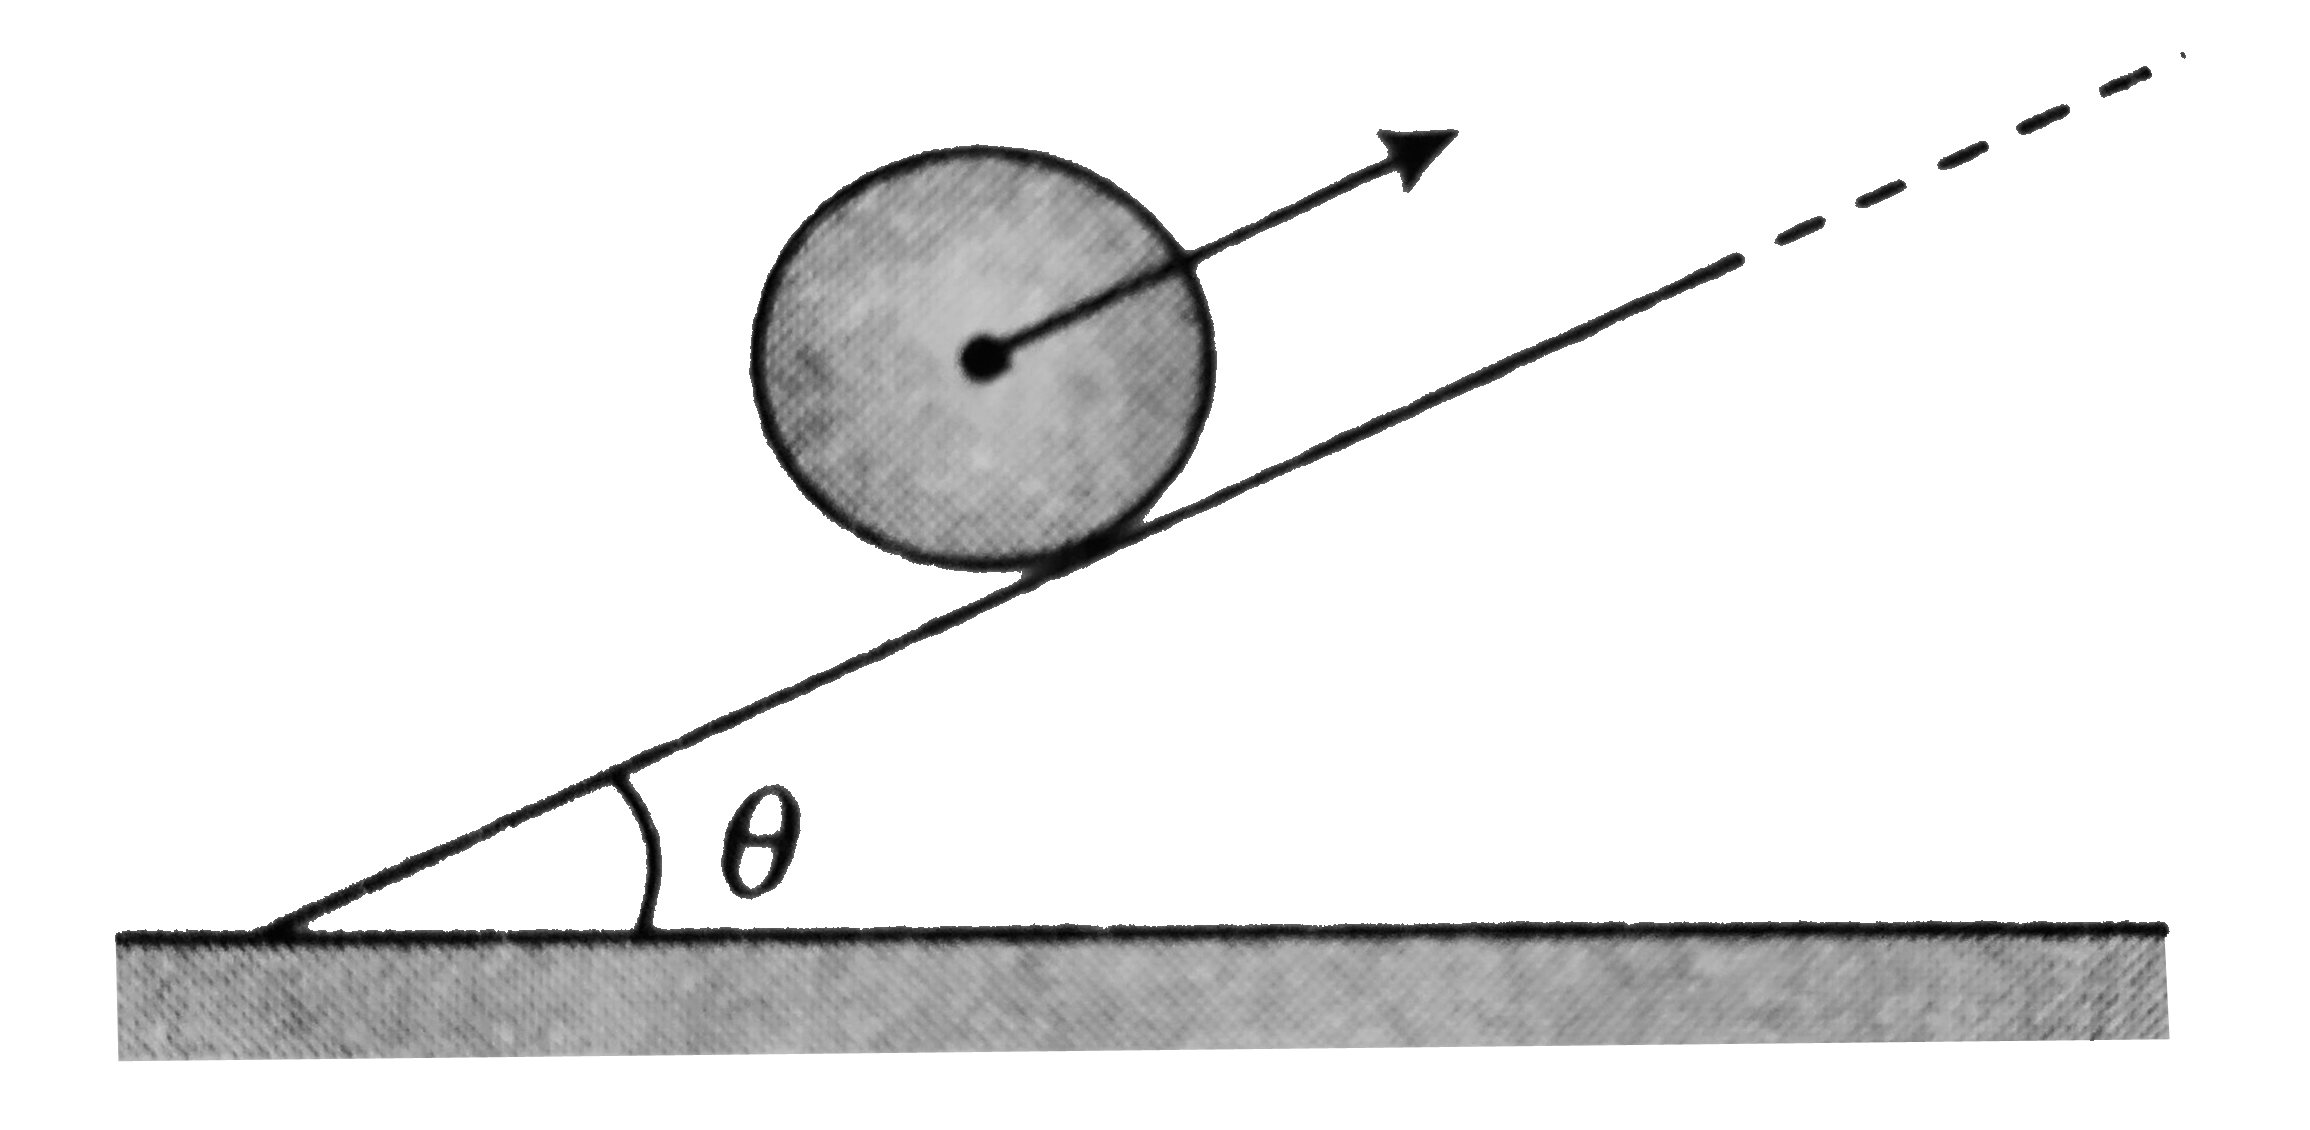
View SolutionA uniform solid sphere rolls up (witout slipping) the fixed inclined plane, and then back down. Which is the correct graph of acceleration a of centre of mass of solid sphere as function of time t (for the duration sphere is on the incline)? Assume that the sphere rolling up has a positive velocity.
View SolutionWhich one is the correct graph for arithmetic growth?
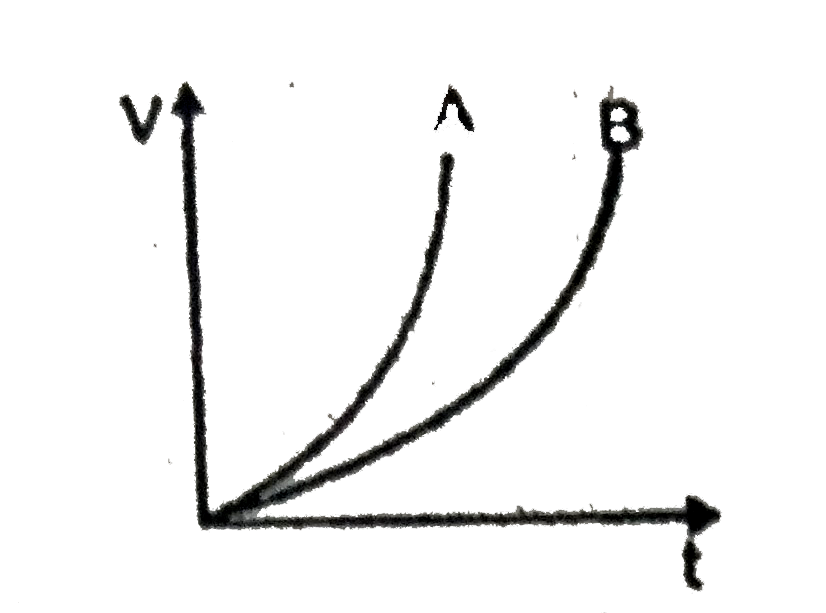
View SolutionA velocity-time graph of two vehicals A & B starting from rest at the same time is given in the figure. The statements which is correct from graph.
View SolutionWhich of the following is the correct graph for EN values of carbon family :
View SolutionWhich of the following is correct graph for the reaction?

View Solutionif current in solenoid is i1=αteβt. Which of the followign is correct graph between induced current rod time (α and β are positive)
View SolutionA boy is sitting on a seat of merry-go-round moving with a constant angular velocity. A t=0, the boy is at position A as shown in the figure
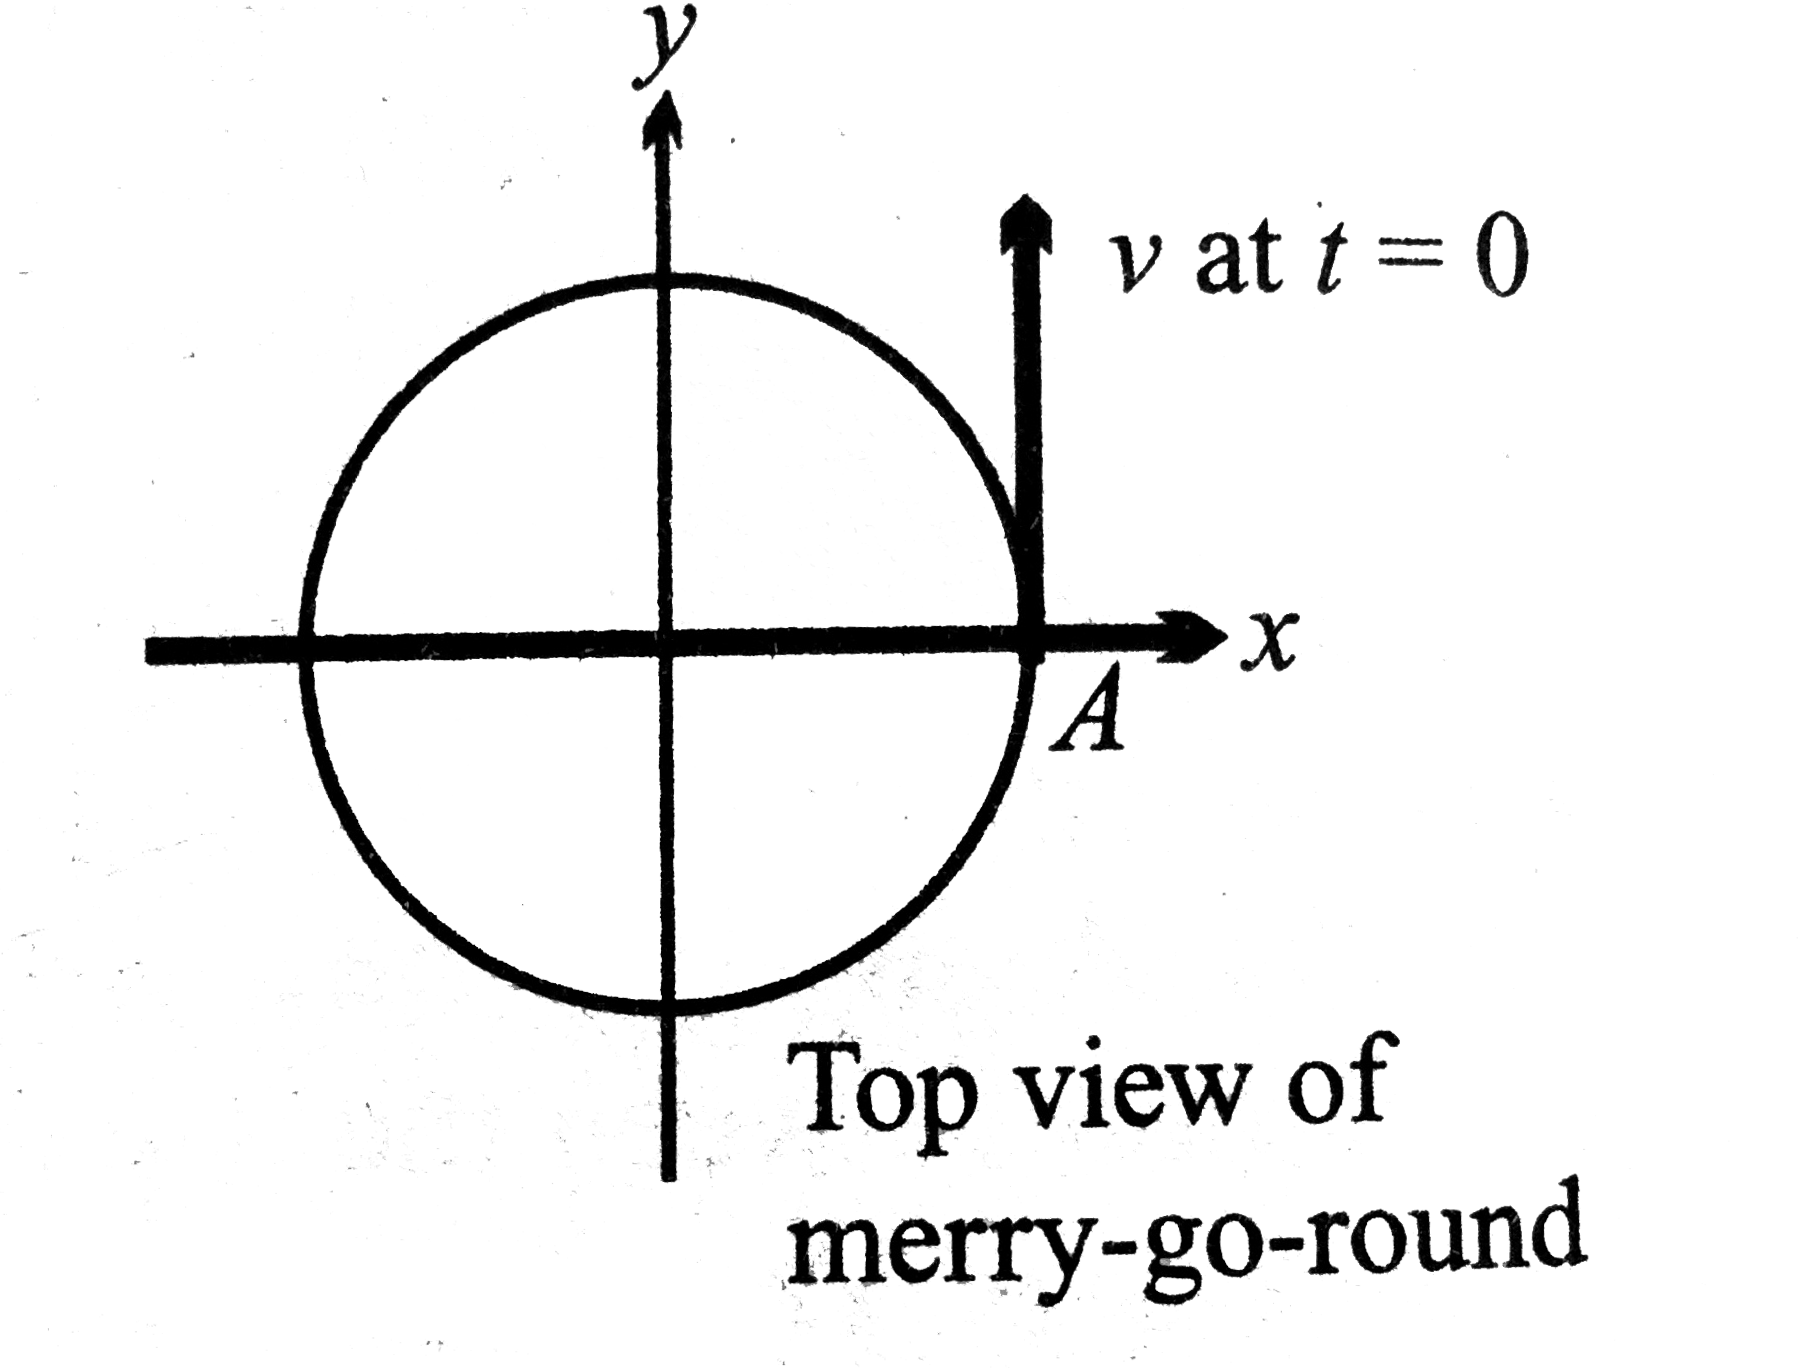
Which of the following graphs are correct? All graphs are sinusoidal.
View SolutionFor an endothermic the correct graph is
View SolutionCompressibility factor (Z=PVnRT) is plotted against pressure
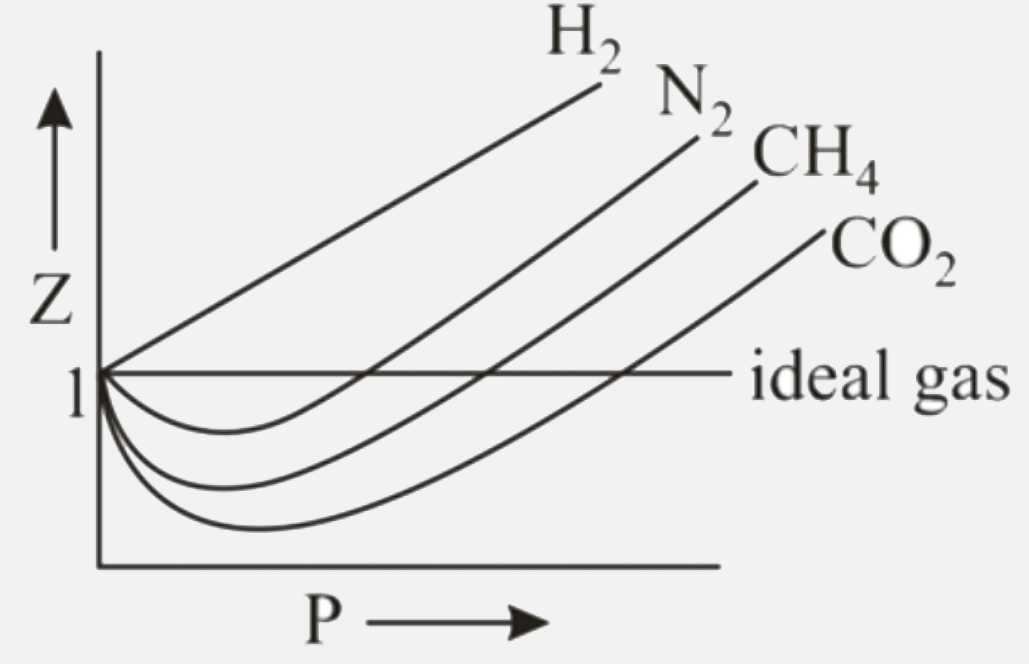
Which is the correct order of liquefiability of the gases shown in the above graph ?
View Solution
