Which of the following is the correct graph for EN values of carbon family :
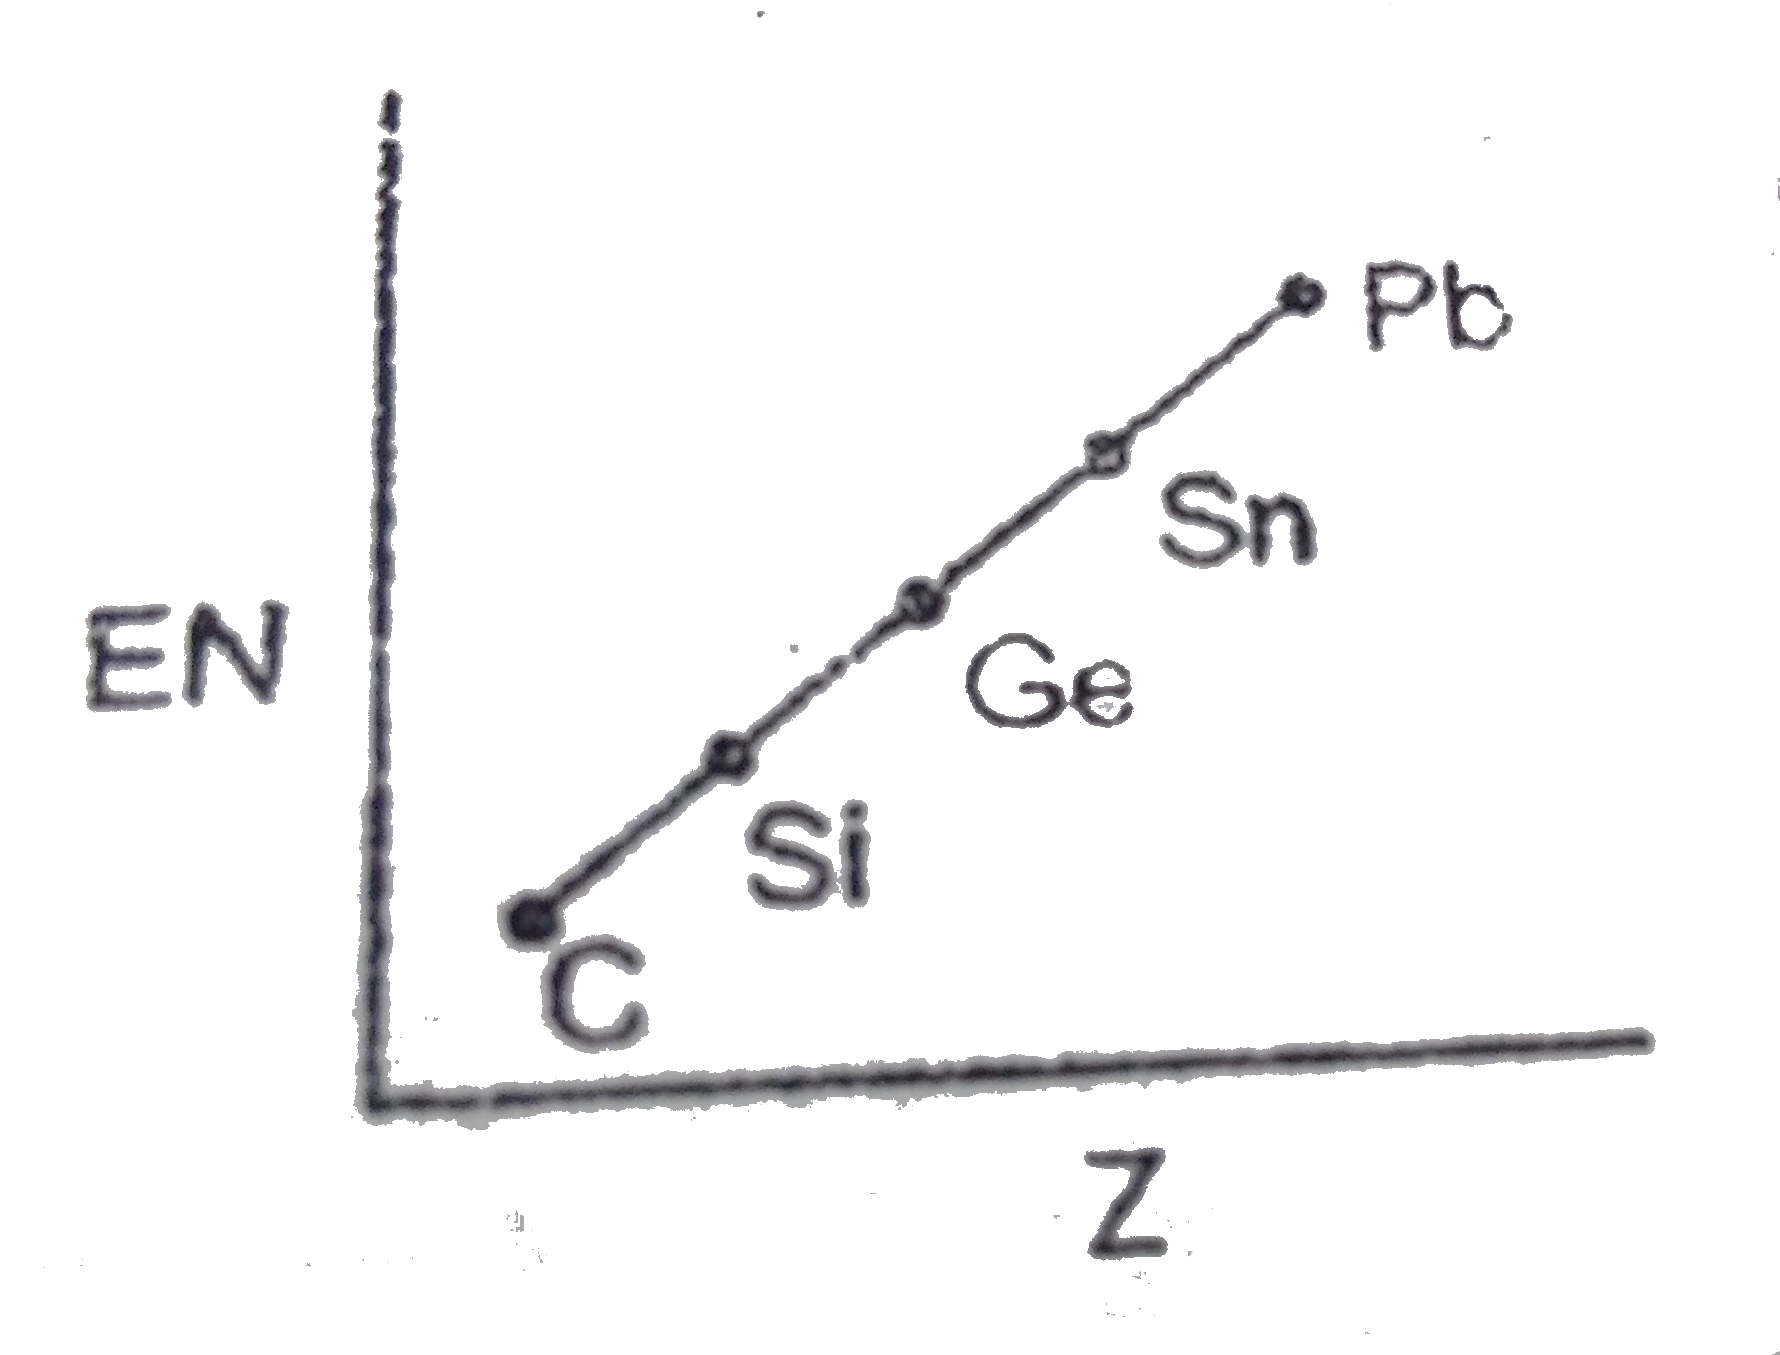
The correct Answer is:B
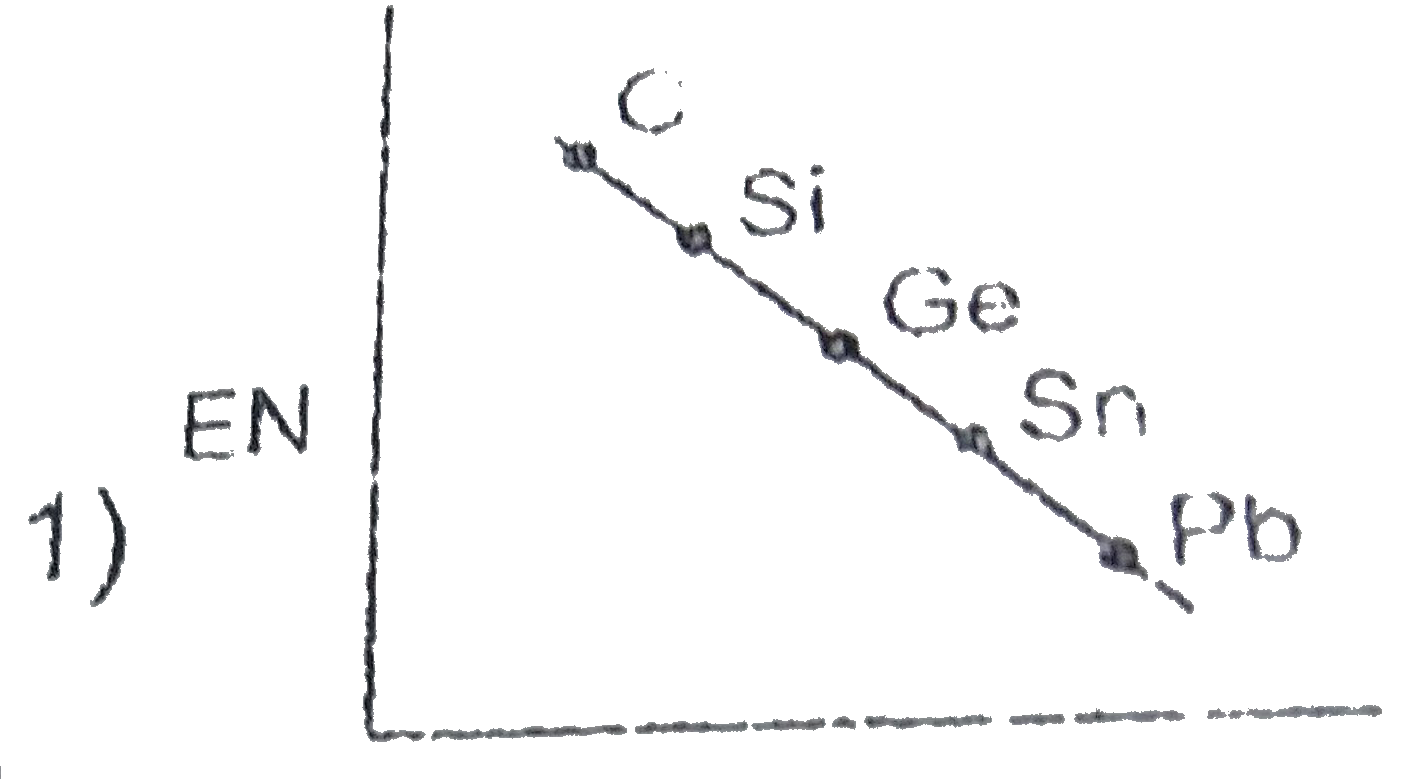
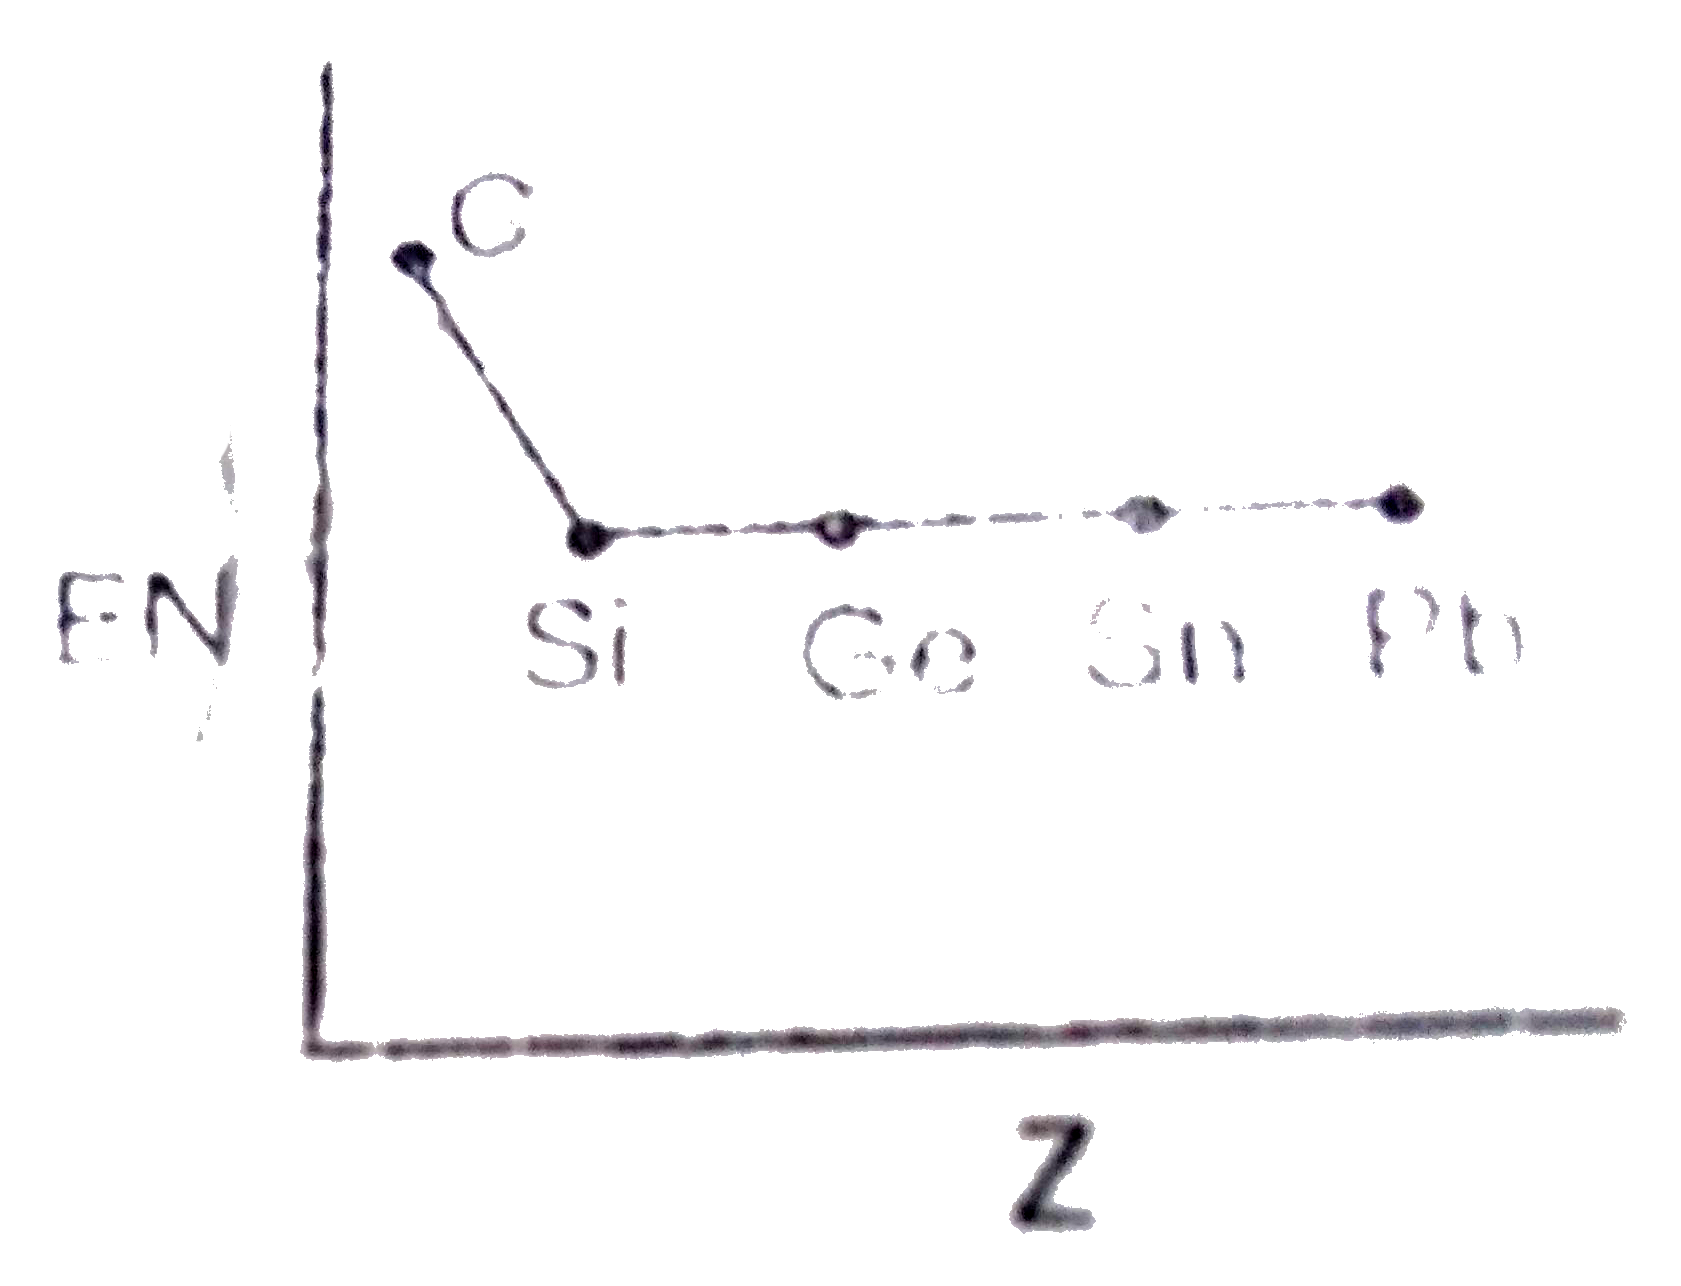
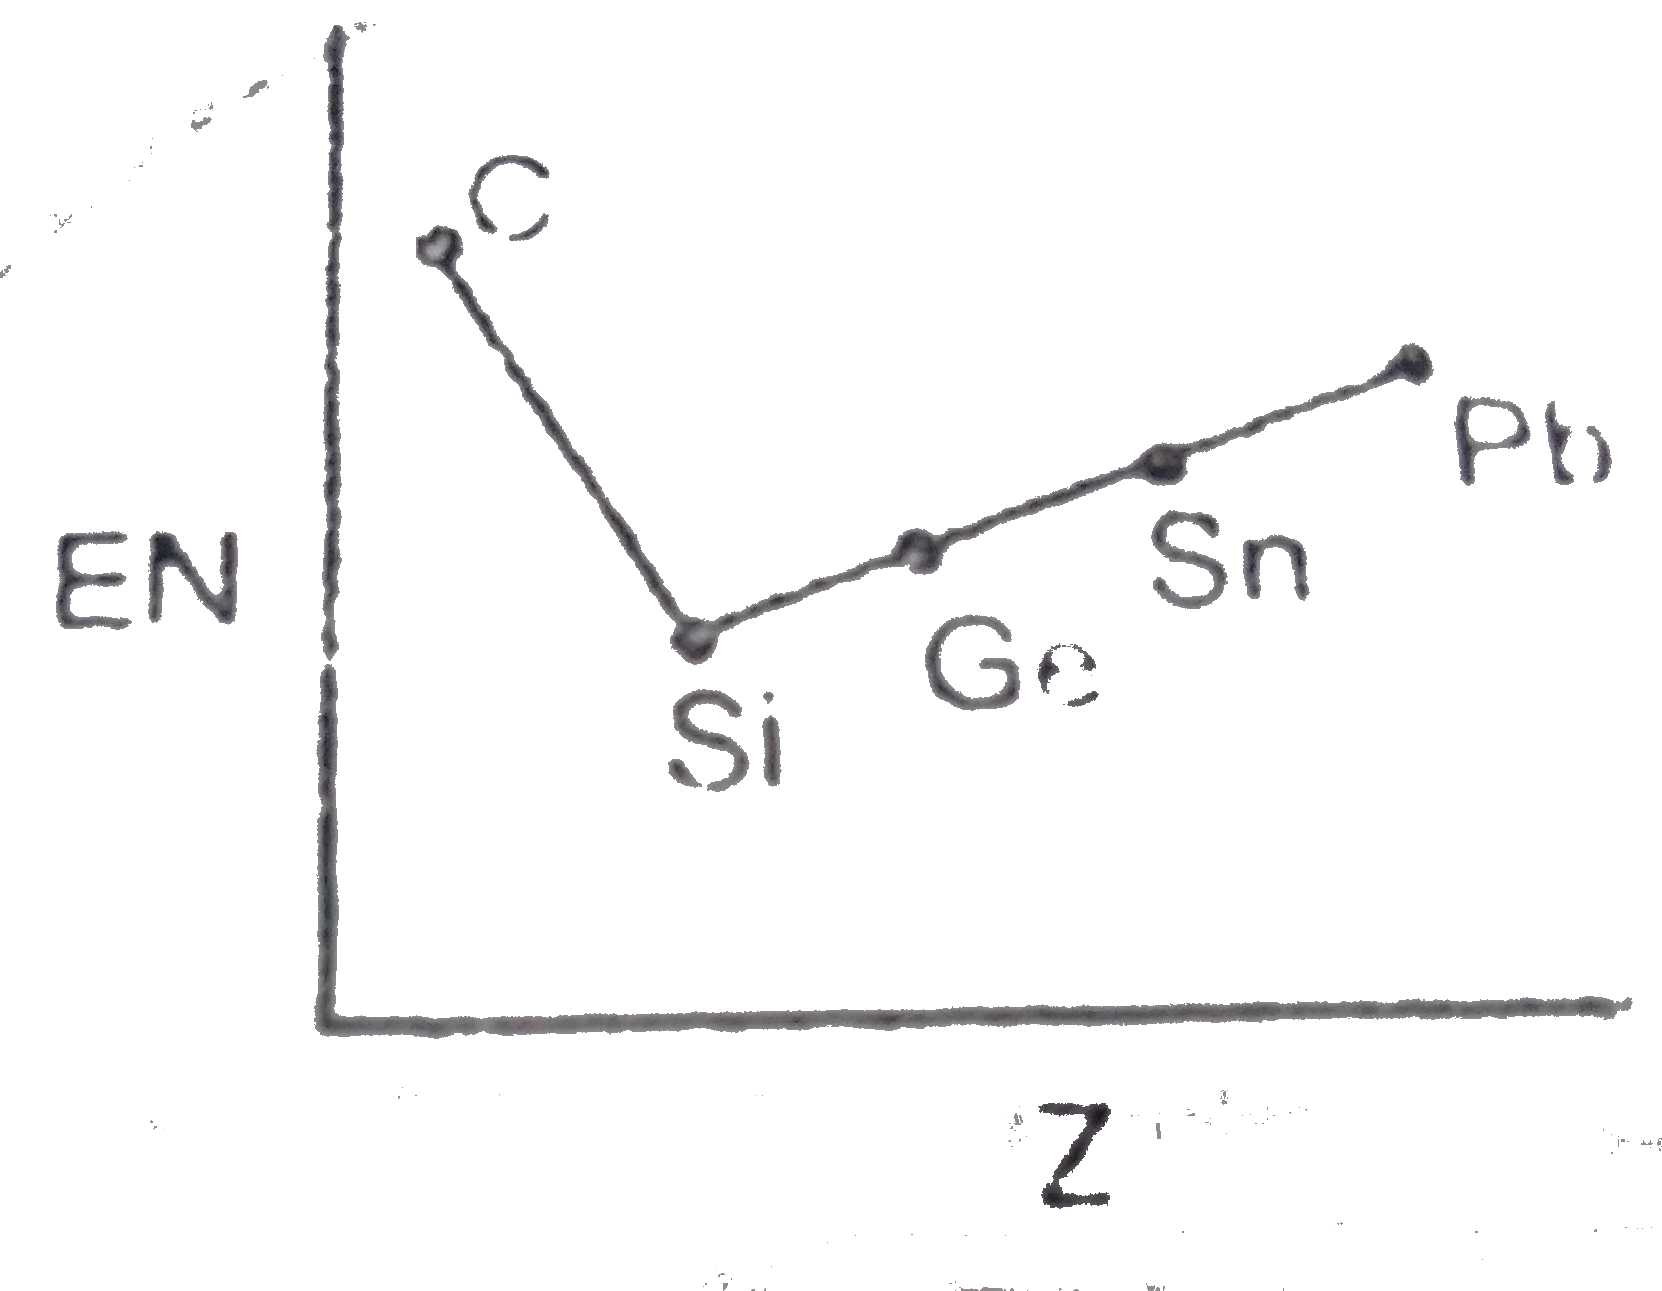
To determine the correct graph for the electronegativity (EN) values of the carbon family (Group 14 elements), we need to analyze the trend in electronegativity values as we move down the group. The carbon family consists of the following elements: carbon (C), silicon (Si), germanium (Ge), tin (Sn), and lead (Pb).
1. Identify the Elements in the Carbon Family:
- The carbon family includes carbon (C), silicon (Si), germanium (Ge), tin (Sn), and lead (Pb).
2. List the Electronegativity Values:
- Carbon (C): 2.5
- Silicon (Si): 1.8
- Germanium (Ge): 1.8
- Tin (Sn): 1.8
- Lead (Pb): 1.9
3. Analyze the Trend:
- As we move down the group from carbon to lead, the electronegativity values generally decrease.
- Carbon has the highest electronegativity (2.5), followed by silicon, germanium, and tin, which all have similar values (approximately 1.8). Lead has a slightly higher value than tin at 1.9.
4. Graph the Values:
- On the x-axis, plot the atomic number (or position in the group: 1 for C, 2 for Si, 3 for Ge, 4 for Sn, 5 for Pb).
- On the y-axis, plot the electronegativity values.
- The graph should start at 2.5 for carbon, drop to 1.8 for silicon, remain at 1.8 for germanium and tin, and then slightly increase to 1.9 for lead.
5. Determine the Correct Graph:
- The correct graph should show a decrease from carbon to silicon, a plateau at 1.8 for germanium and tin, and a slight increase for lead.
- Therefore, the correct option is the one that reflects this trend accurately.
Conclusion:
The correct graph for the electronegativity values of the carbon family is the one that shows a decrease from carbon to silicon, a plateau for germanium and tin, and a slight increase for lead.
- The carbon family includes carbon (C), silicon (Si), germanium (Ge), tin (Sn), and lead (Pb).
- Carbon (C): 2.5
- Silicon (Si): 1.8
- Germanium (Ge): 1.8
- Tin (Sn): 1.8
- Lead (Pb): 1.9
- As we move down the group from carbon to lead, the electronegativity values generally decrease.
- Carbon has the highest electronegativity (2.5), followed by silicon, germanium, and tin, which all have similar values (approximately 1.8). Lead has a slightly higher value than tin at 1.9.
- On the x-axis, plot the atomic number (or position in the group: 1 for C, 2 for Si, 3 for Ge, 4 for Sn, 5 for Pb).
- On the y-axis, plot the electronegativity values.
- The graph should start at 2.5 for carbon, drop to 1.8 for silicon, remain at 1.8 for germanium and tin, and then slightly increase to 1.9 for lead.
- The correct graph should show a decrease from carbon to silicon, a plateau at 1.8 for germanium and tin, and a slight increase for lead.
- Therefore, the correct option is the one that reflects this trend accurately.
The correct graph for the electronegativity values of the carbon family is the one that shows a decrease from carbon to silicon, a plateau for germanium and tin, and a slight increase for lead.
Topper's Solved these Questions
- P-BLOCK ELEMENT (BORON AND CARBON FAMILY)BOOK - RESONANCE ENGLISHCHAPTER - P-BLOCK ELEMENT (BORON AND CARBON FAMILY)EXERCISE - SECTION-1
7 Videos
- P-BLOCK ELEMENT (BORON AND CARBON FAMILY)BOOK - RESONANCE ENGLISHCHAPTER - P-BLOCK ELEMENT (BORON AND CARBON FAMILY)EXERCISE - SECTION-2
5 Videos
- P-BLOCK ELEMENT (BORON AND CARBON FAMILY)BOOK - RESONANCE ENGLISHCHAPTER - P-BLOCK ELEMENT (BORON AND CARBON FAMILY)EXERCISE - Exercise-3 Part-II : JEE (MAIN) / AIEE PROBLEMS (PREVIOUS YEARS)
12 Videos
- P BLOCK ELEMENTSBOOK - RESONANCE ENGLISHCHAPTER - P BLOCK ELEMENTSEXERCISE - PART -II
23 Videos
- P-BLOCK ELEMENTS (HALOGEN & NOBLE GASES)BOOK - RESONANCE ENGLISHCHAPTER - P-BLOCK ELEMENTS (HALOGEN & NOBLE GASES)EXERCISE - APSP PART-3
22 Videos
Similar Questions
Knowledge Check
Which of the following represents the correct graph for SN2 reaction ?
A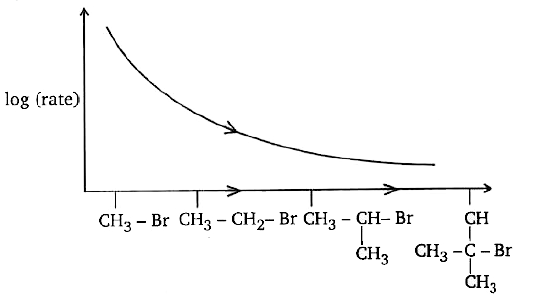 B
B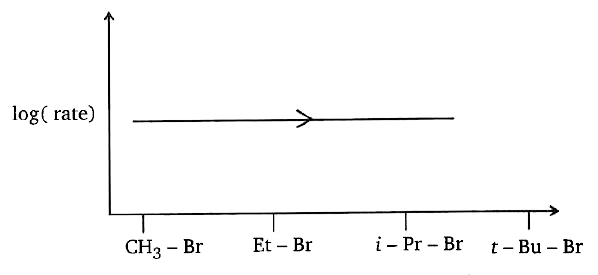 C
C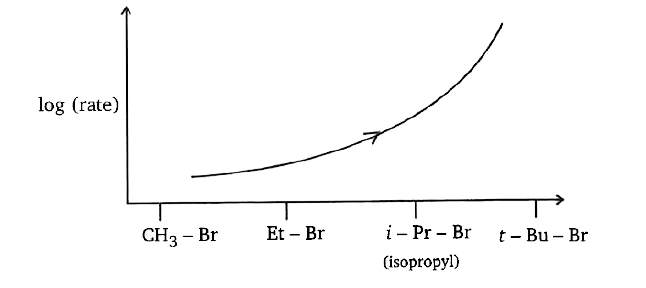 D
D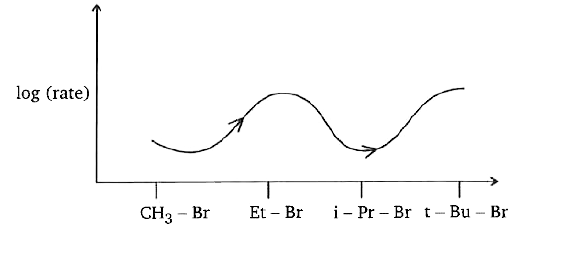
Which of the following is correct for V-I graph of a good conductor?
A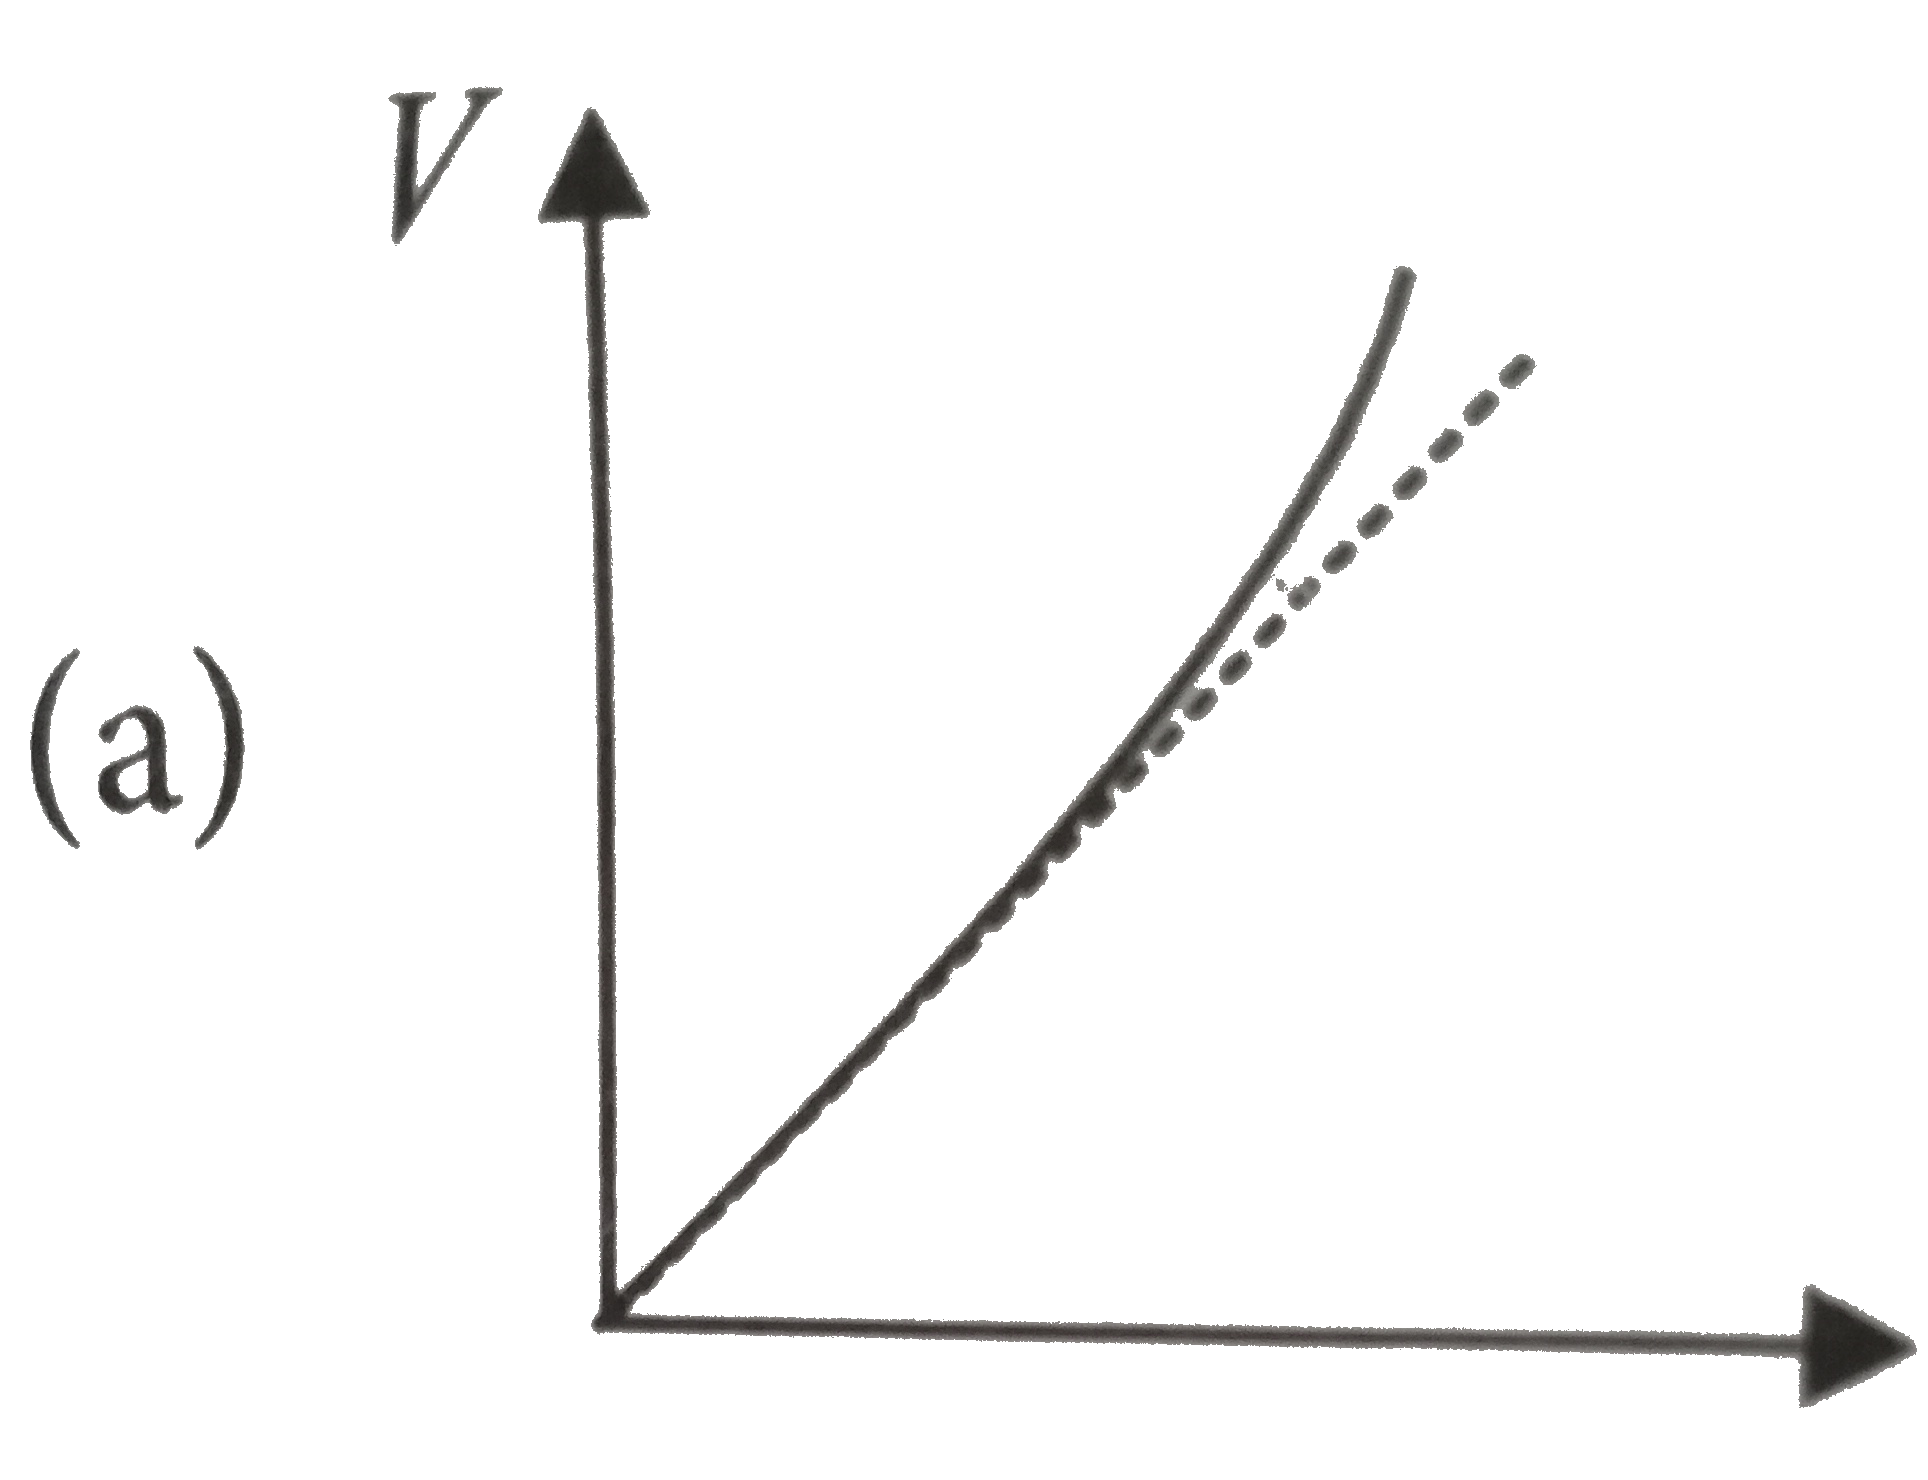 B
B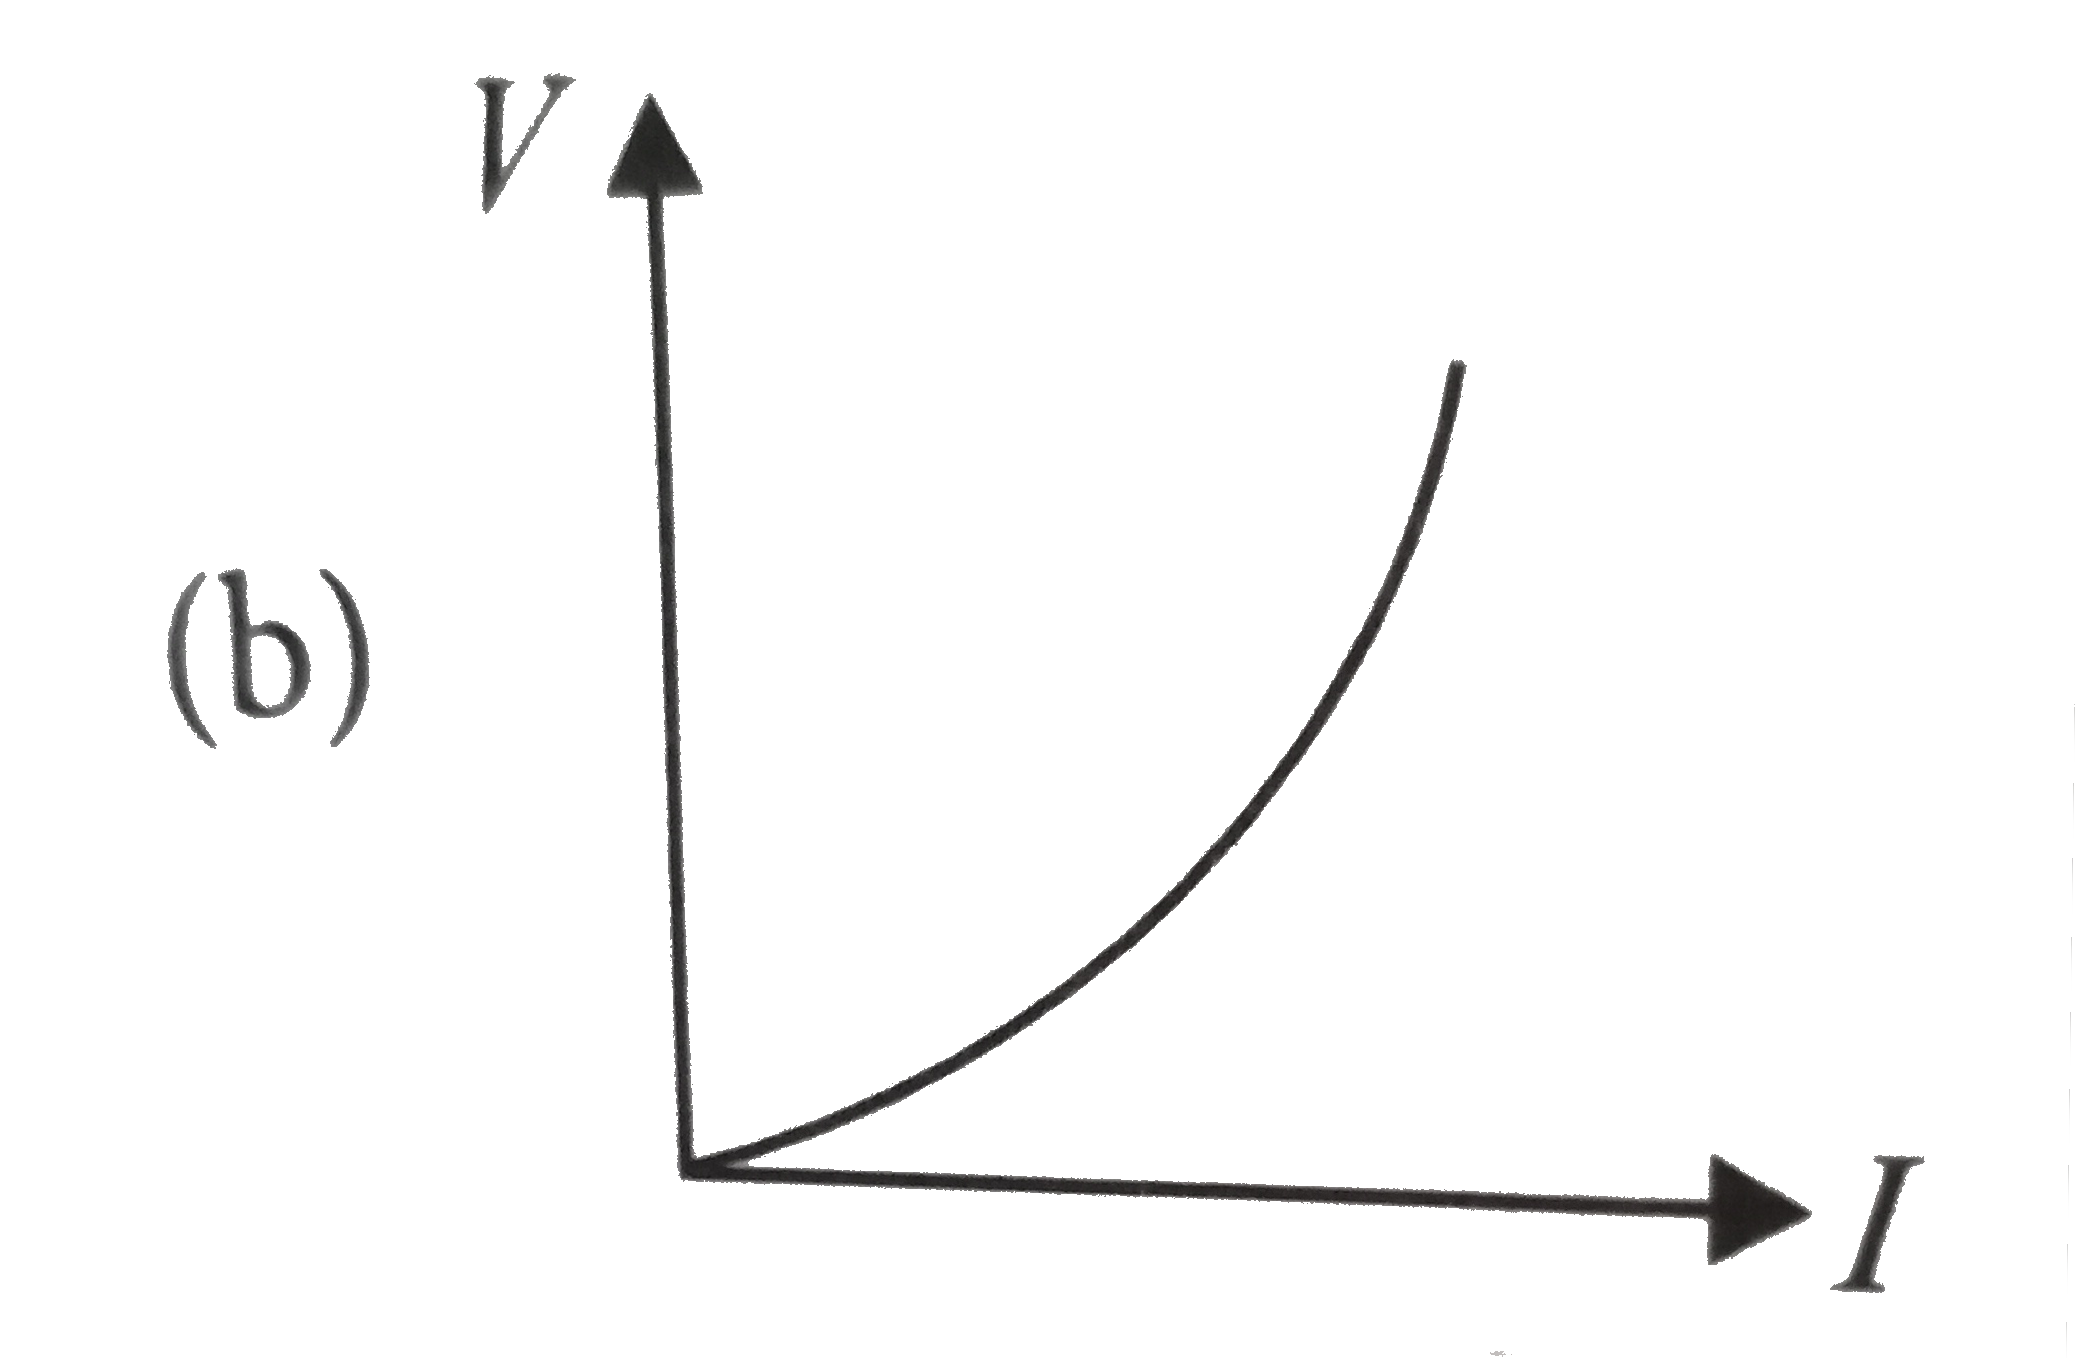 C
C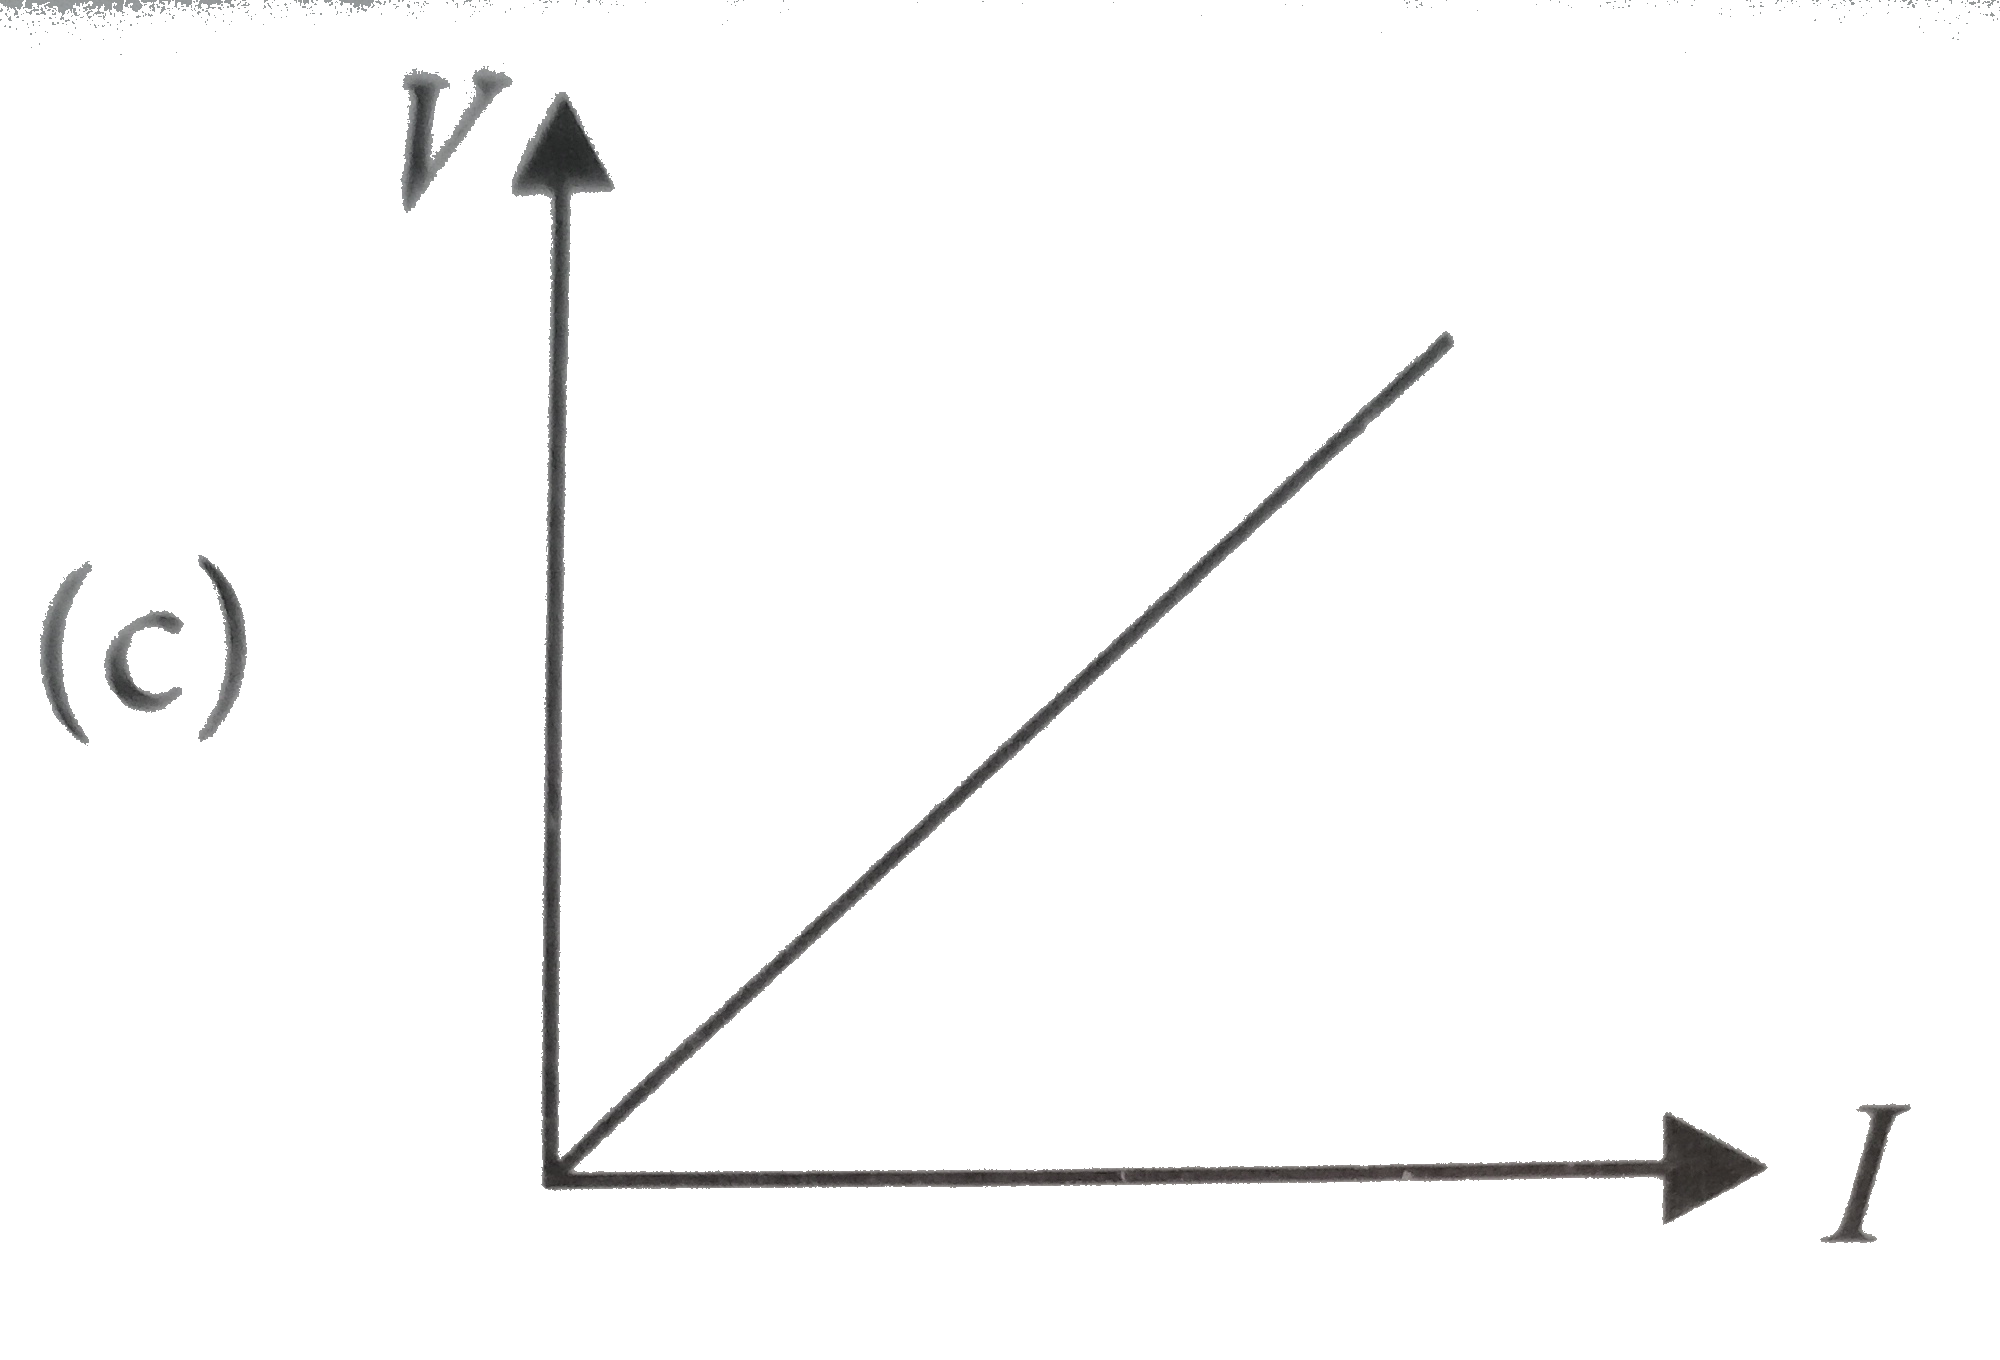 D
D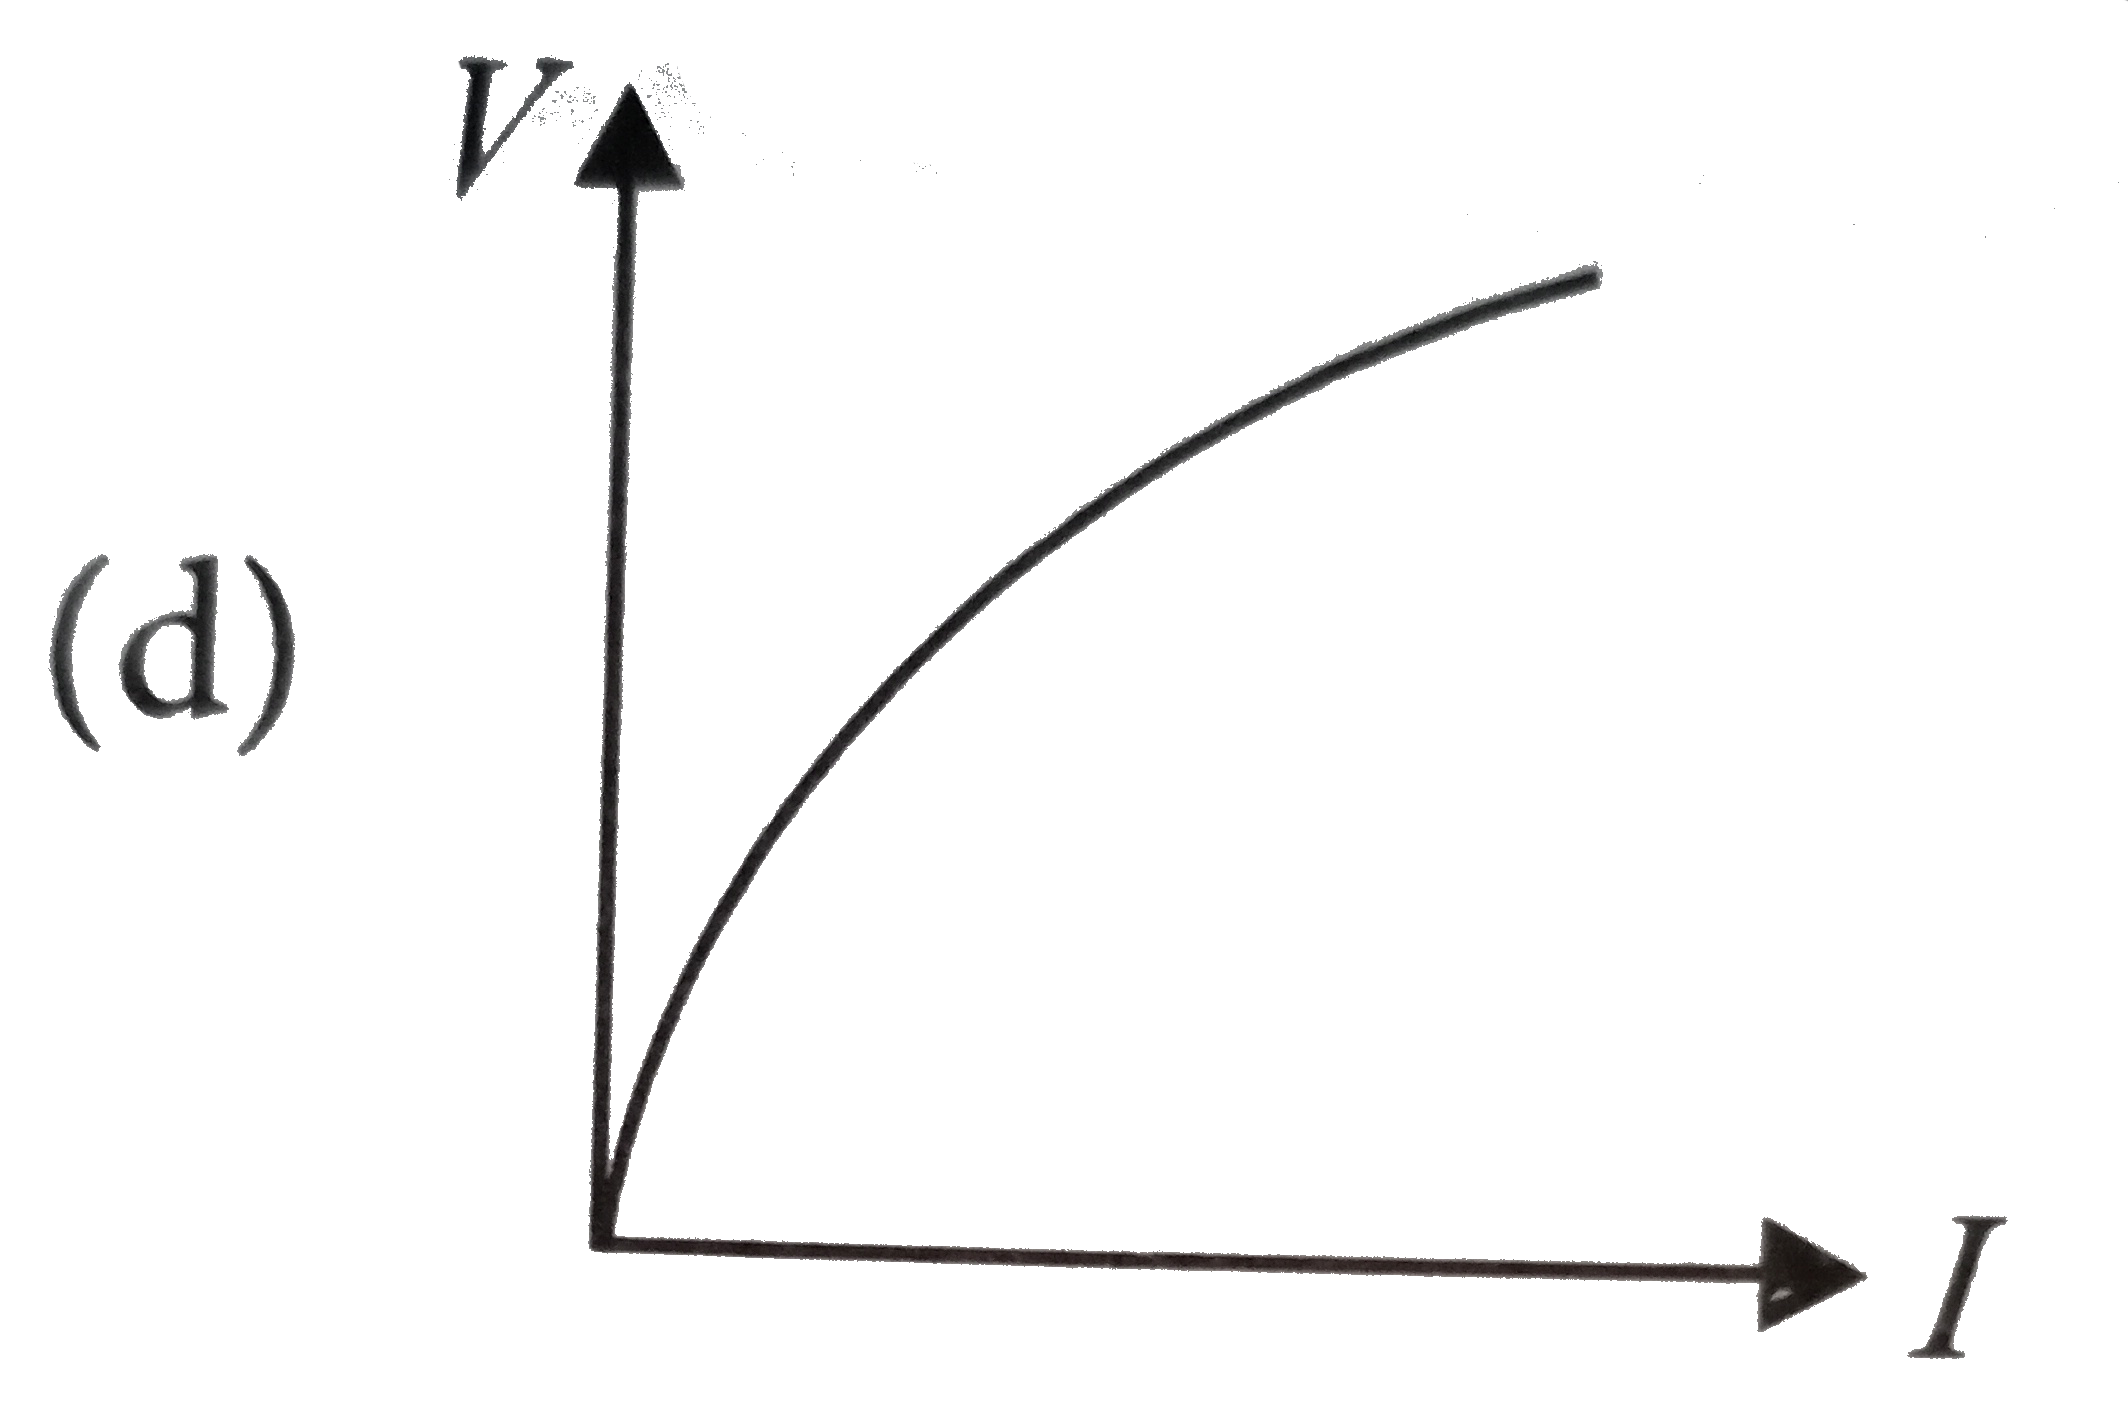
Which of the following is the correct order of classification?
(a) Domain - Kingdom - Phylum - Class - Order - Family -Genus - Species
(b) Kingdom - Domain - Class - Phylum - Order - Family - Genus - Species
(c) Kingdom - Domain - Class - Phylum - Order - Genus - Species - Family
(d) Kingdom - Class - Phylum - Domain - Genus - Order - Family - SpeciesADomain - Kingdom - Phylum - Class - Order - Family -Genus - SpeciesBKingdom - Domain - Class - Phylum - Order - Family - Genus - SpeciesCKingdom - Domain - Class - Phylum - Order - Genus - Species - FamilyDKingdom - Class - Phylum - Domain - Genus - Order - Family - Species
Which of the following is correct regarding tricuspid value
View SolutionWhich of the following is correct for a carbon family?
View SolutionWhich is/are correct graph ?
View SolutionWhich of the following is correct with reference to flowers of family solanaceae
View SolutionWhich of the following is not correct about carbon monoxide?
View Solution

