The given figure shows the thickness of the uterine layer of an adult woman during a period of time
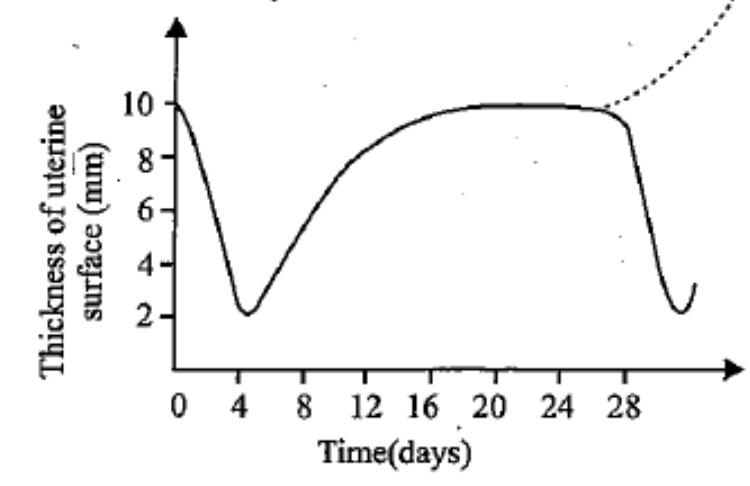
Which of the following conditions is expected to occur in the beginning, if the curve continues along the dotted line ?
A placenta would form on the uterus
An embryo would get embedded in the uterine layer
The amount of menstrual flow would increase
Two ova would simultaneously release from the ovary
The correct Answer is:B
Step by step video, text & image solution for The given figure shows the thickness of the uterine layer of an adult woman during a period of time Which of the following conditions is expected to occur in the beginning, if the curve continues along the dotted line ? by Biology experts to help you in doubts & scoring excellent marks in Class 12 exams.
Topper's Solved these Questions
- BOOK - NCERT FINGERTPS ENGLISHCHAPTER - ORGANISMS AND POPULATIONEXERCISE - Organisms And Population175videos
ORGANISMS AND POPULATION
- BOOK - NCERT FINGERTPS ENGLISHCHAPTER - PRINCIPLES OF INHERITANCE & VARIATIONEXERCISE - Principles Of Inheritance & Variation167videos
PRINCIPLES OF INHERITANCE & VARIATION
Similar Questions
Knowledge Check
- Question 1 - Select One
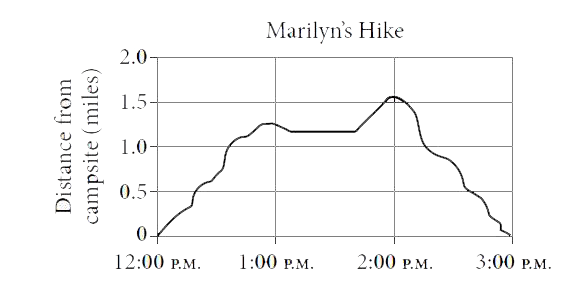
The graph above shows Marilyn’s distance from her campsite during a 3‑hour hike. She stopped for 30 minutes during her hike to have lunch. Based of the graph, which of the following is closest to the time she finished lunch and continued her hike?A12:40 pmB1:10 pmC1:40 pmD2:00 pm
Which of the following pH curve represent the titration of weak acid and strong base (dotted line show equivalence point)?
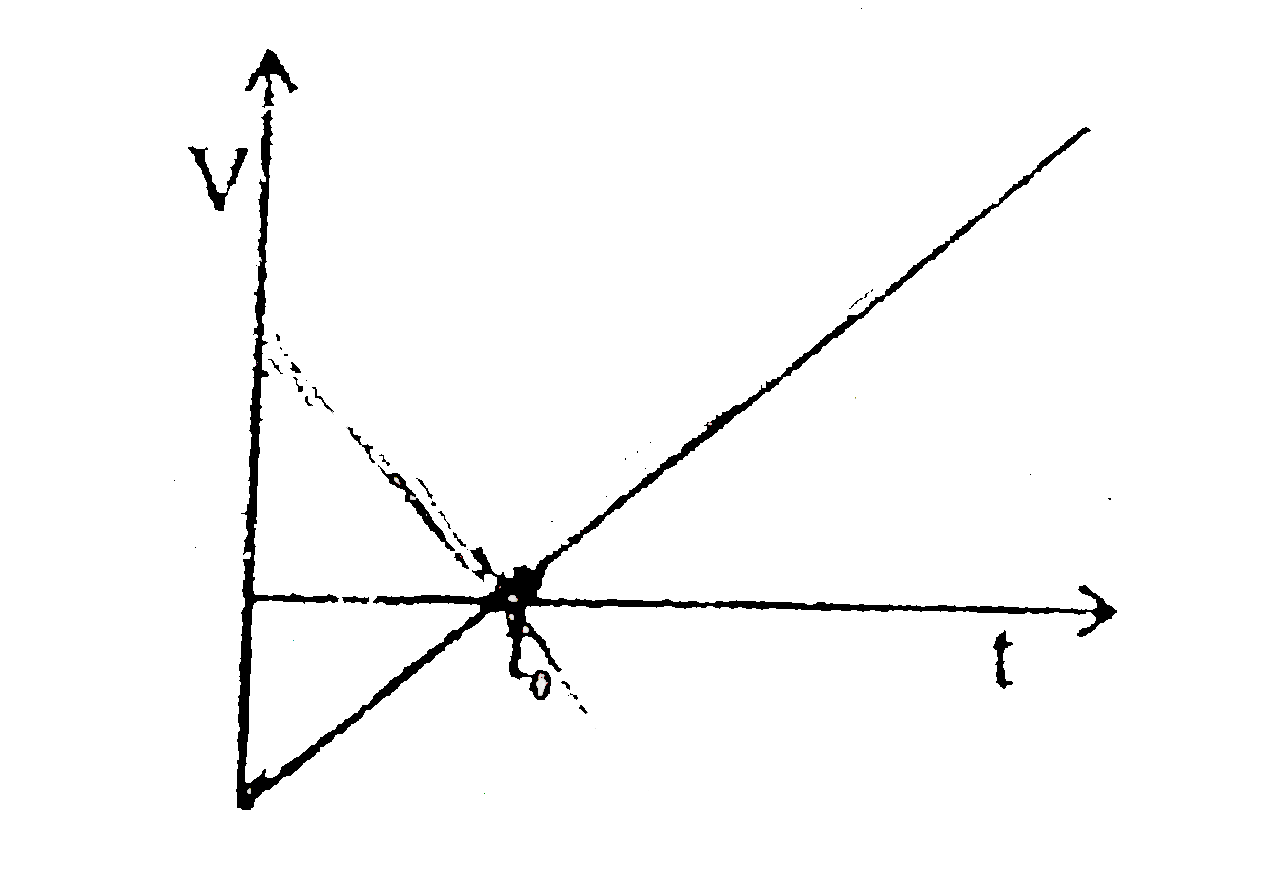
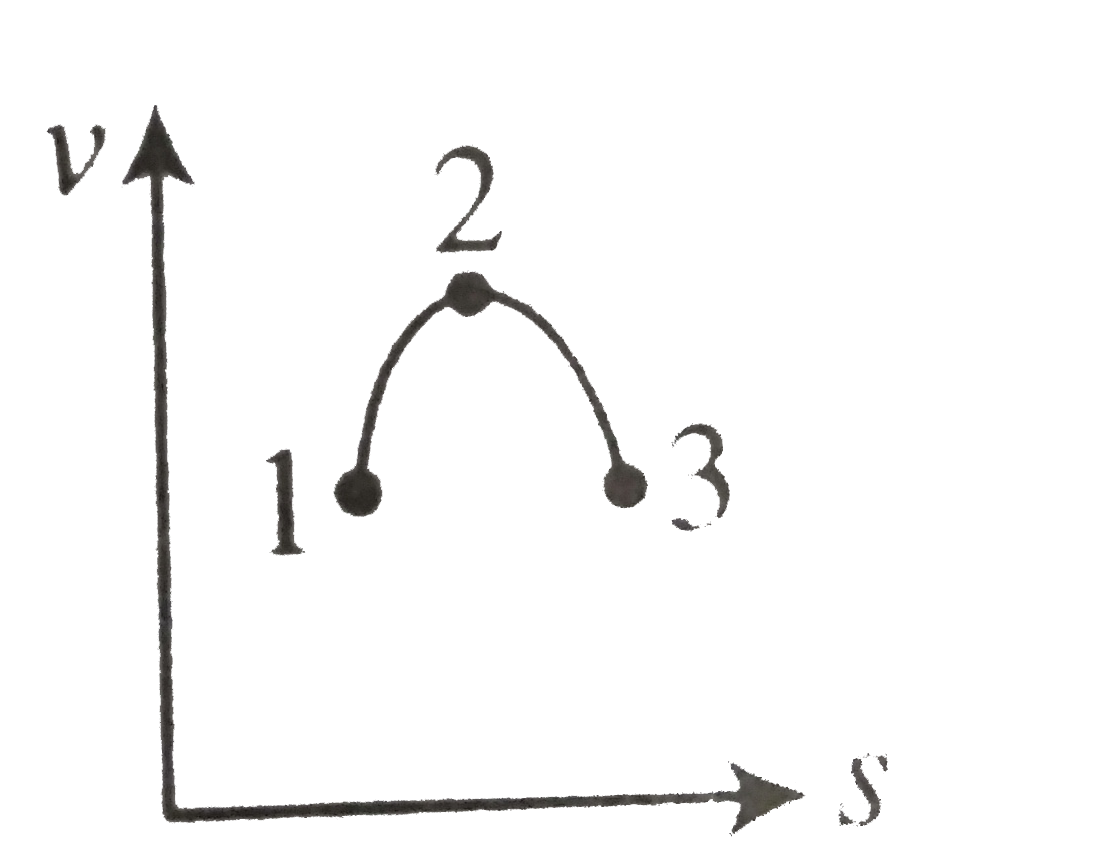
View SolutionFigure shows the velocity-displacement curve for an object moving along a straight line. At which of the points marked is the object speeding up?
 View Solution
Figure shows the velocity-displacement curve for an object moving along a straight line. At which of the points marked is the object speeding up?
 View Solution
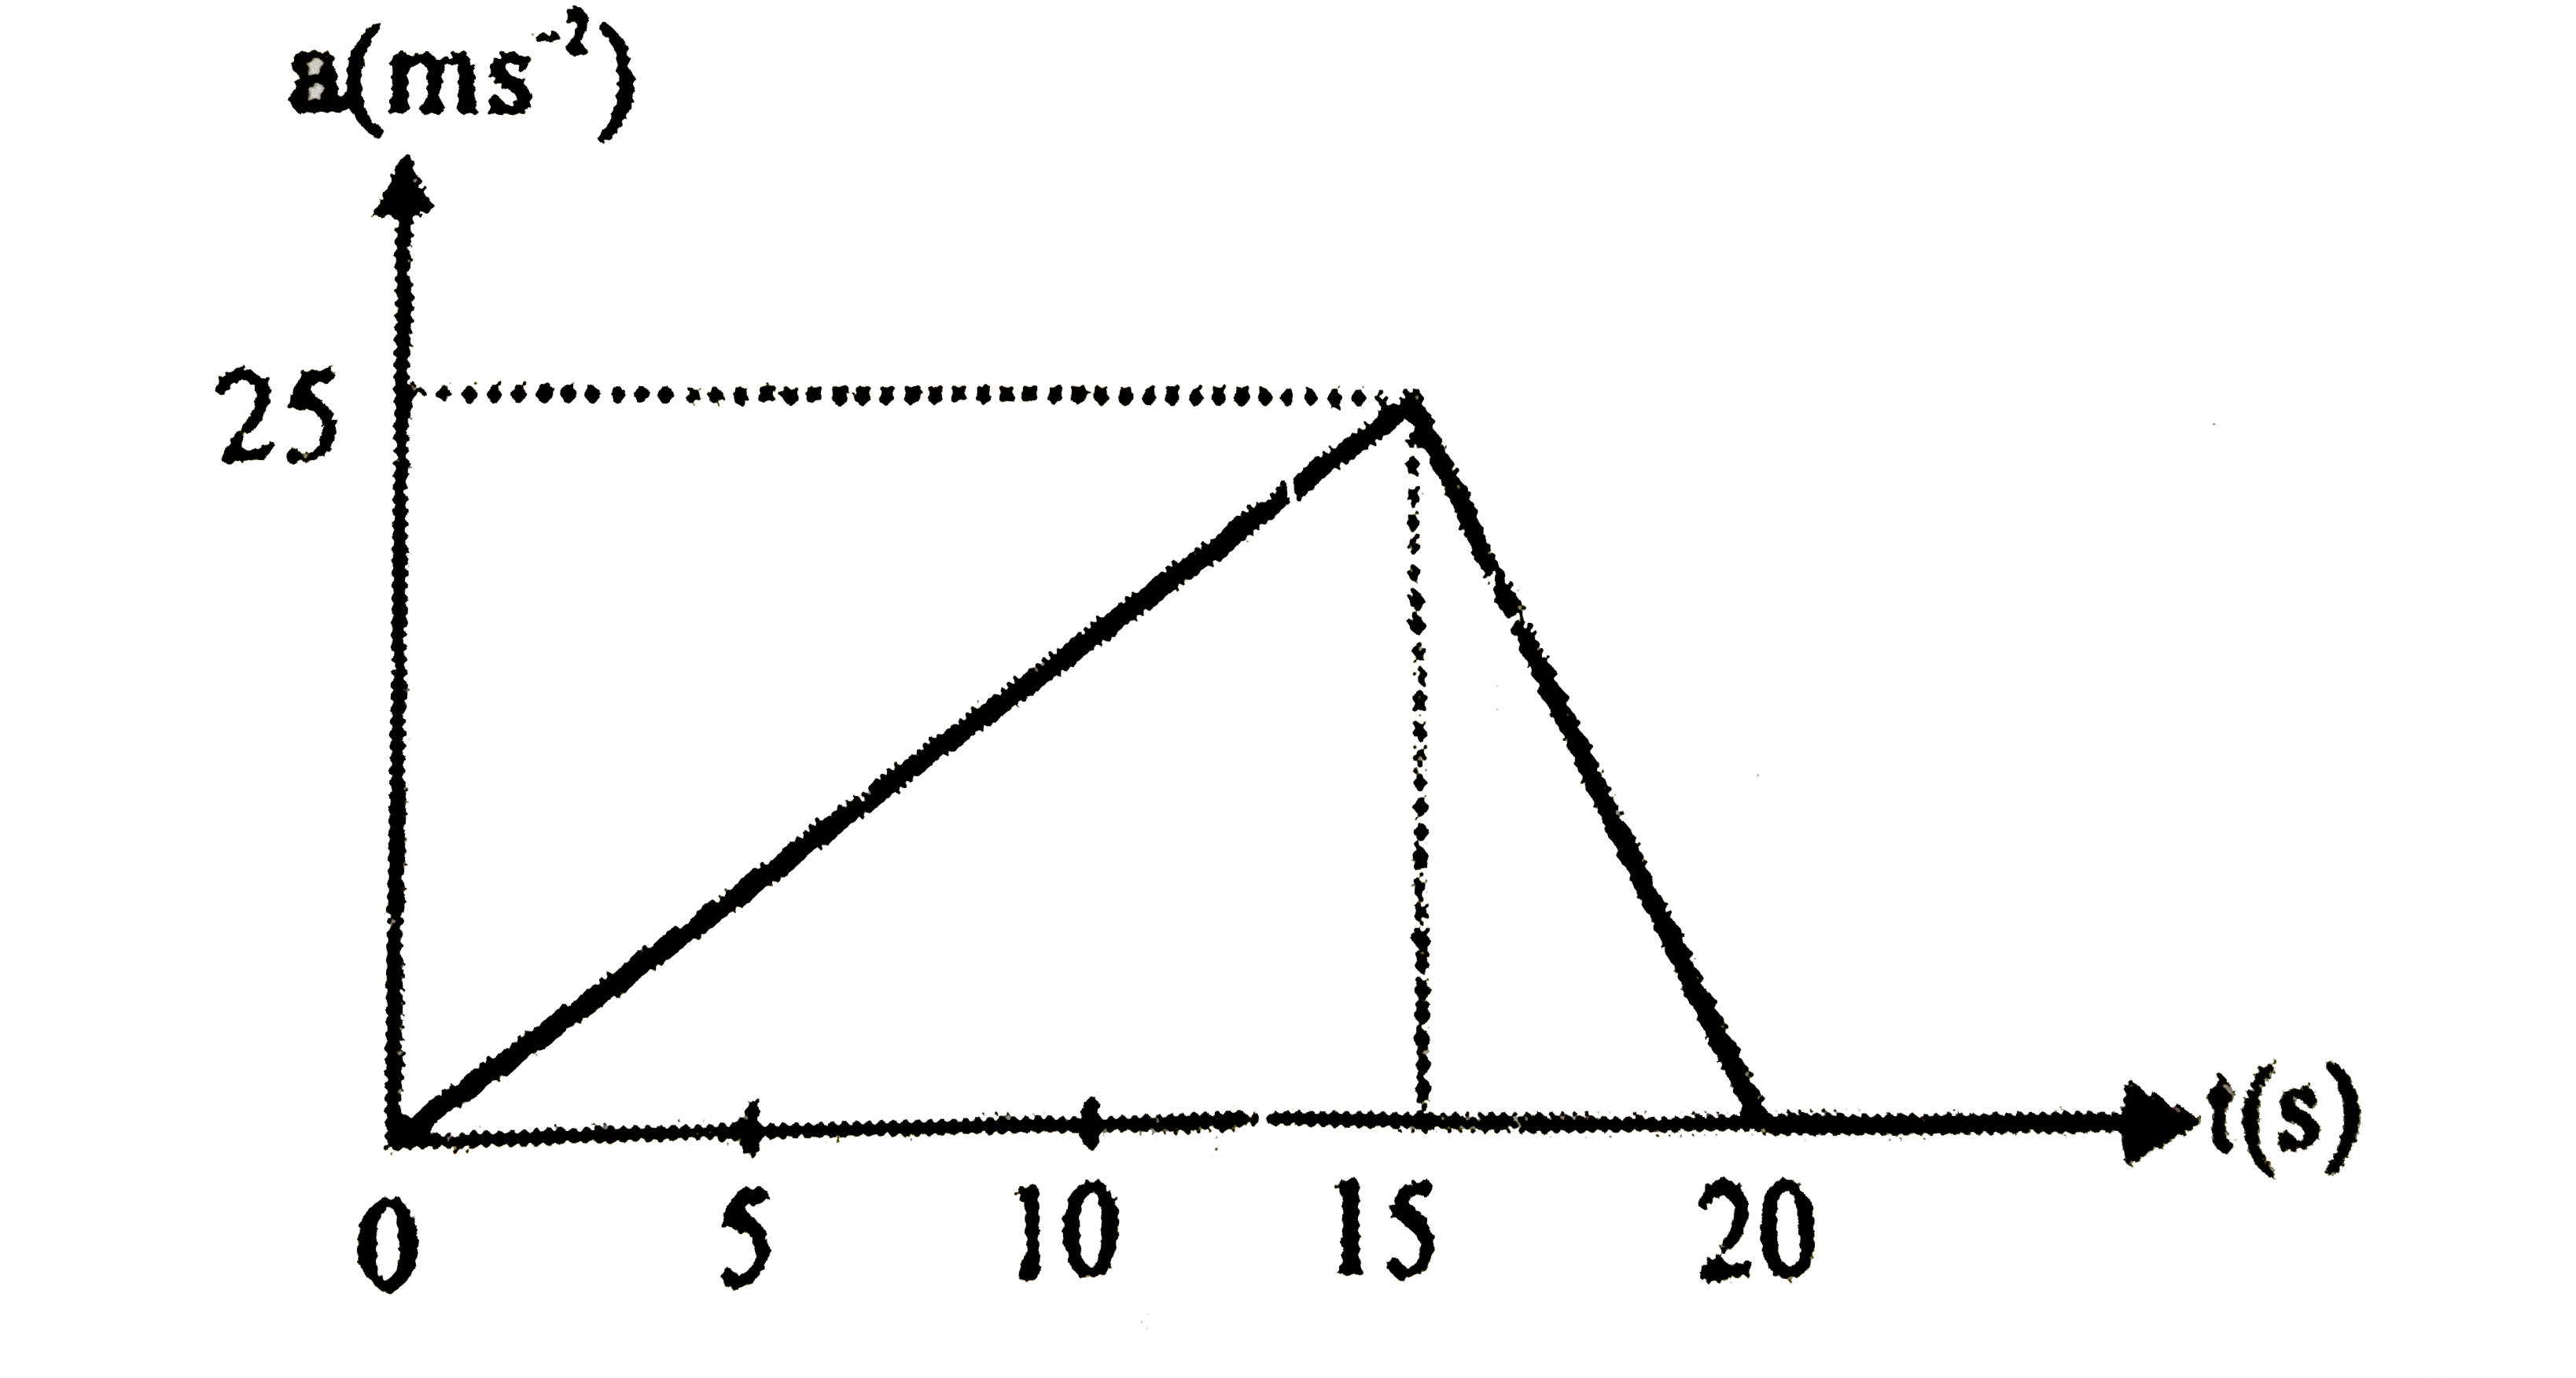
Figure shows acceleration versus time graph of a particle starting from rest and moving along a straight line. Which of the following staement (s) is/are correct ?
 View Solution
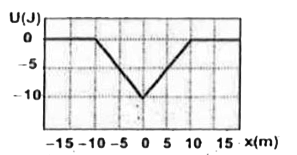
Figure shows a graph of potential energy.
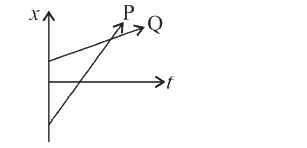
Consider the following graphs of position and time.
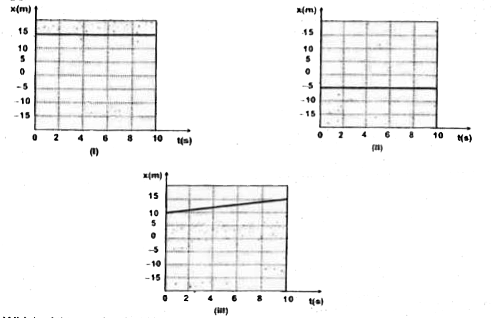
Which of the graphs could be the motion of a particle in the given potential?View SolutionThe given figure shows the position of a medium particle at t=0, supporting a simple harmonic wave travelling either along or opposite to the positive x-axis.
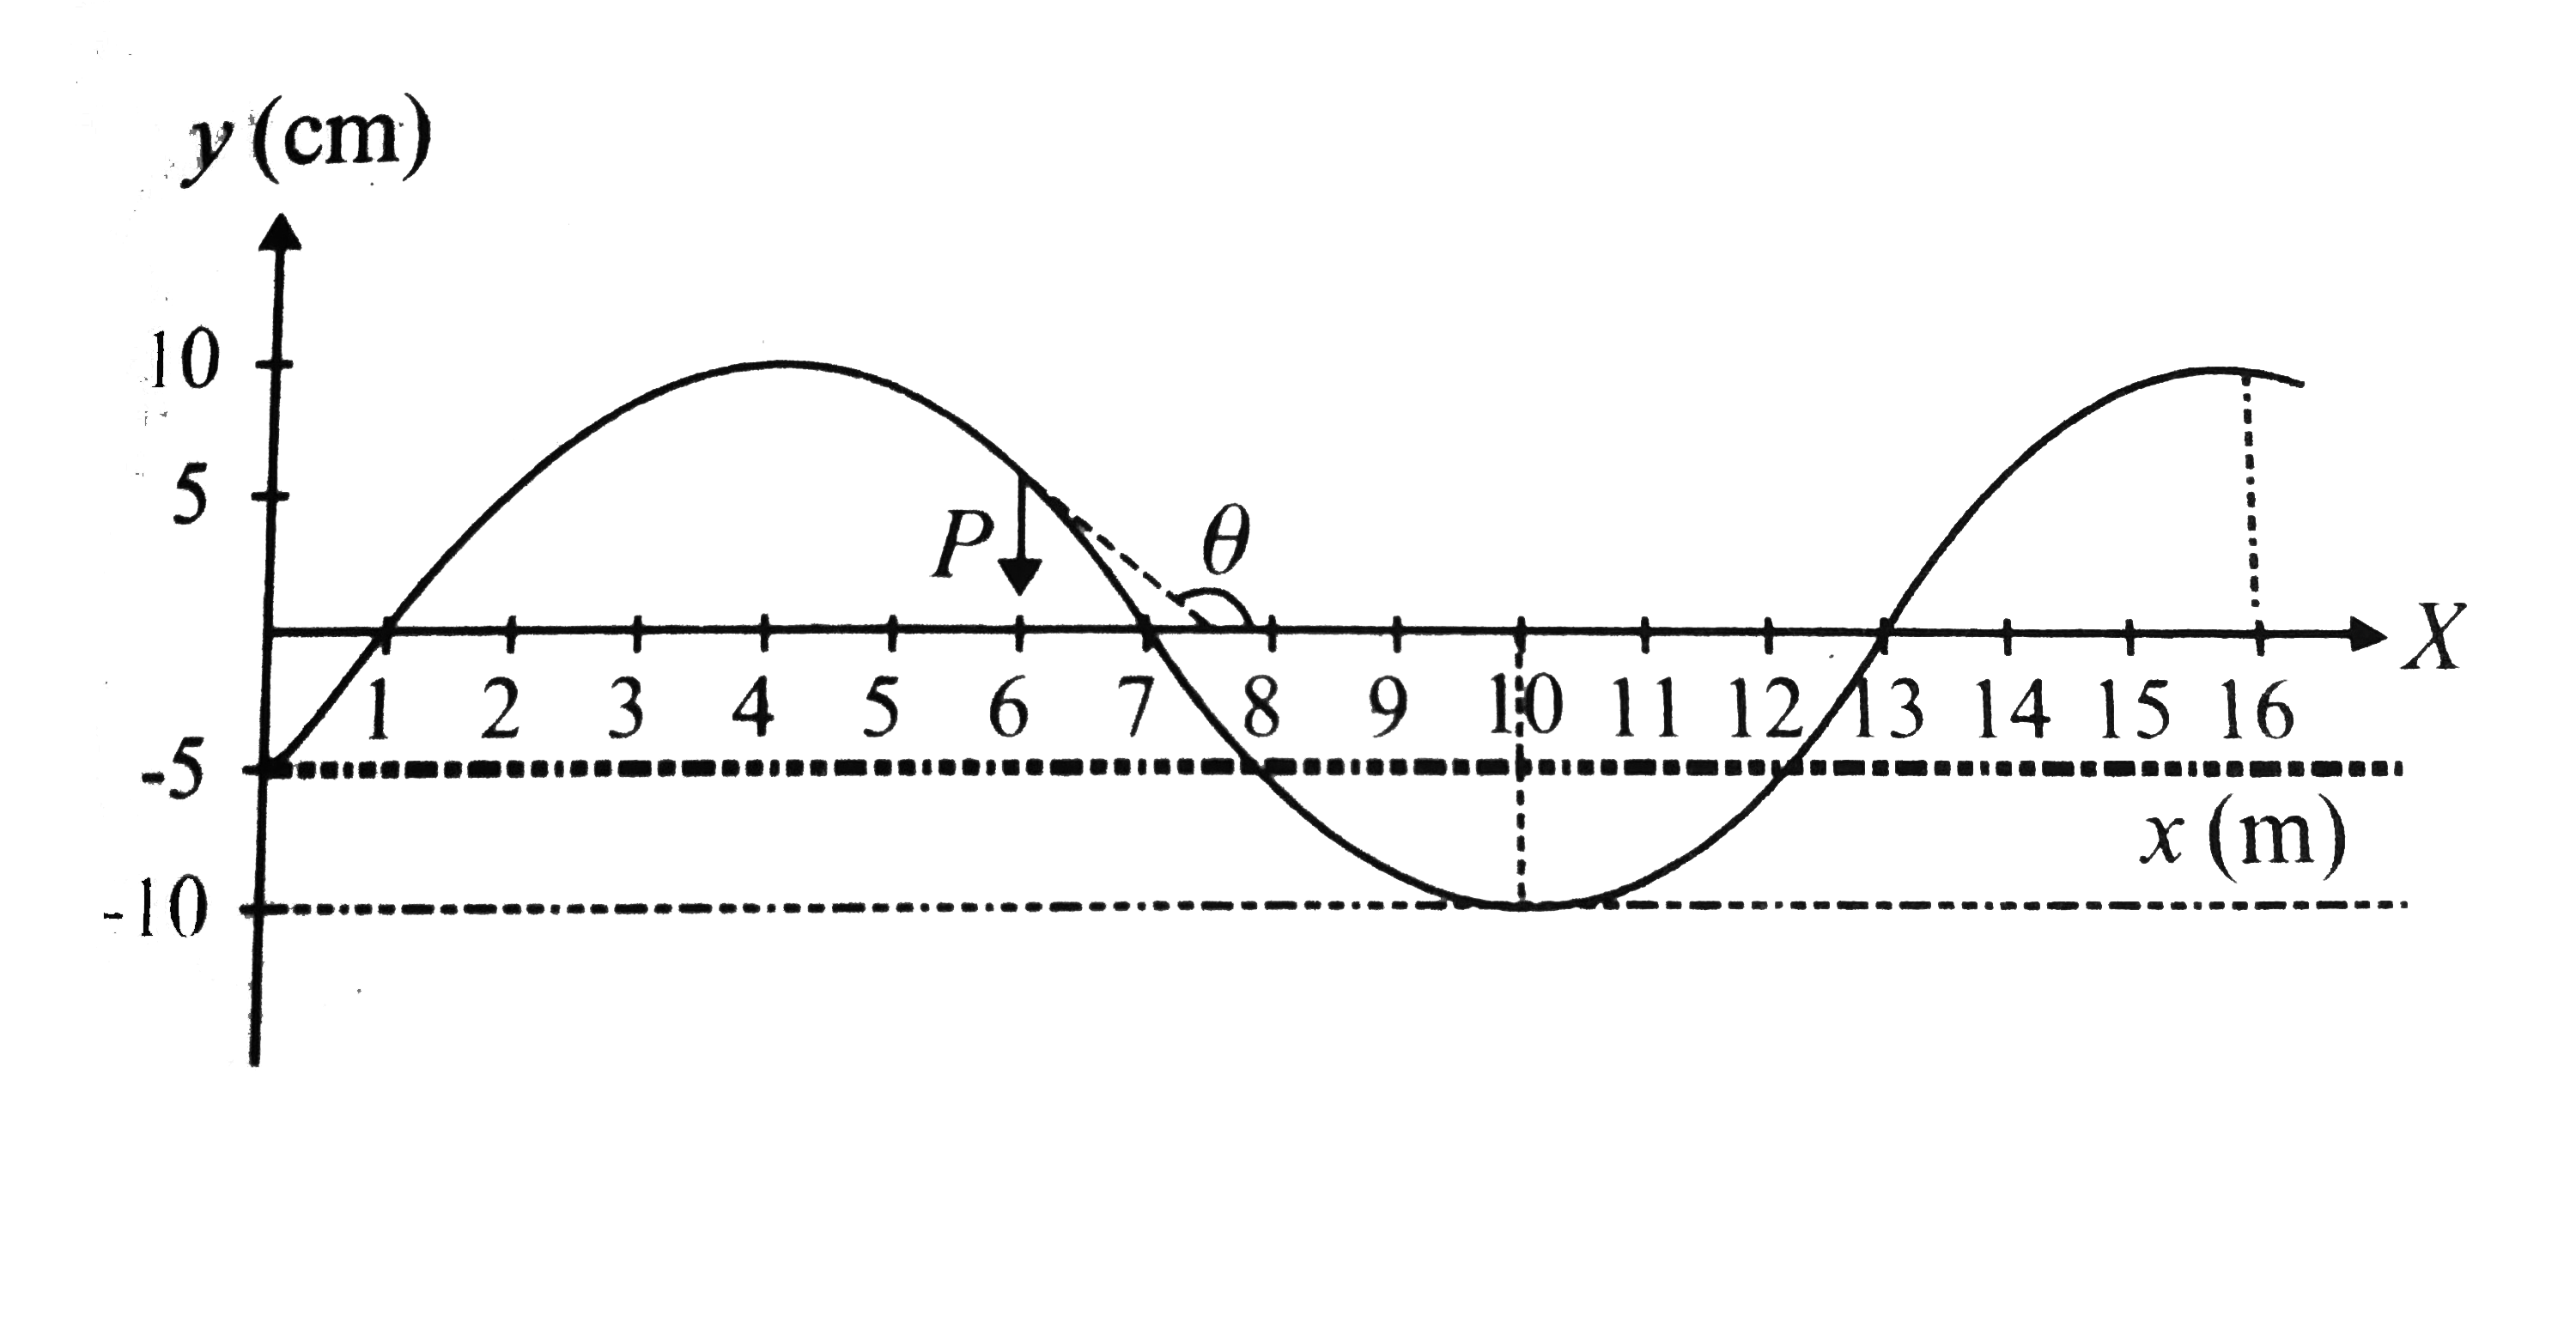
(a) write down the equation of the curve.
(b) find the angle θ made by the tangent at point P with the x-axis.
(c ) If the particle at P has a velocity vpm/s, in the negative y-direction, as shown in figure, then determine the speed and direction of the wave.
(d) find the frequency of the wave.
(e) find the displacement equation of the particle at the origin as a function of time.
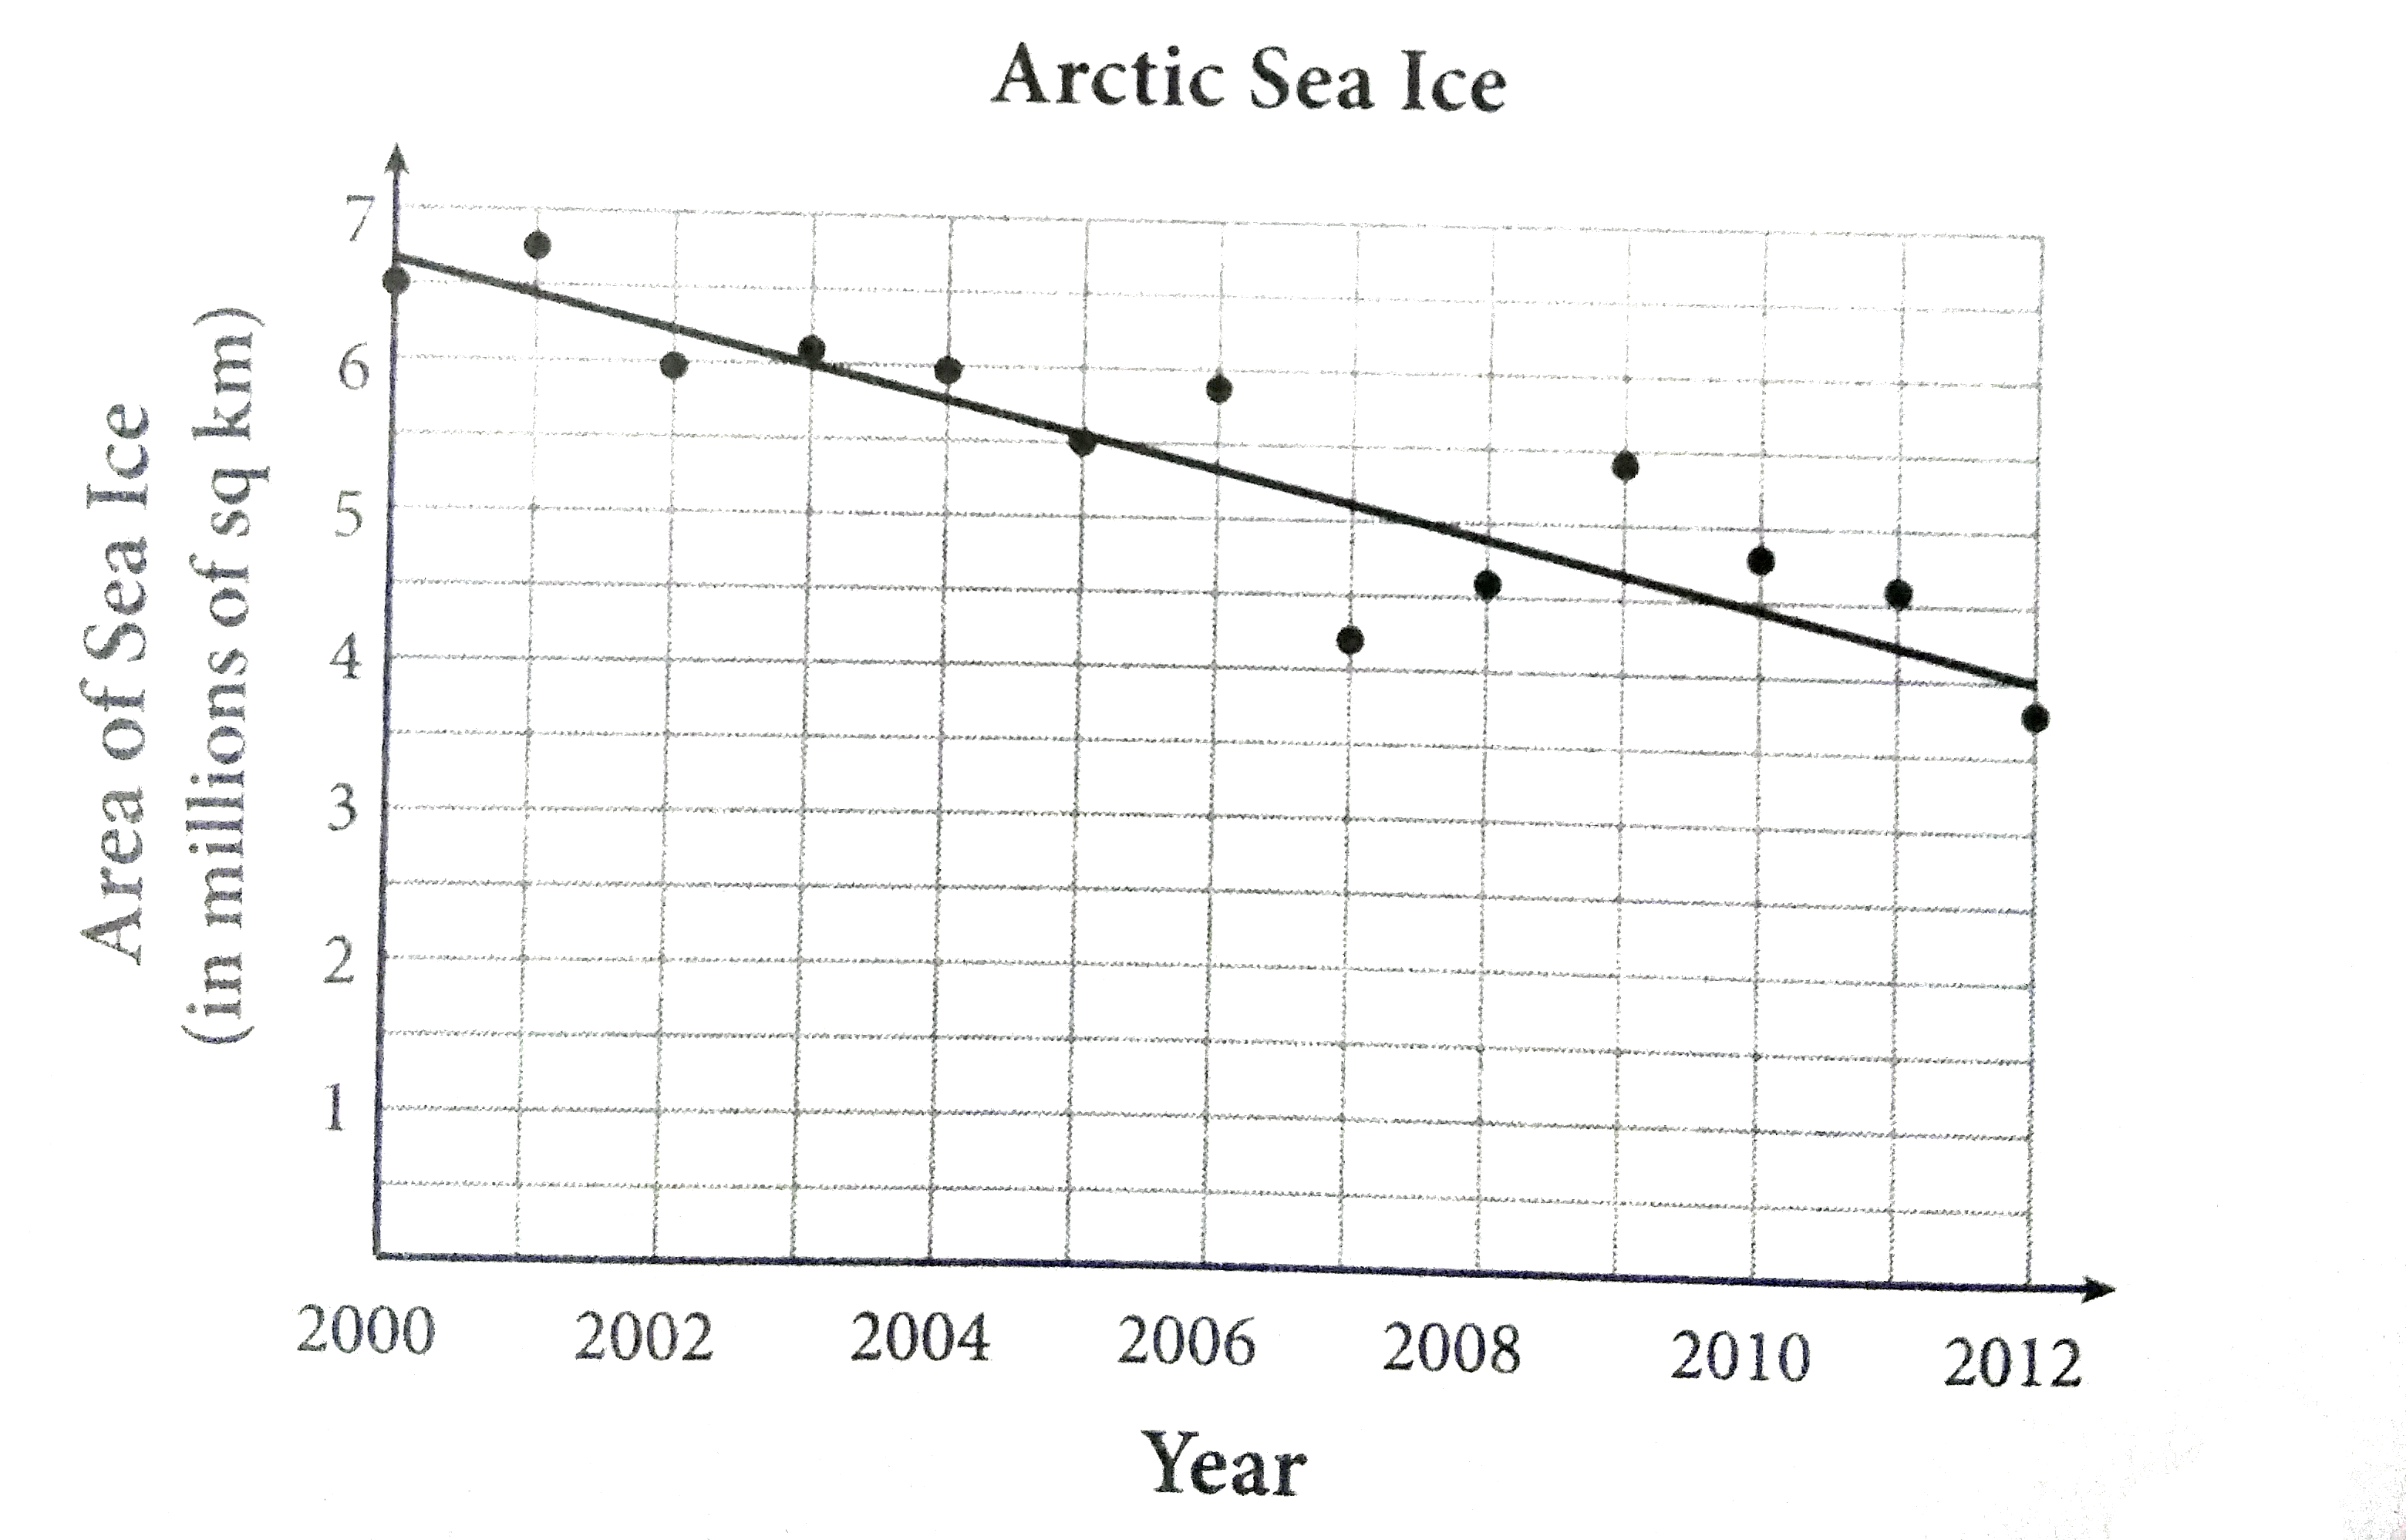
(f) find the displacement equation of the wave.View SolutionSea ice extent is a measurement of the area of ocean with at least 15% sea ice. The graph below shows data for the extent of Artic sea ice between 2000 and 2012 as reported by the National Snow and Ice Data Center. The line of best fit is also shown. The equations of the line is A(t)=−0.187t+380.5, where A(t) represents the area of measurement sea ice in the Artic Ocean in the year t.
Q. Based on the equation of the line of best fit, which of the following statements accurately of measurable Arctic sea ice during the given times period?View Solution


