Mark the correct choice of electrolytes represented in the graph.
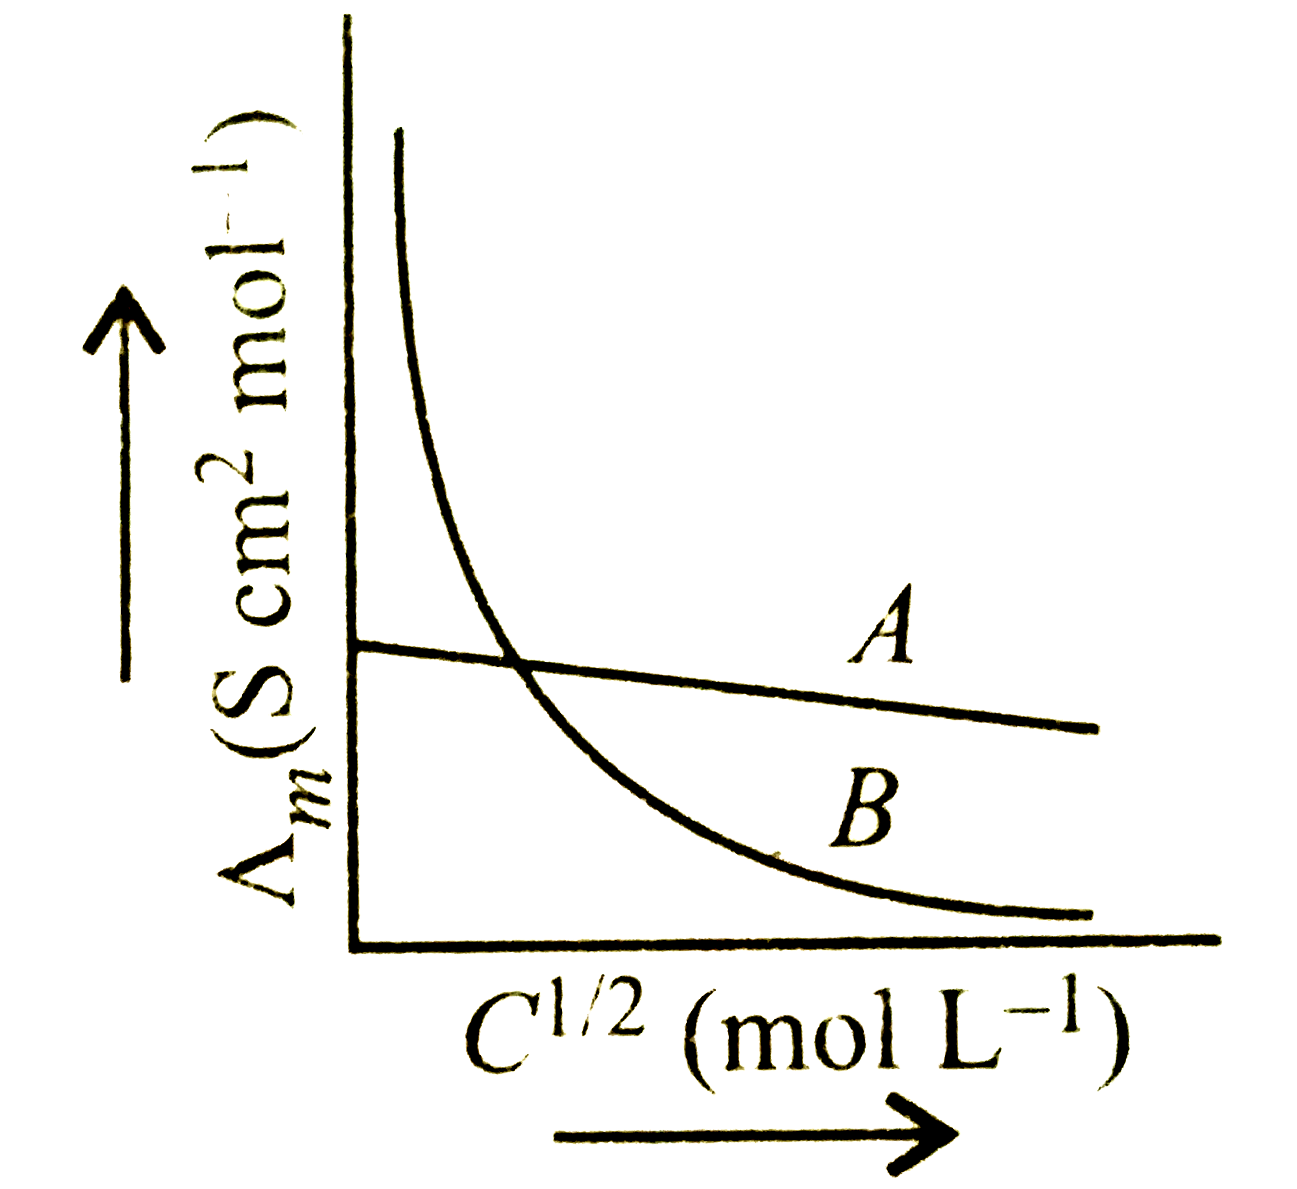
A →NH4OH,B→NaCl
A→NH4OH,B→NH4Cl
A→CH3COOH,B→CH3COONa
A→KCl,B→NH4OH
The correct Answer is:D
Step by step video & image solution for Mark the correct choice of electrolytes represented in the graph. by Chemistry experts to help you in doubts & scoring excellent marks in Class 12 exams.
Updated on:21/07/2023Topper's Solved these Questions
- ELECTROCHEMISTRYBOOK - NCERT FINGERTPS ENGLISHCHAPTER - ELECTROCHEMISTRYEXERCISE - HOTS
10 Videos
- ELECTROCHEMISTRYBOOK - NCERT FINGERTPS ENGLISHCHAPTER - ELECTROCHEMISTRYEXERCISE - EXEMPLAR PROBLEMS
17 Videos
- COORDINATION COMPOUNDS BOOK - NCERT FINGERTPS ENGLISHCHAPTER - COORDINATION COMPOUNDS EXERCISE - Assertion And Reason
15 Videos
- GENERAL PRINCIPLES AND PROCESSES OF ISOLATION OF ELEMENTSBOOK - NCERT FINGERTPS ENGLISHCHAPTER - GENERAL PRINCIPLES AND PROCESSES OF ISOLATION OF ELEMENTSEXERCISE - Assertion And Reason
15 Videos
Similar Questions
Knowledge Check
Study the charactristics of a population represented in the graphs below.
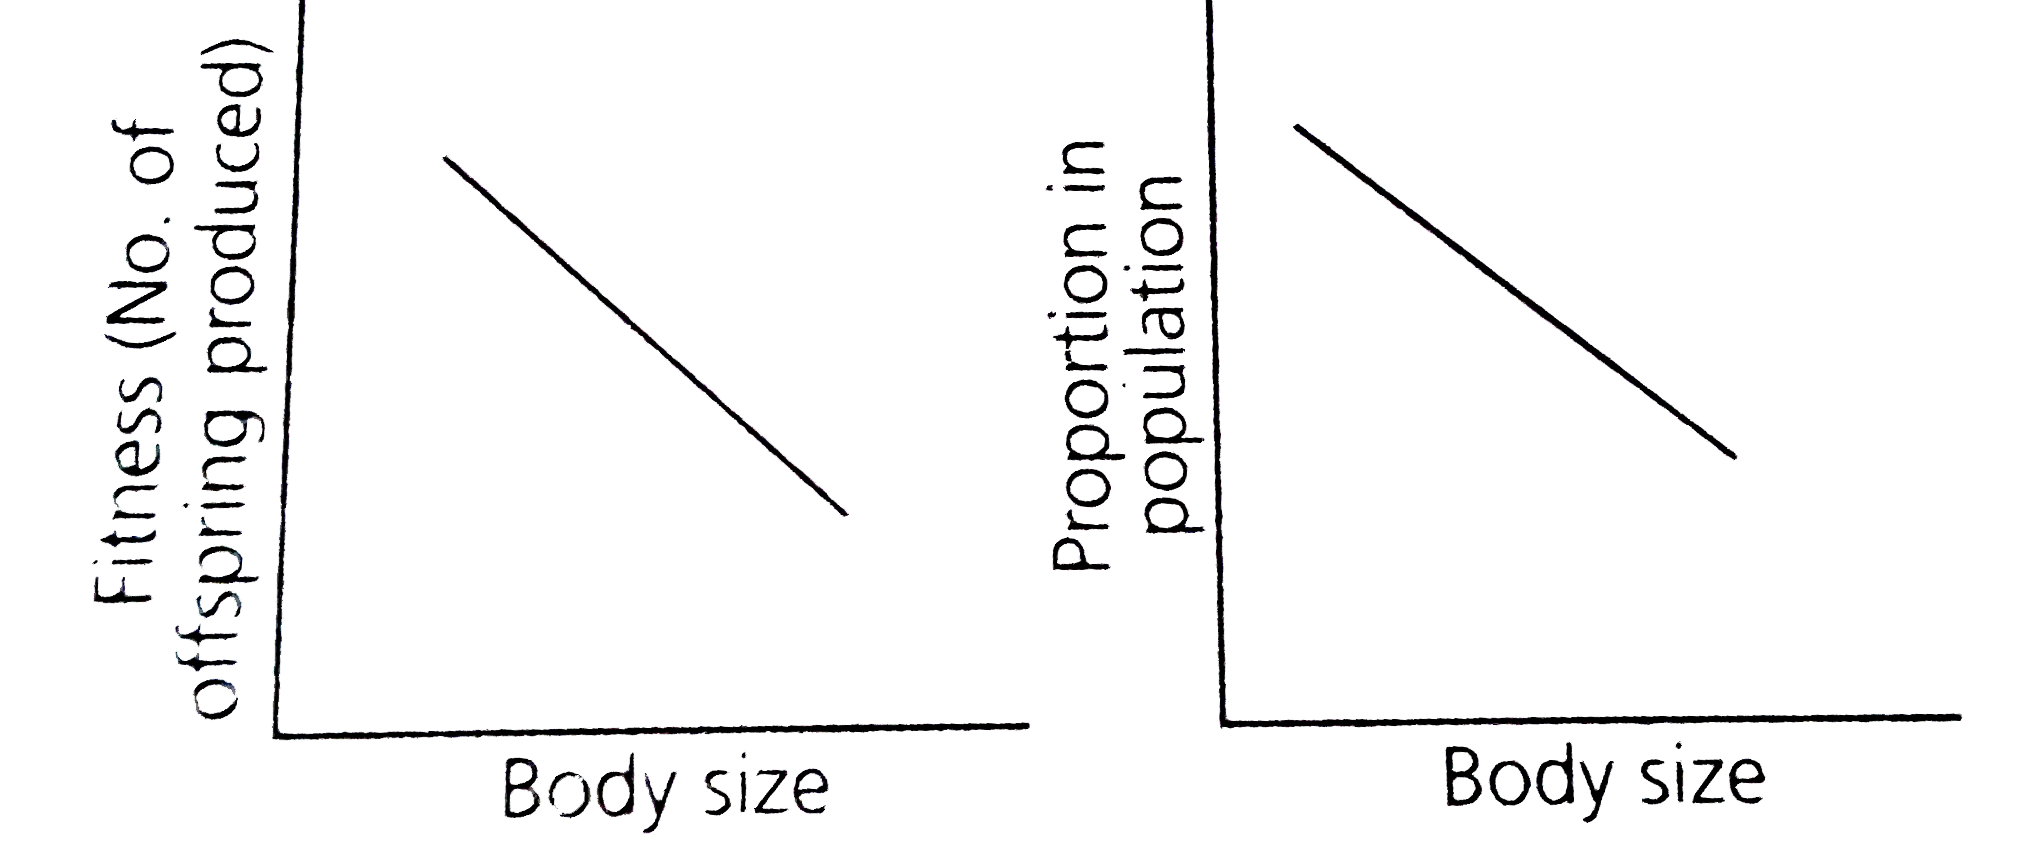
Mark the correct graph that represents the type of selection that this population is likely to undergo
 ADirectional selectionBStablising selectionCDisruptive selectionDBalancing selection
Study the charactristics of a population represented in the graphs below.

Mark the correct graph that represents the type of selection that this population is likely to undergo
 A
A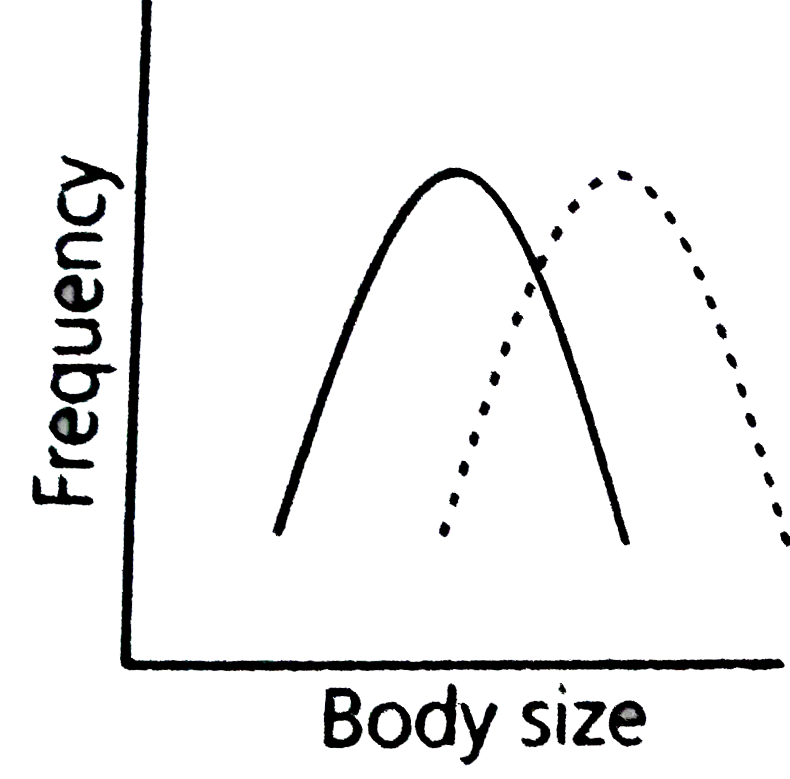 B
B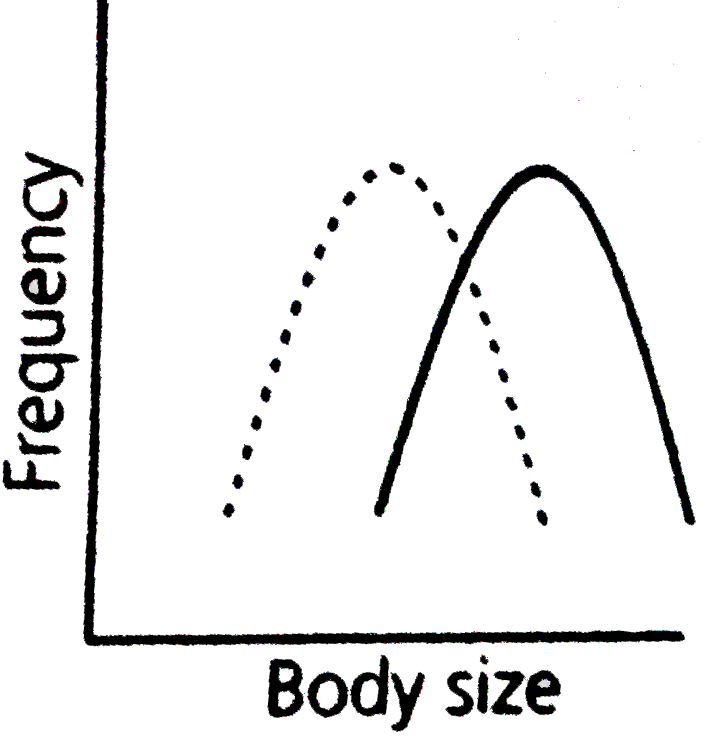 C
C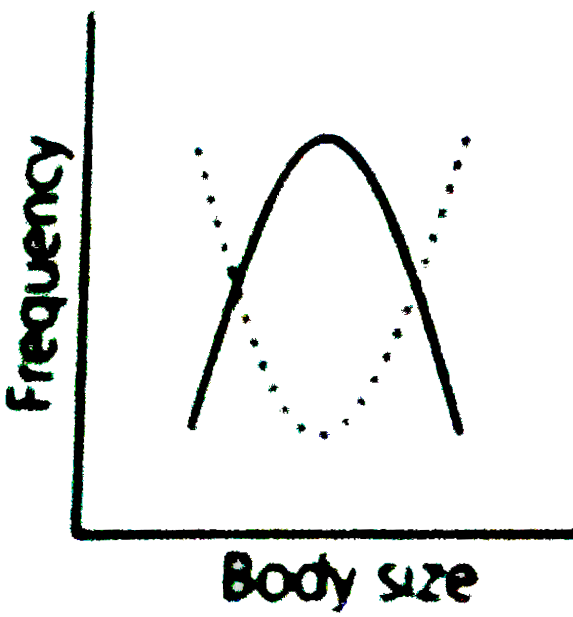 D
D
Multiple choice questions (MCQs)
choose the correct option
Which of the following represents a condition where the mortility of sperms is highly reduced?AAzoospermiaBPolyspermyCOligospermiaDAsthenospermia
The inequality representing the following graph is
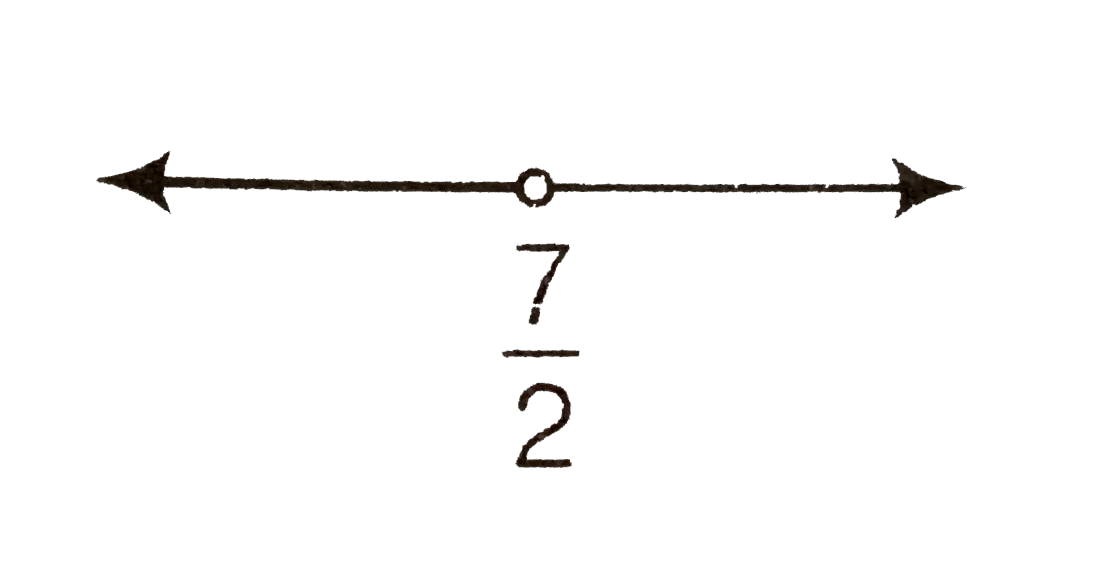
View SolutionThe inequality representing the following graph is
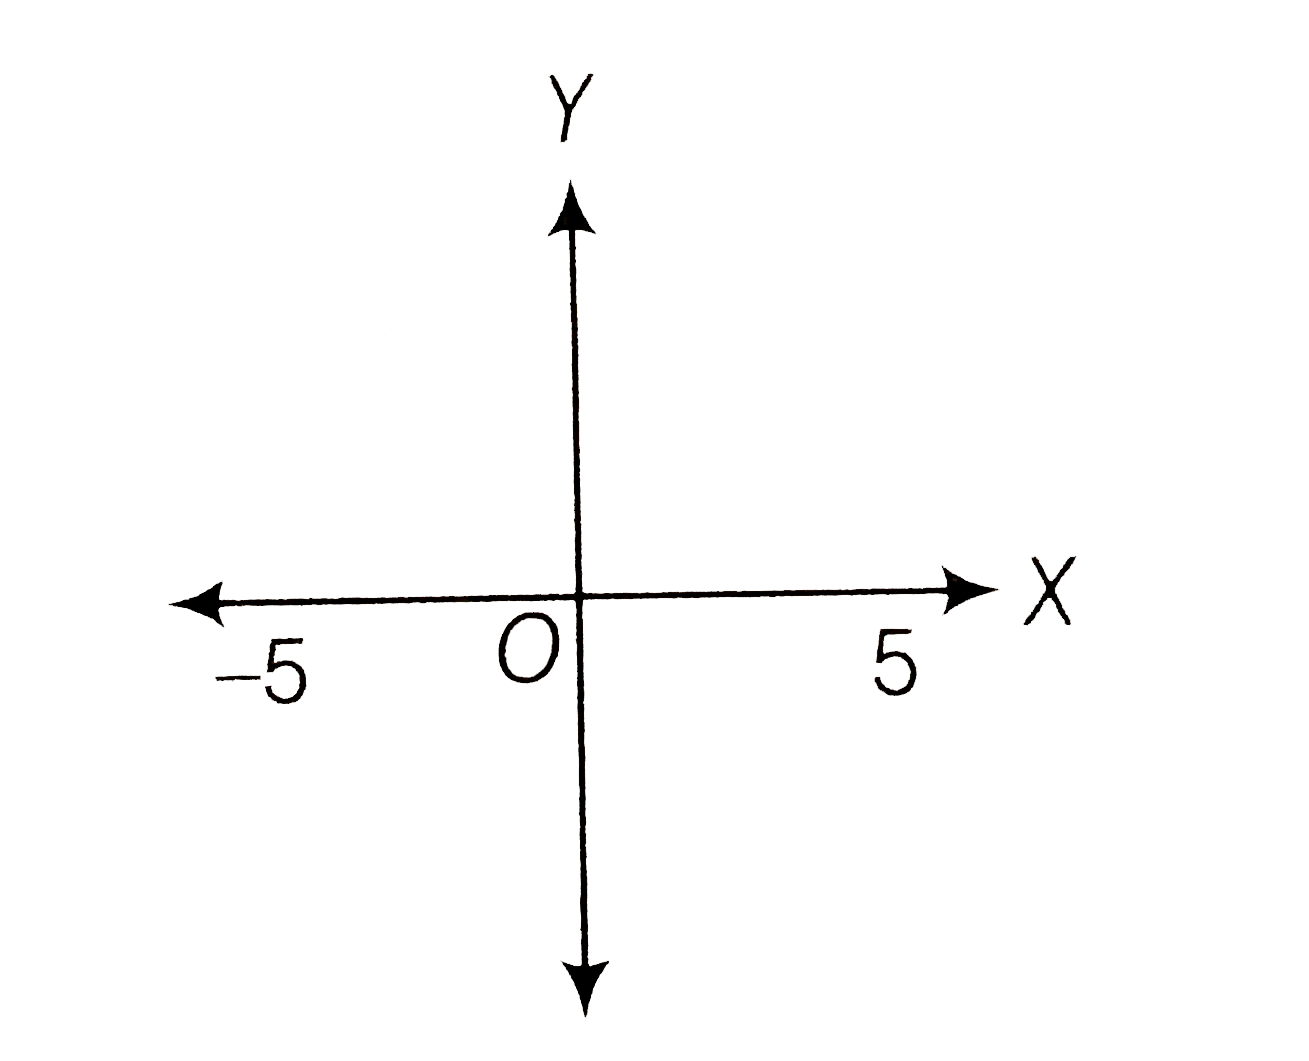
View SolutionThe inequality representing the following graph is
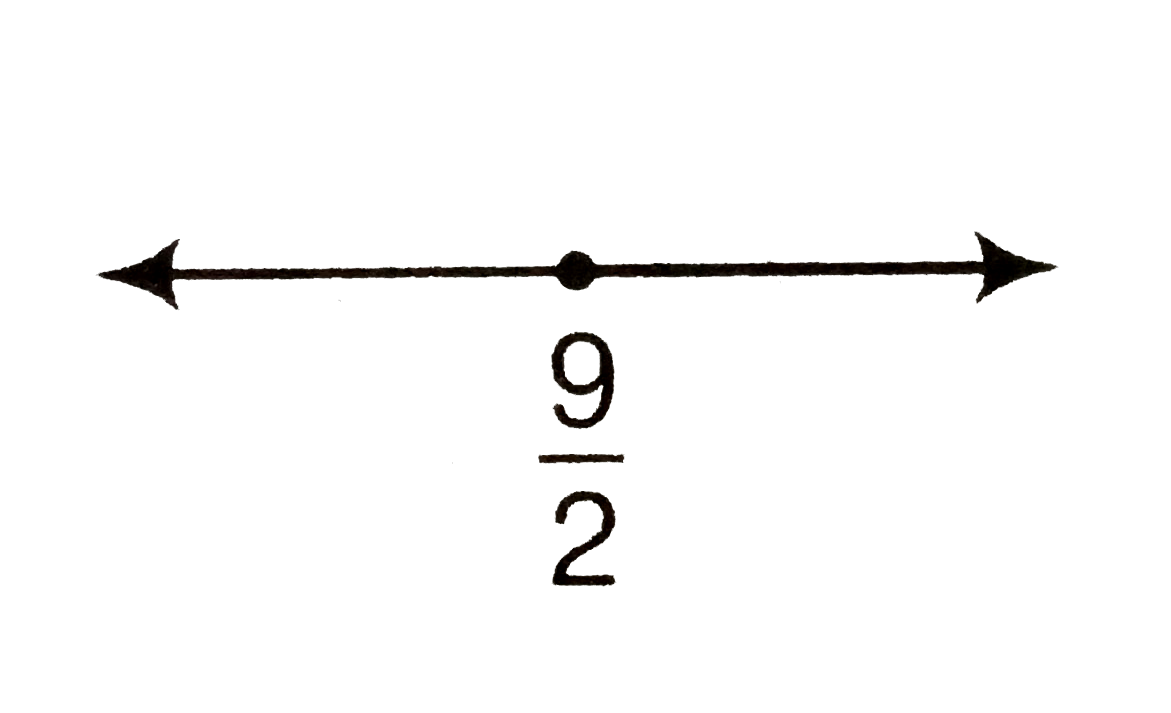
View SolutionMark the correct statement about given graph:

View Solution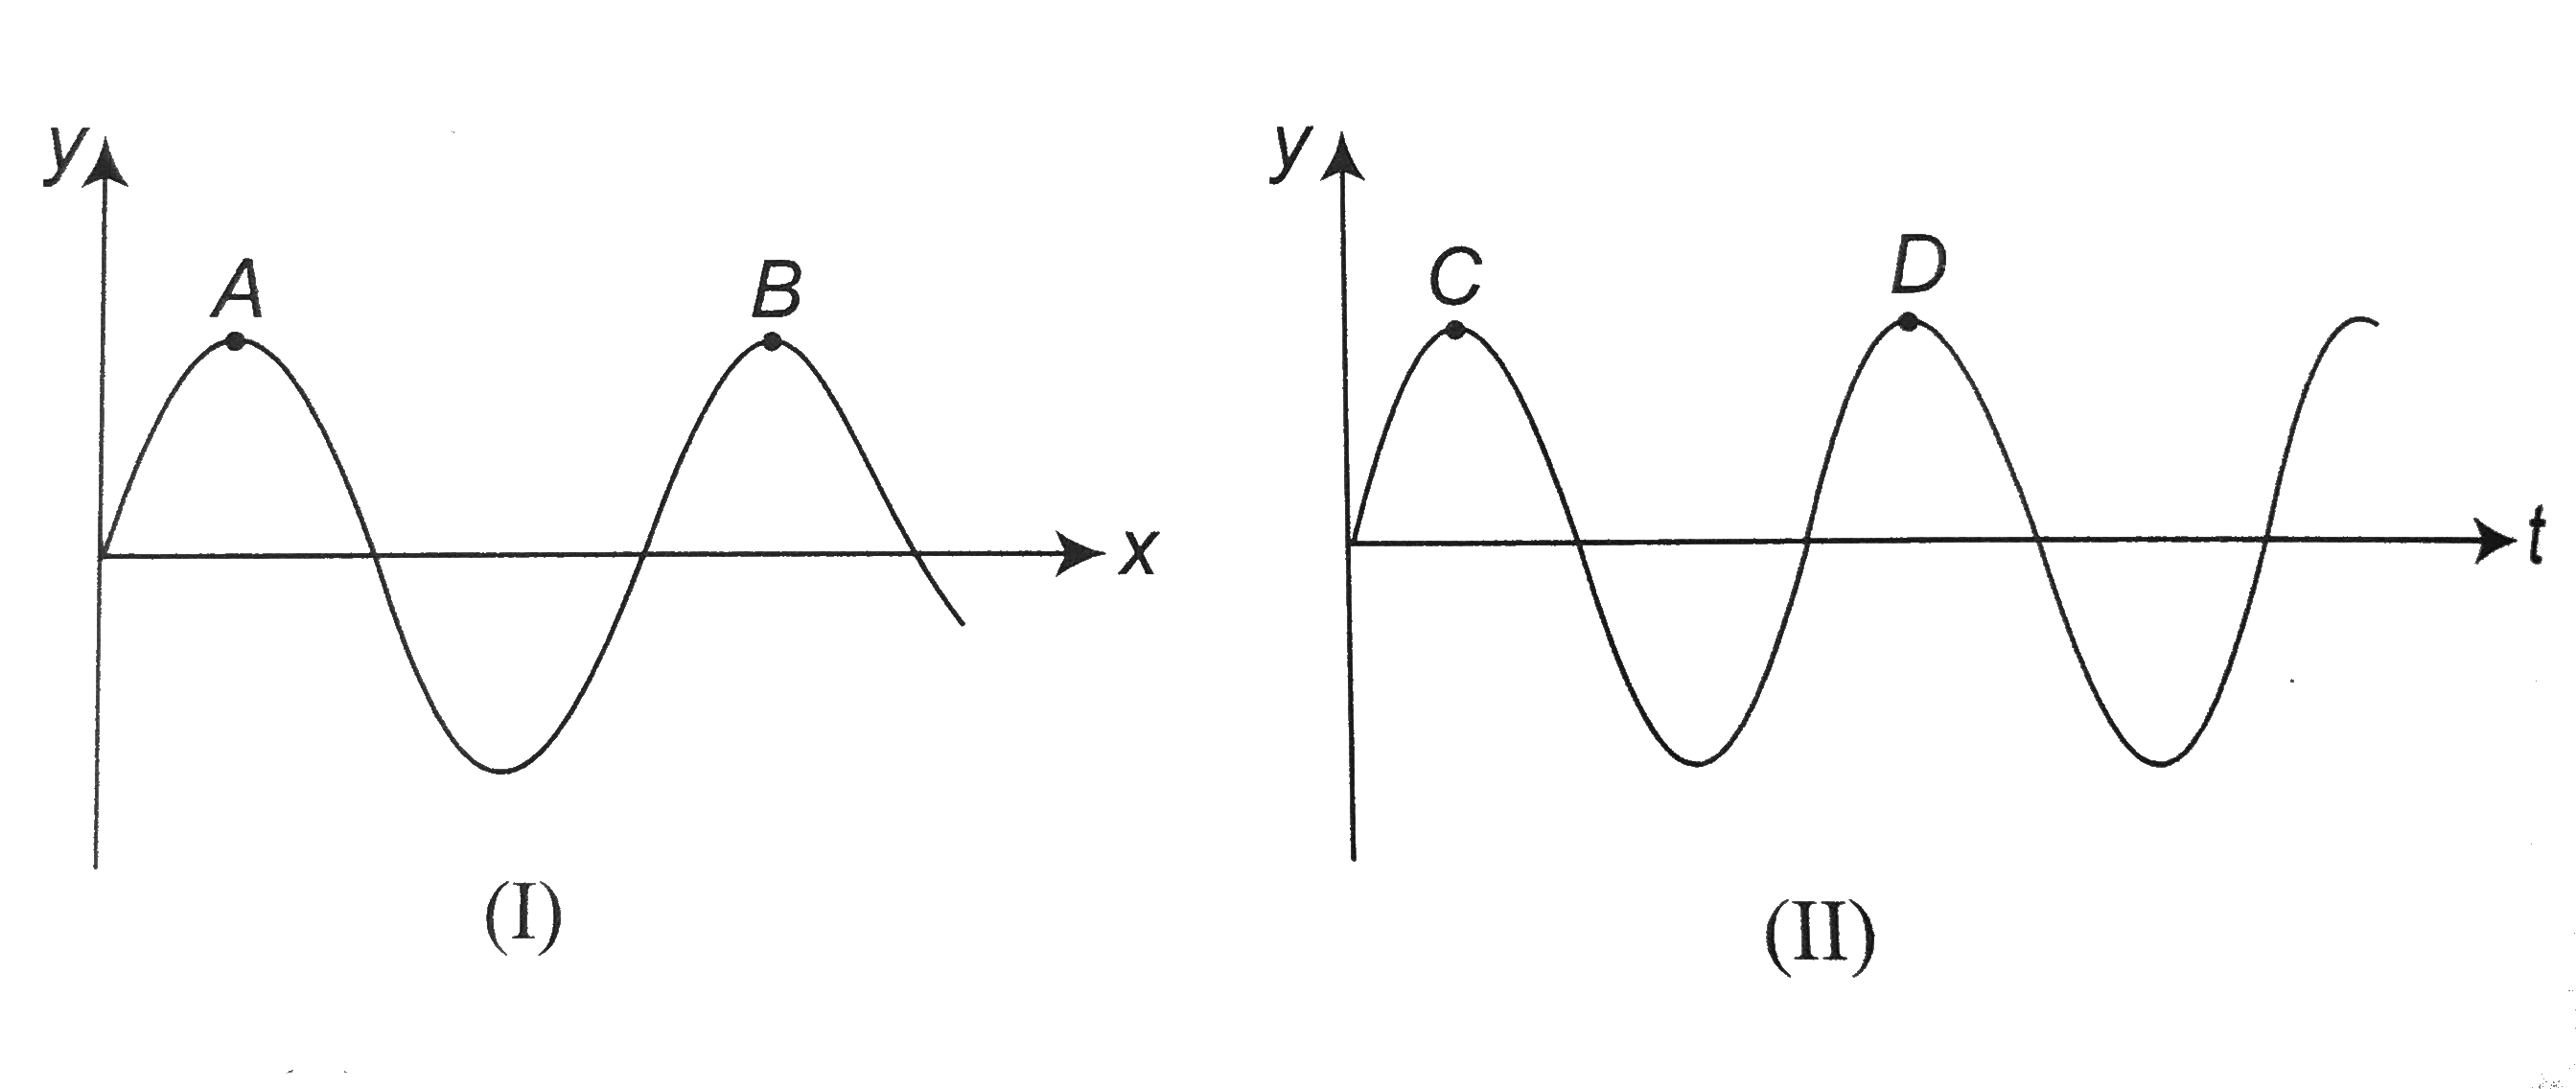
The same progressive wave is represented by two graphs I and II. Graph I shows how the displacement y varies with the distance x along the wave at a given time. Graph II shows how y varies with time t at a given point on the wave. The ratio of measurements AB to CD, marked on the curves represents:
View Solution
