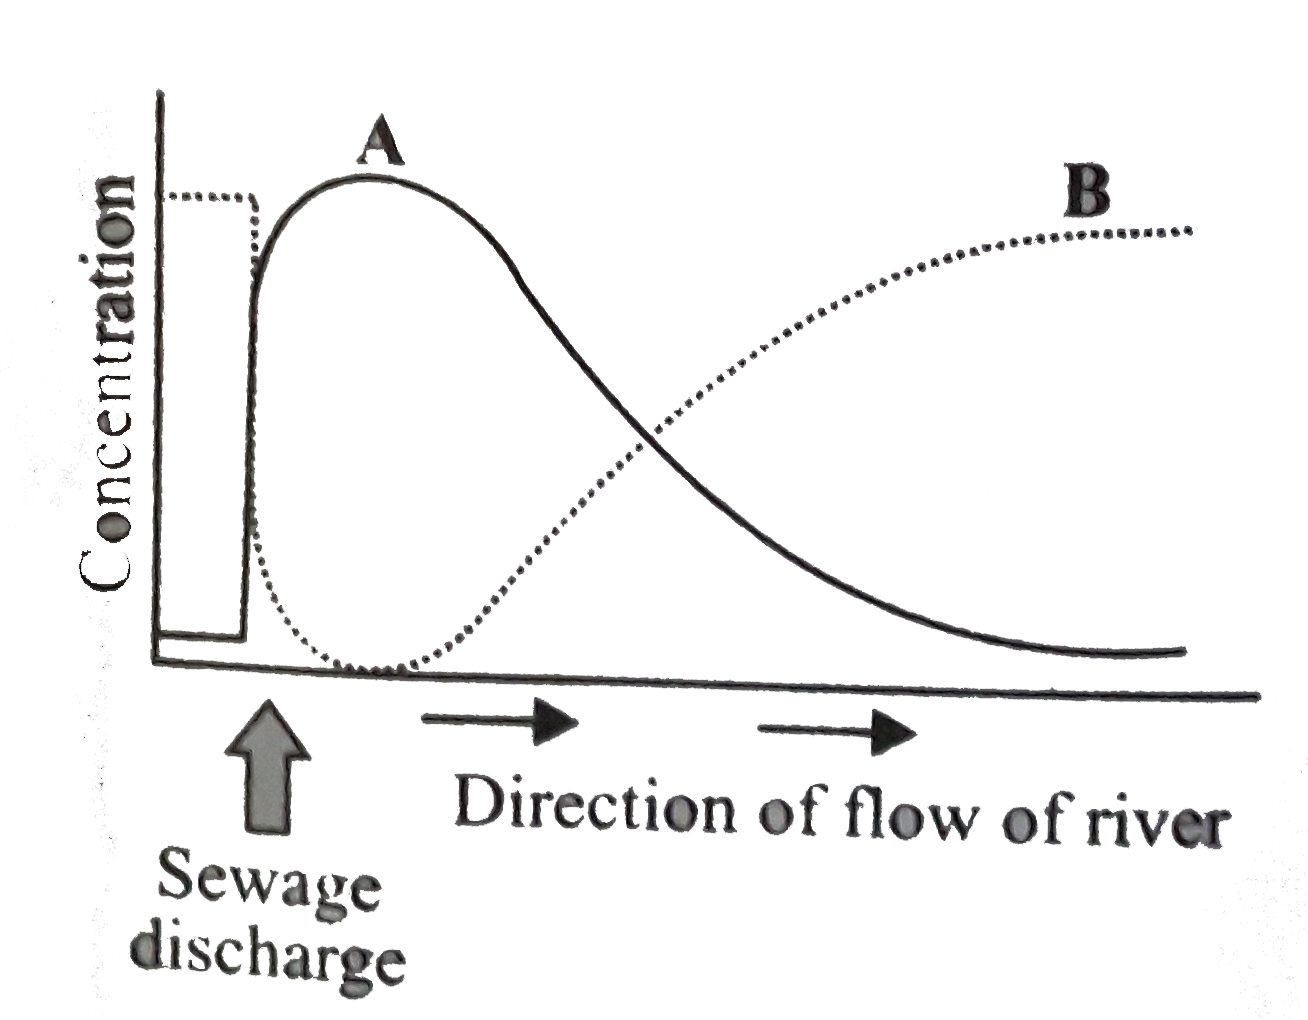
The graph given below represents changes in different ecological parameters due to effluent mixing in a stream. The three lines A, B anc C represent
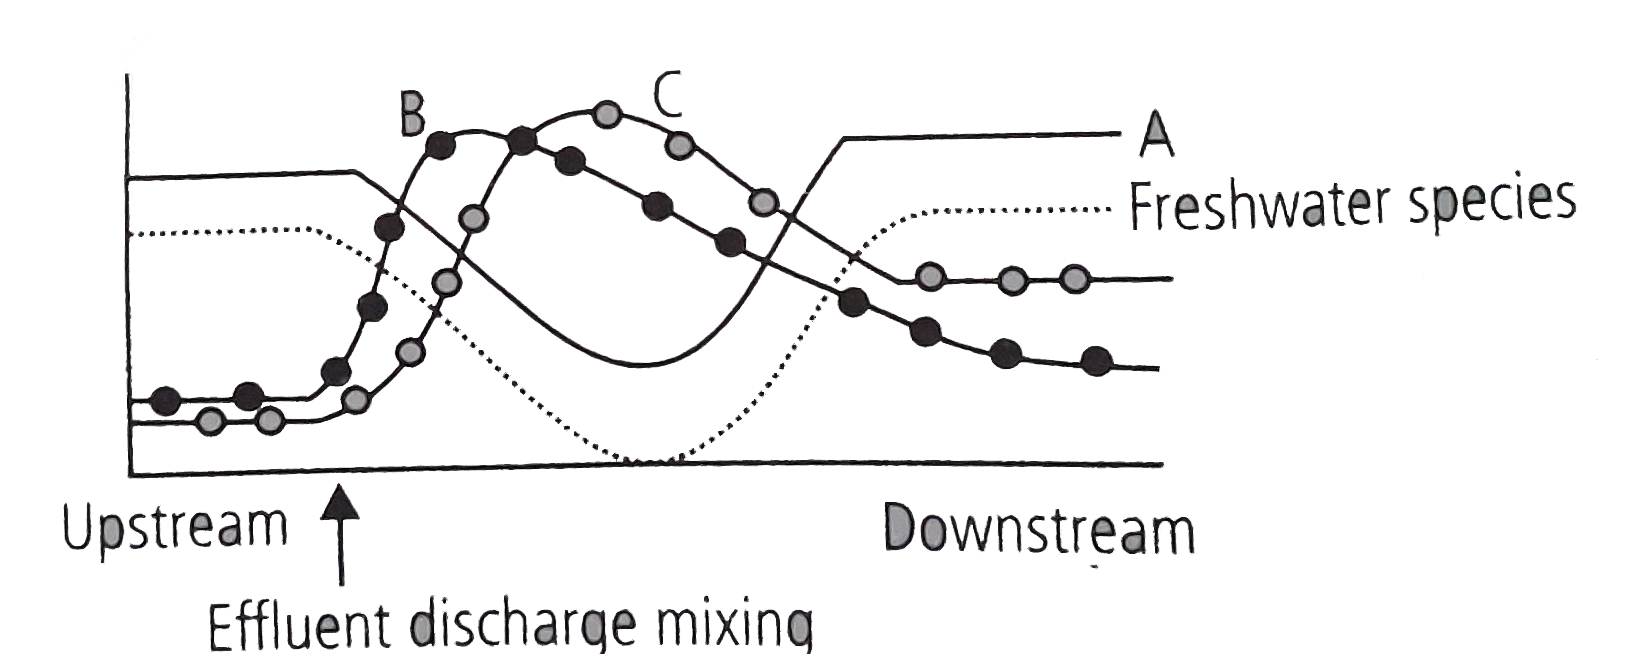
A: oxygen concentration
B: biological O2 demand
C: pollution resistant species
A: pollutan
B: aerobic process
C: anaerobic process
A: oxygen concentration
B: CO2 concentration
C: termperature
A: phosphate concentration
B: nitrate concentration
C: rate of photosynthesis.
The correct Answer is:A
Effluent discharge mixing into a river will result in rise of BOD because decomposer organisms consume a lot of oxygen. If sewage quantity is large, the whole of dissolved oxygen may be consumed leaving nothe for respiration of fish and other clean water organisms. They, therfore, get killed. However, as sewage is decomposed, there is a gradual rise in dissolved oxygen downstream. Fish and other clean water organisms reappear indicating the recovery of river from sewage pollution. Meanwhile, number of pollution resistant species increases in the stream.
Topper's Solved these Questions
Similar Questions
Knowledge Check
- Question 1 - Select One
The diagram given below represents a section of small intestinal mucosa. Identify A,B and C
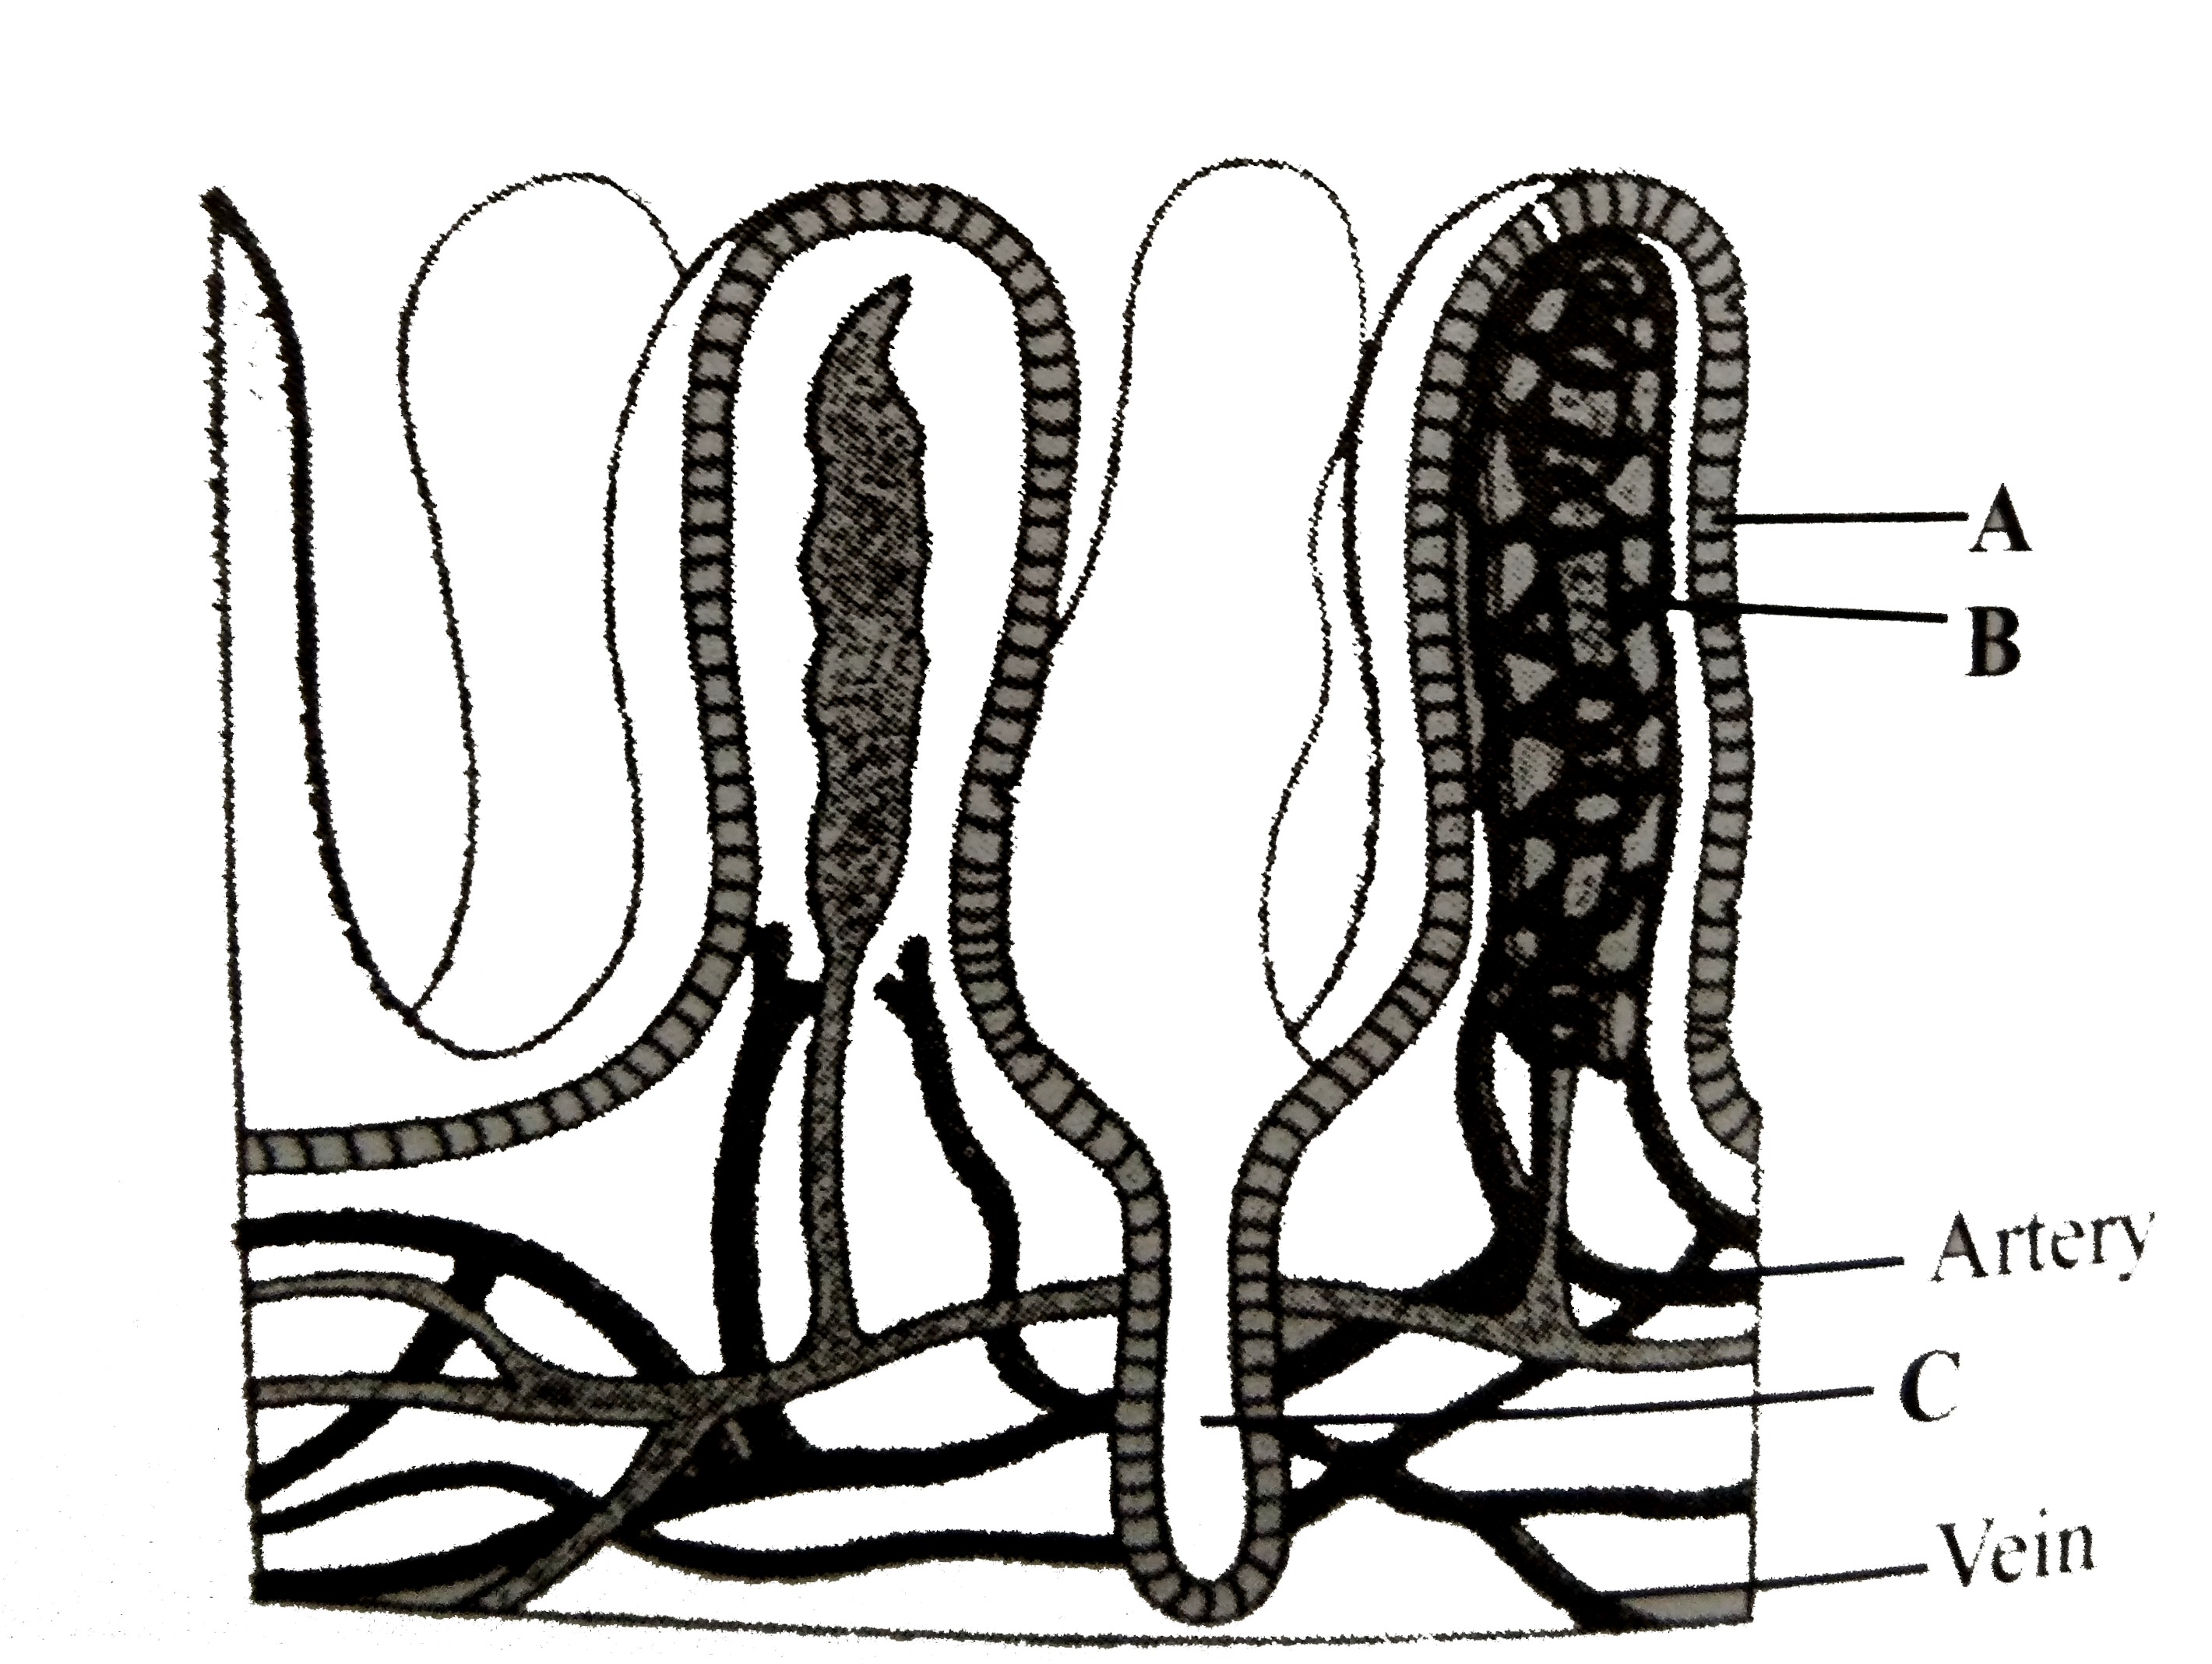 AA-Villi,B-Lacteal, C-CapillariesBA-Lacteal,B-Villi,C-CapillariesCA-Villi,B-Lacteal,C-CryptsDA-Crypts,B-Lacteal,C-Capillaries
 - Question 2 - Select One
Explain the changes that can be observed in the characteristics of river water when sewage is discharged into it and a few weeks after the discharge with respect to :
(i) level of dissolved oxygen (ii) population of fresh water organisms.APeak A- Sharp increase in BOD, disappearance of clean water organisms
Peak B- Increase in dissolved oxygen, reappearance of clean water organismsBPeak A- Increase in dissolved oxygen, reappearance of cleanwater organisms
Peak B- Sharp increase in BOD, appearance of clean water organismsCPeak A- Sharp increase in BOD, appearance of clean water organisms
Peak B- Increased number in dissolved oxygen, disappearance of clean water organismsDPeak A- Increased number of anaerobic bacteria, disappearance of clean water organisms
Peak B- Sharp decline in dissolved O2, reappearance of clean water organisms
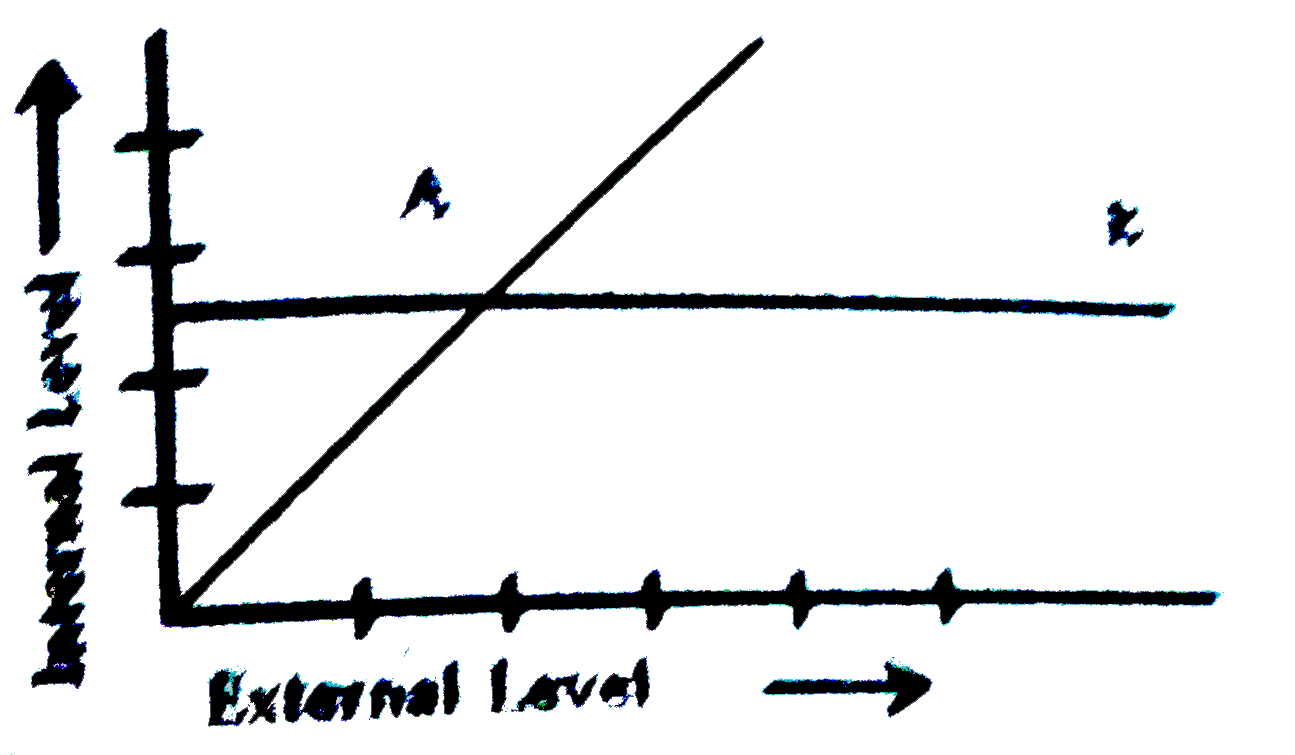
(a) The graph given below represents the organisms response to temperature as an environmental condition.
(i) Which one of the two lines represents conformers and why ?
(ii) What does the other line in the graph represent and why ?
(b) Mention the different adaptations the parasites have evolved with, to be able to successfully complete their life cycles in their hosts.
 View Solution
Given below are the seats won by different political parties in the polling outcome of a state assembly elections: (i) Draw a bar graph to represent the polling result
View SolutionThe graph given below represents the effect of sewage discharge on some important characteristics of river.
Select the correct option with respect to the peaks A and B.
 View Solution
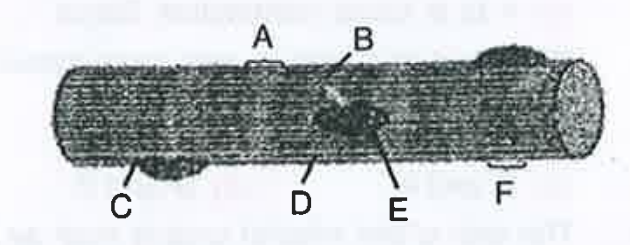
The diagram given below represents the histology
of a stripped muscle . Label the parts A, B, C, D, E and F.
 View Solution
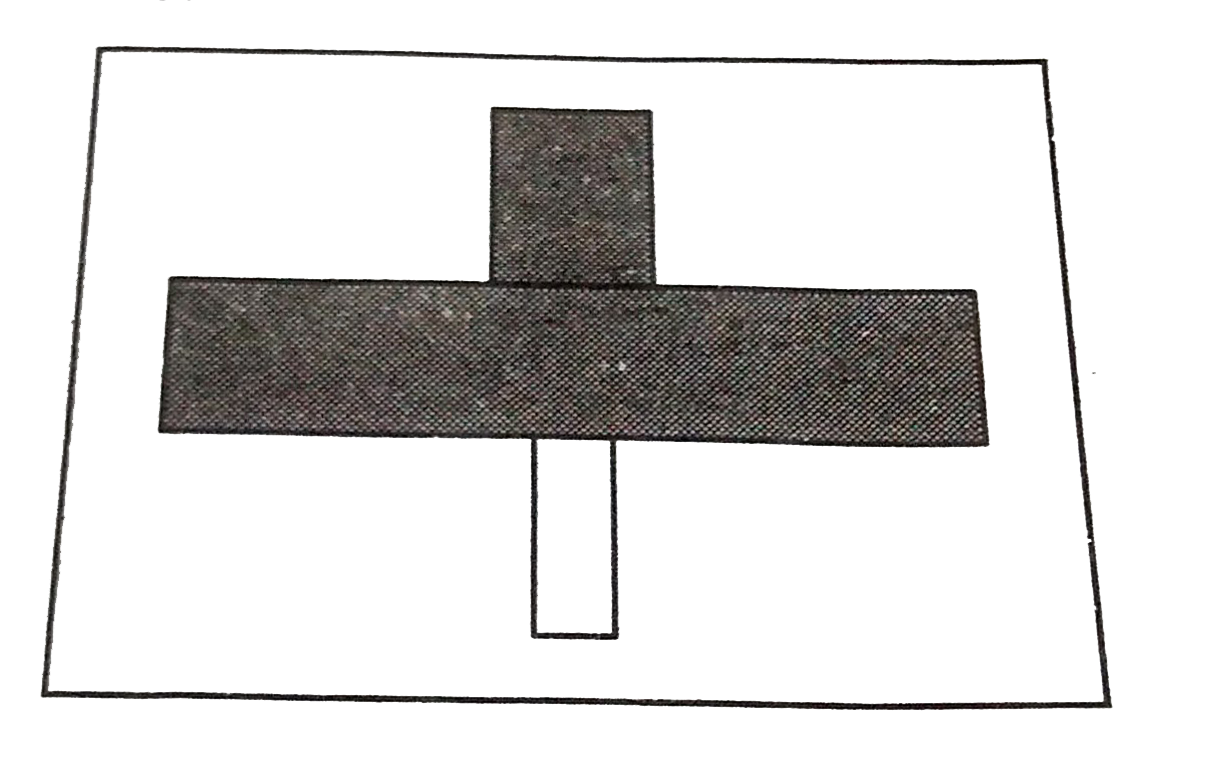
Given below is one of the types of ecological pyramids. This type represents:
 View Solution
The graph given below represents the effect of sewage discharge of some important characteristics of river
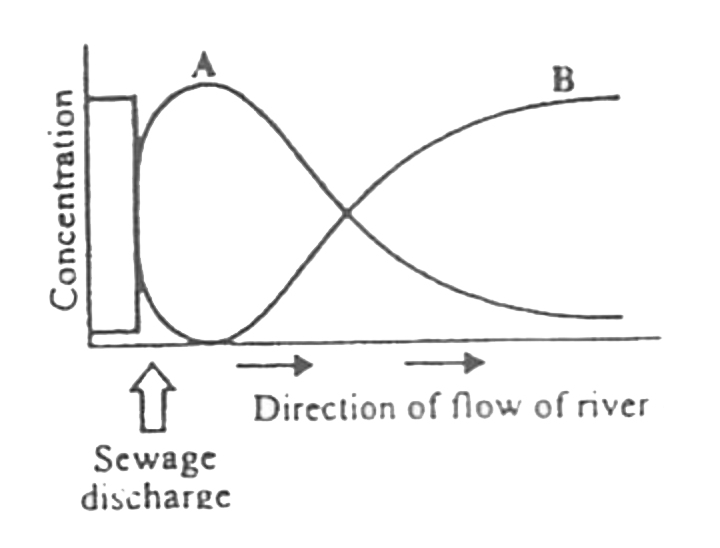
Select the CORRECT option with respect to peaks A and B.View Solution

