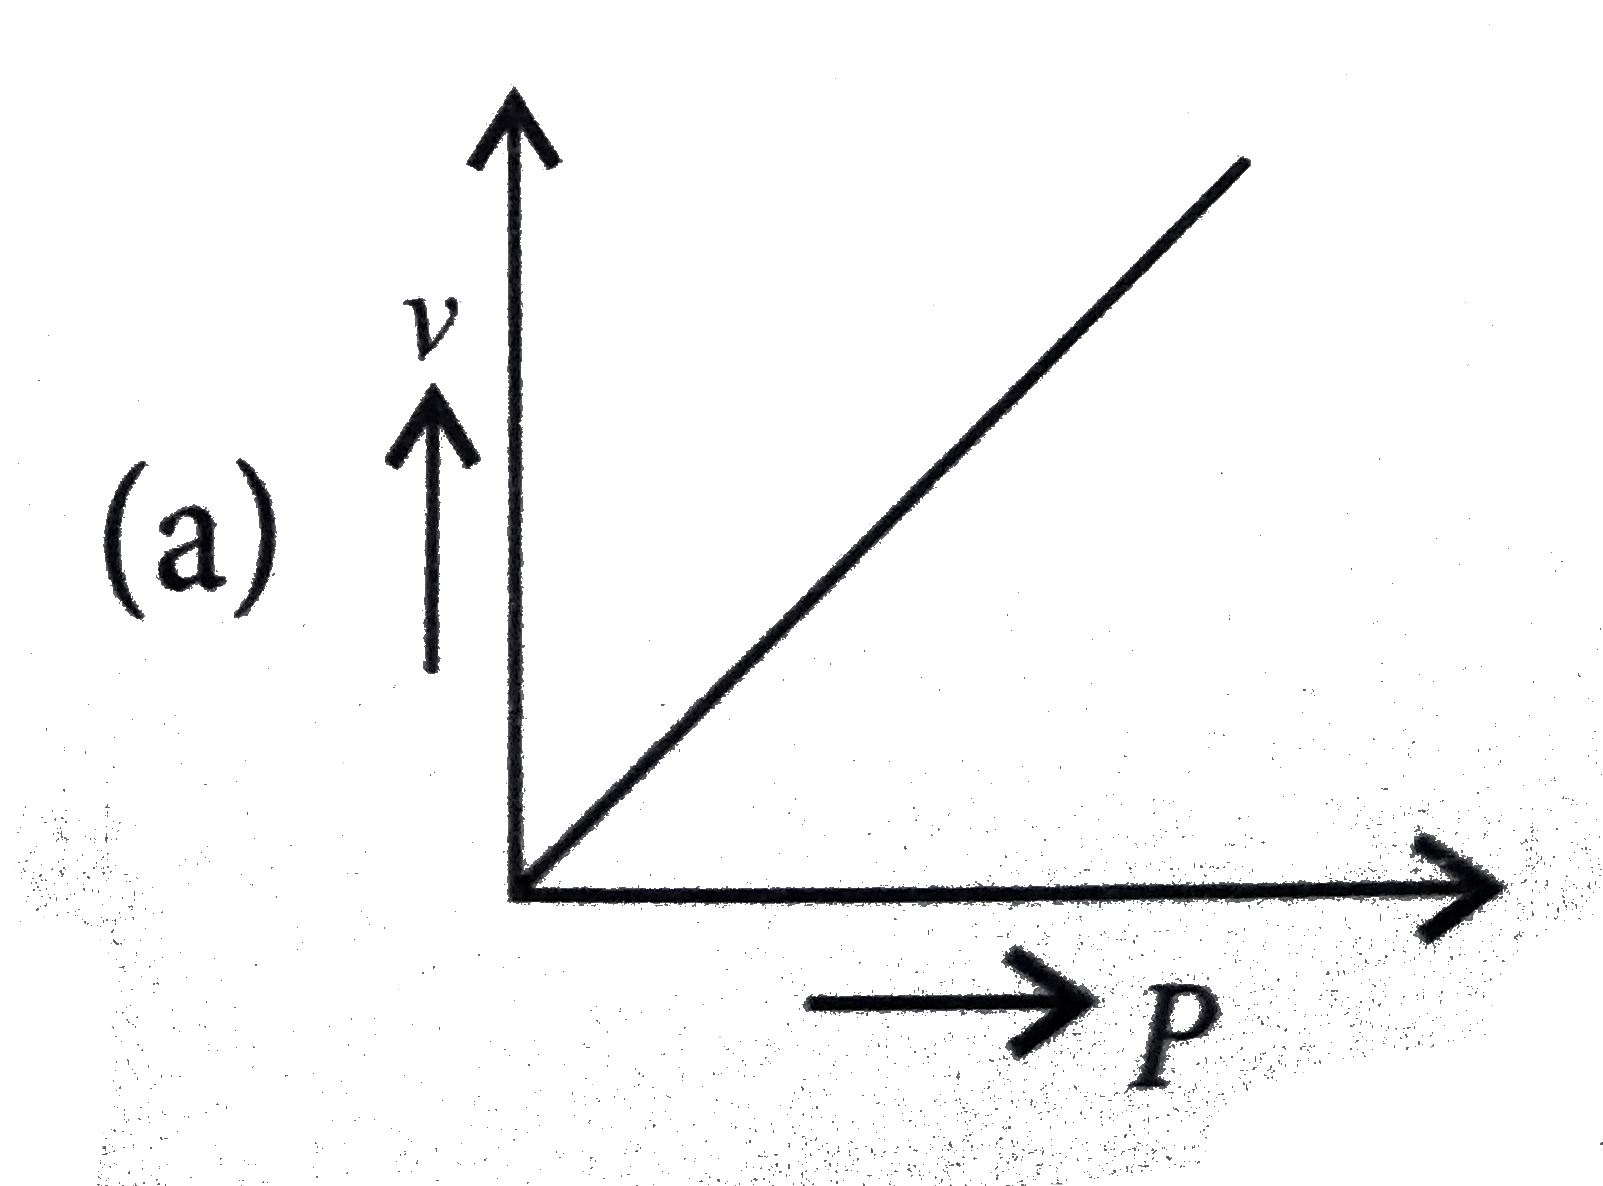
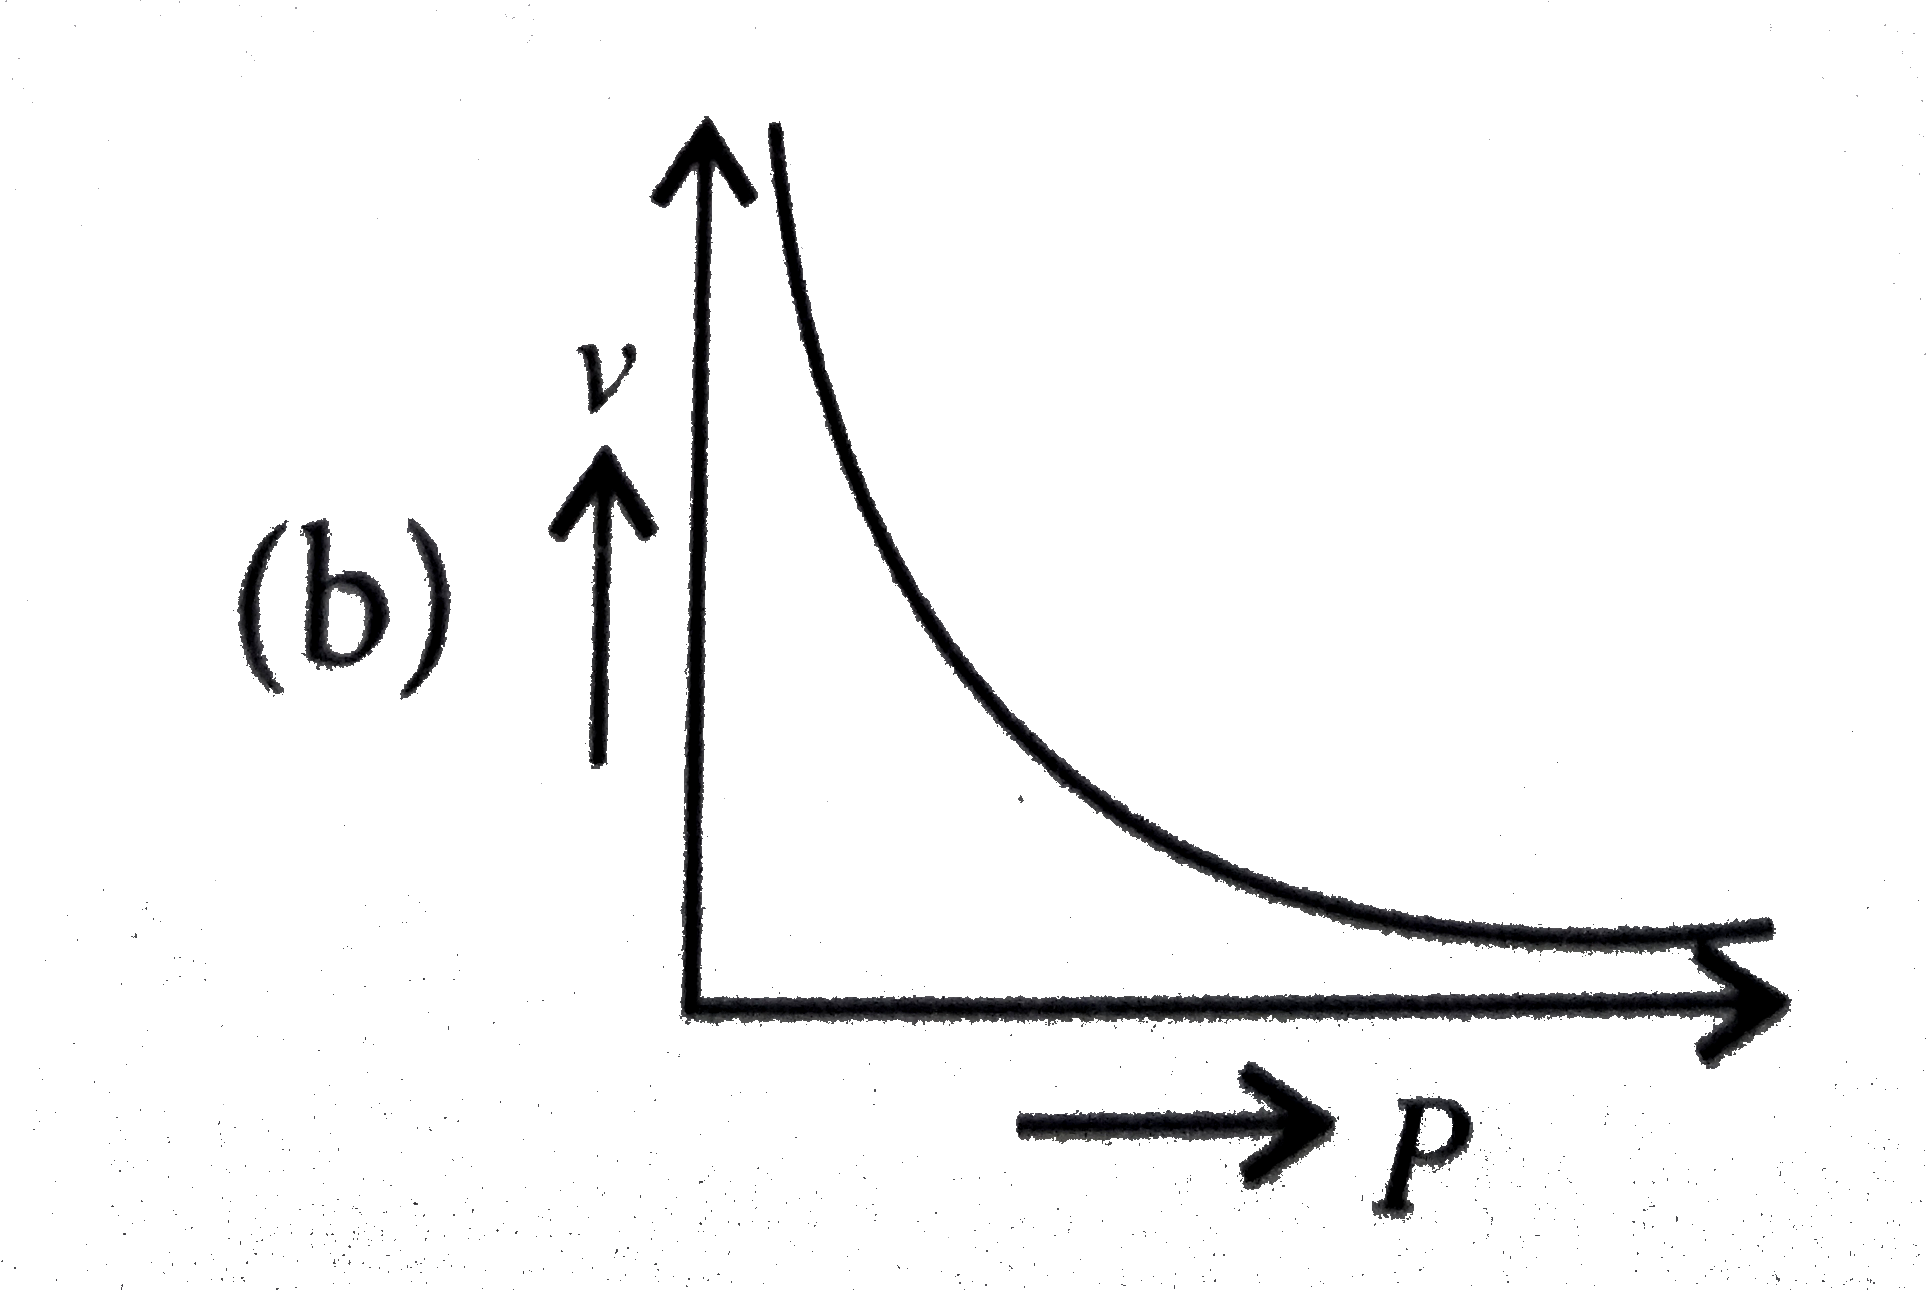
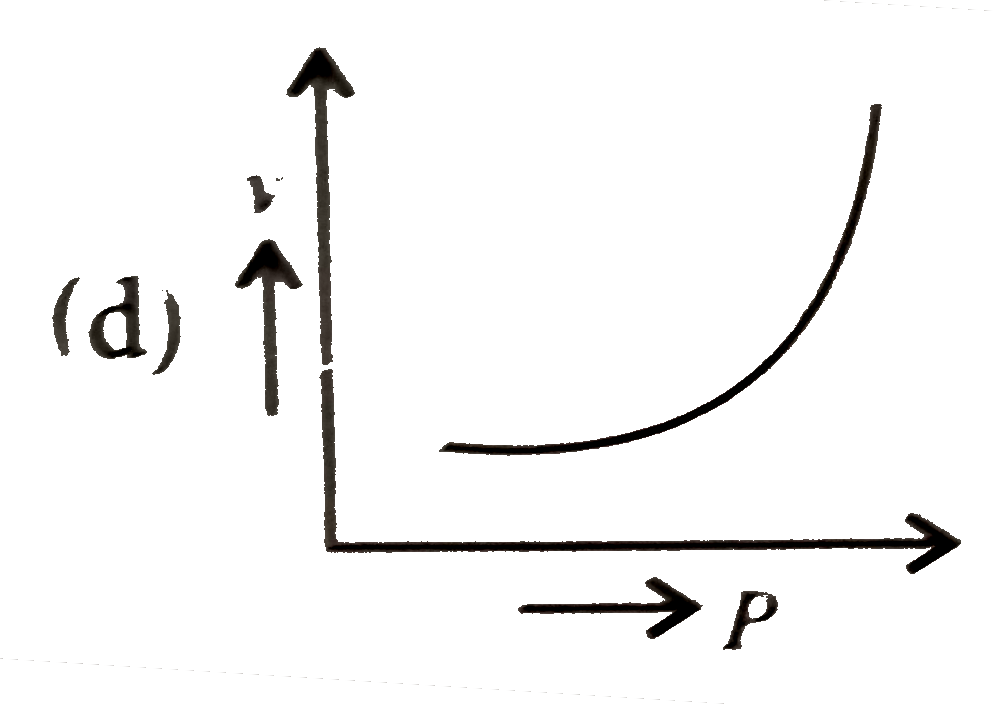
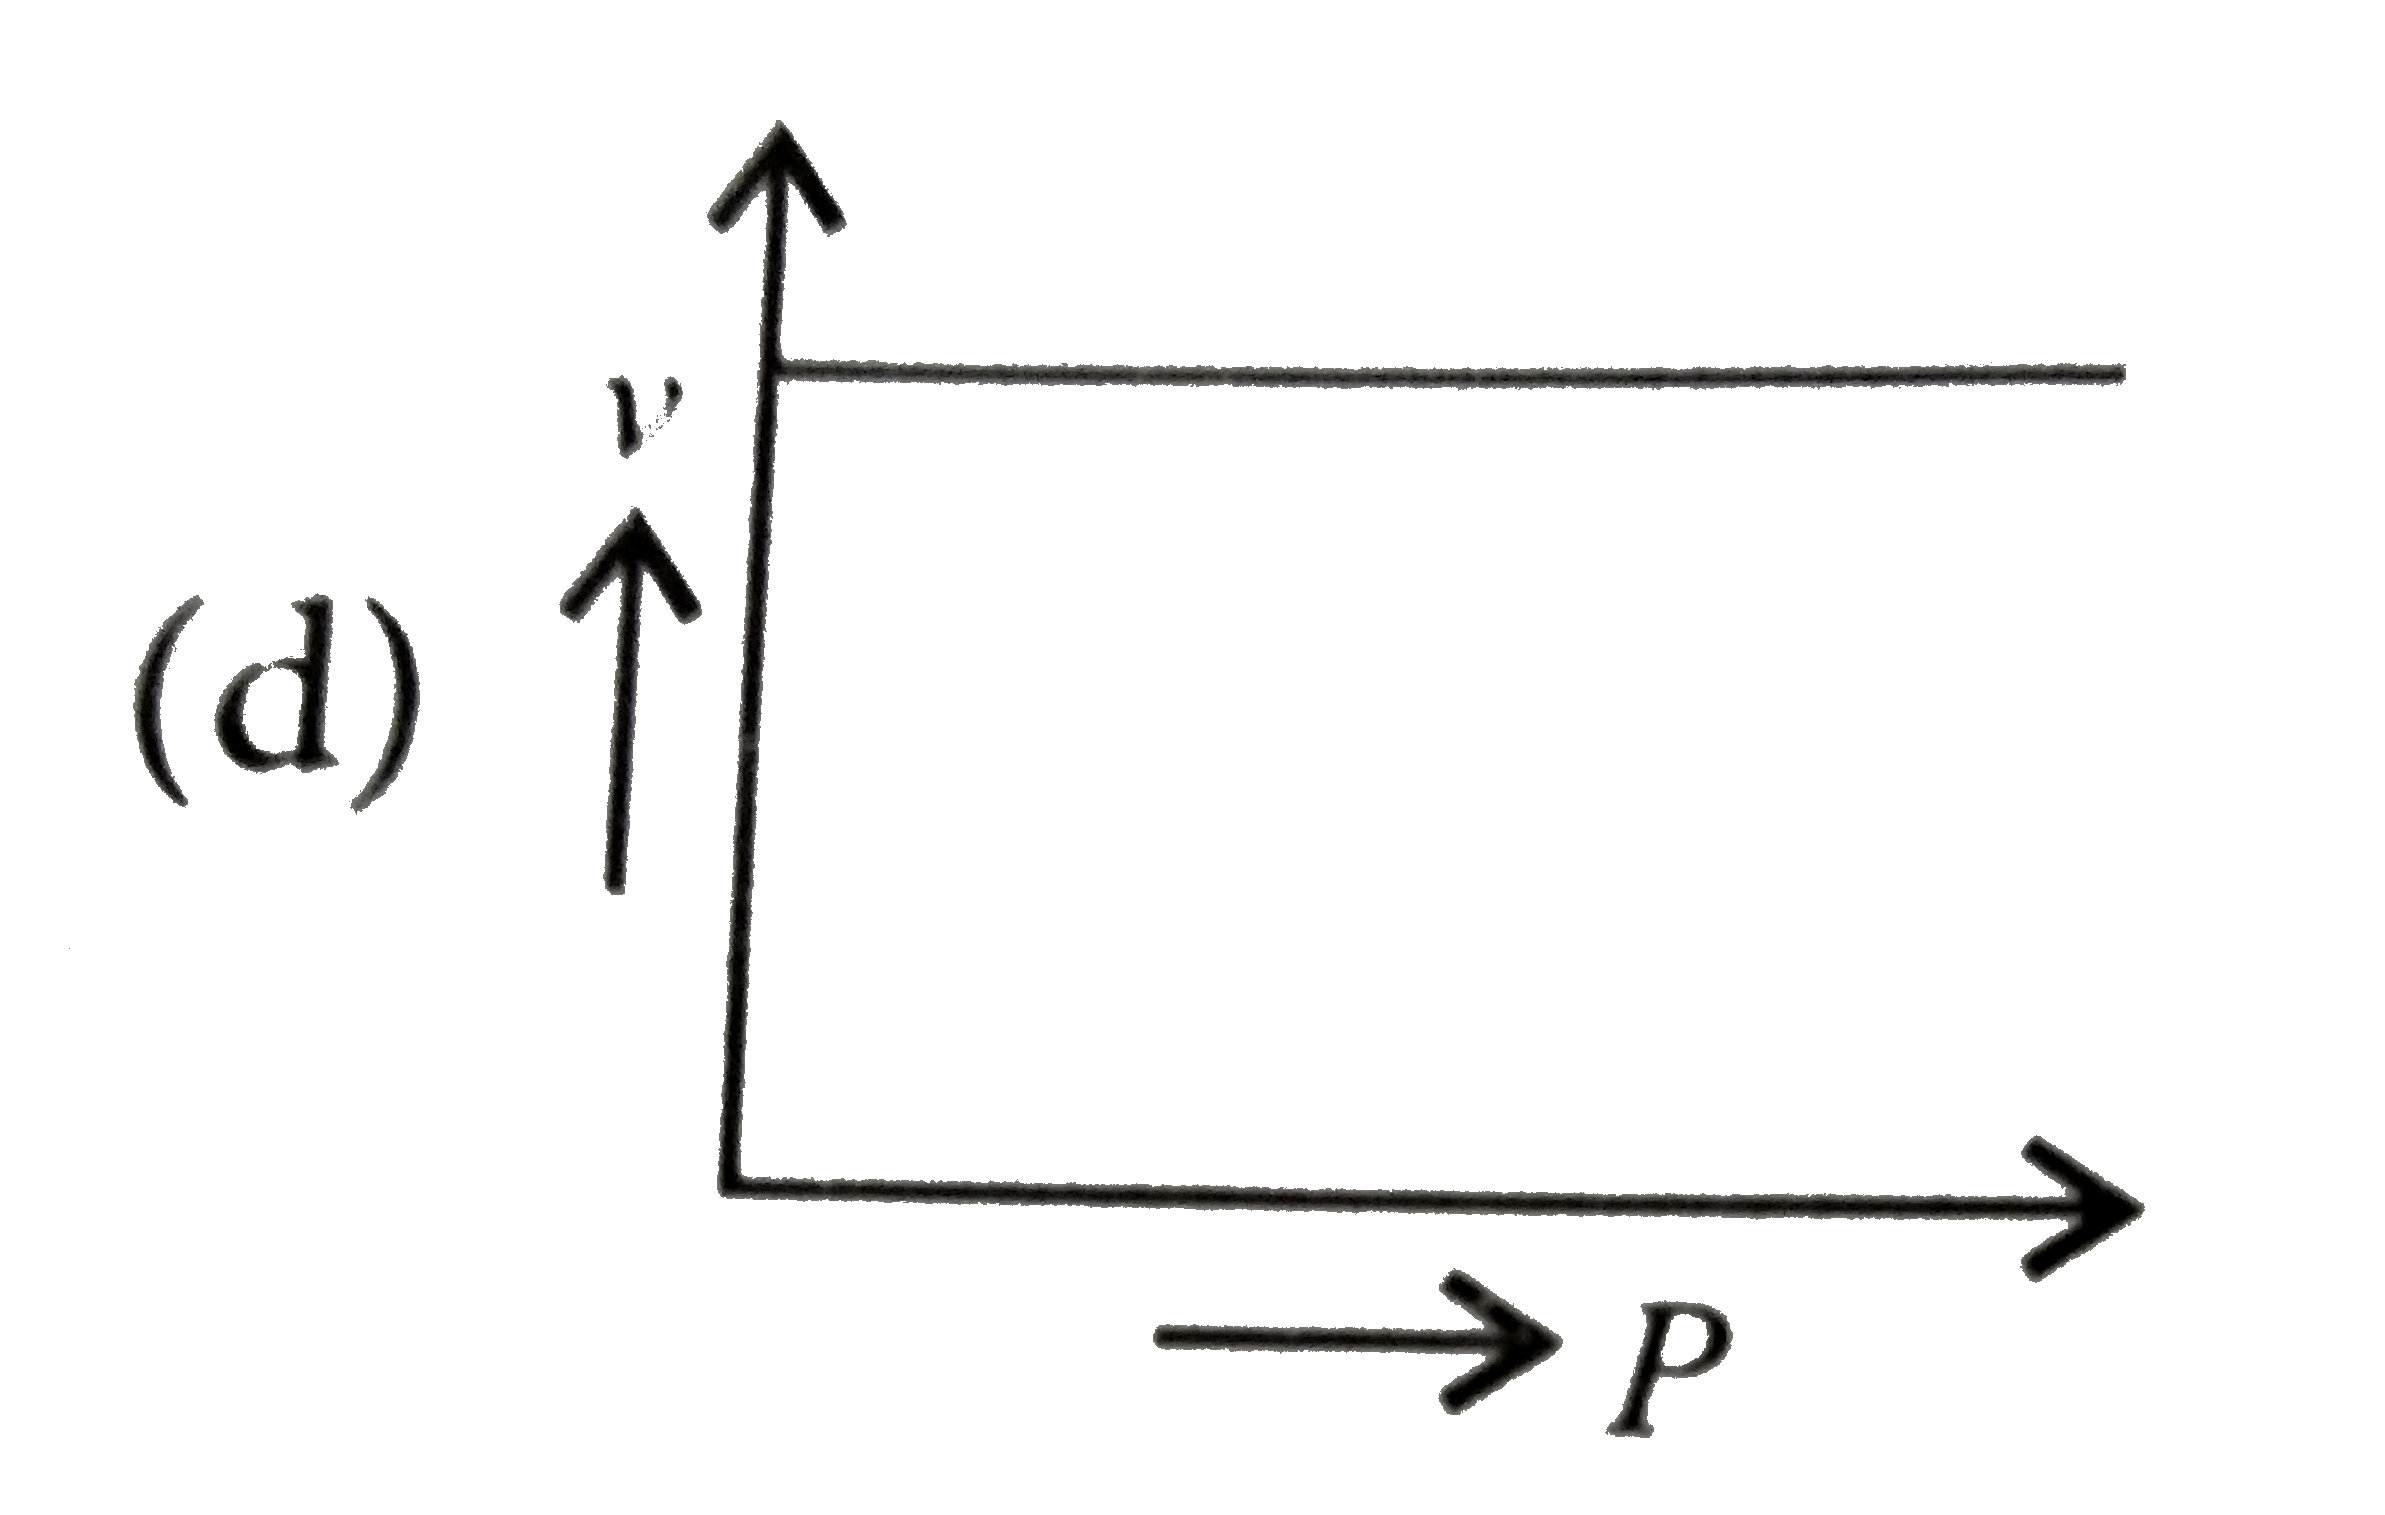
A student plotted the following four graphs representing the variation of velocity of sound in a gas with the pressure P. Whic one is correct?
The correct Answer is:D
To determine the correct graph representing the variation of the velocity of sound in a gas with pressure, we can follow these steps:
Step 1: Understand the relationship between velocity of sound, pressure, and density
The speed of sound v in a gas is given by the formula:
v=√γPρ
where:
- γ is the adiabatic index (constant for a given gas),
- P is the pressure,
- ρ is the density of the gas.
Step 2: Analyze how pressure and density change
When the pressure P of a gas increases, the density ρ also increases. However, the ratio Pρ remains constant for a given gas under adiabatic conditions. This means that as pressure increases, density increases in such a way that the ratio Pρ does not change.
Step 3: Determine the implication for the speed of sound
Since the ratio Pρ is constant, we can conclude that the speed of sound v does not depend on the pressure P. Therefore, the speed of sound remains constant regardless of changes in pressure.
Step 4: Identify the correct graph
Given that the speed of sound is constant with respect to pressure, the correct graph would be a horizontal line (constant value) indicating that the velocity of sound does not change with pressure.
From the options provided, the graph that represents this constant relationship is:
Option D: A horizontal line indicating constant velocity.
Final Conclusion
The correct answer is Option D, which shows that the velocity of sound in a gas is independent of pressure.
---
The speed of sound v in a gas is given by the formula:
v=√γPρ
where:
- γ is the adiabatic index (constant for a given gas),
- P is the pressure,
- ρ is the density of the gas.
When the pressure P of a gas increases, the density ρ also increases. However, the ratio Pρ remains constant for a given gas under adiabatic conditions. This means that as pressure increases, density increases in such a way that the ratio Pρ does not change.
Since the ratio Pρ is constant, we can conclude that the speed of sound v does not depend on the pressure P. Therefore, the speed of sound remains constant regardless of changes in pressure.
Given that the speed of sound is constant with respect to pressure, the correct graph would be a horizontal line (constant value) indicating that the velocity of sound does not change with pressure.
The correct answer is Option D, which shows that the velocity of sound in a gas is independent of pressure.
Topper's Solved these Questions
- WAVESBOOK - NCERT FINGERTPS ENGLISHCHAPTER - WAVESEXERCISE - HOTS
8 Videos
- WAVESBOOK - NCERT FINGERTPS ENGLISHCHAPTER - WAVESEXERCISE - EXEMPLER
10 Videos
- UNITS AND MEASUREMENTSBOOK - NCERT FINGERTPS ENGLISHCHAPTER - UNITS AND MEASUREMENTSEXERCISE - Assertion And Reason
15 Videos
- WORK , ENERGY AND POWERBOOK - NCERT FINGERTPS ENGLISHCHAPTER - WORK , ENERGY AND POWEREXERCISE - Assertion And Reason
15 Videos
Similar Questions
Knowledge Check
Which of the following graphs represent the behaviour of an ideal gas ?
A1.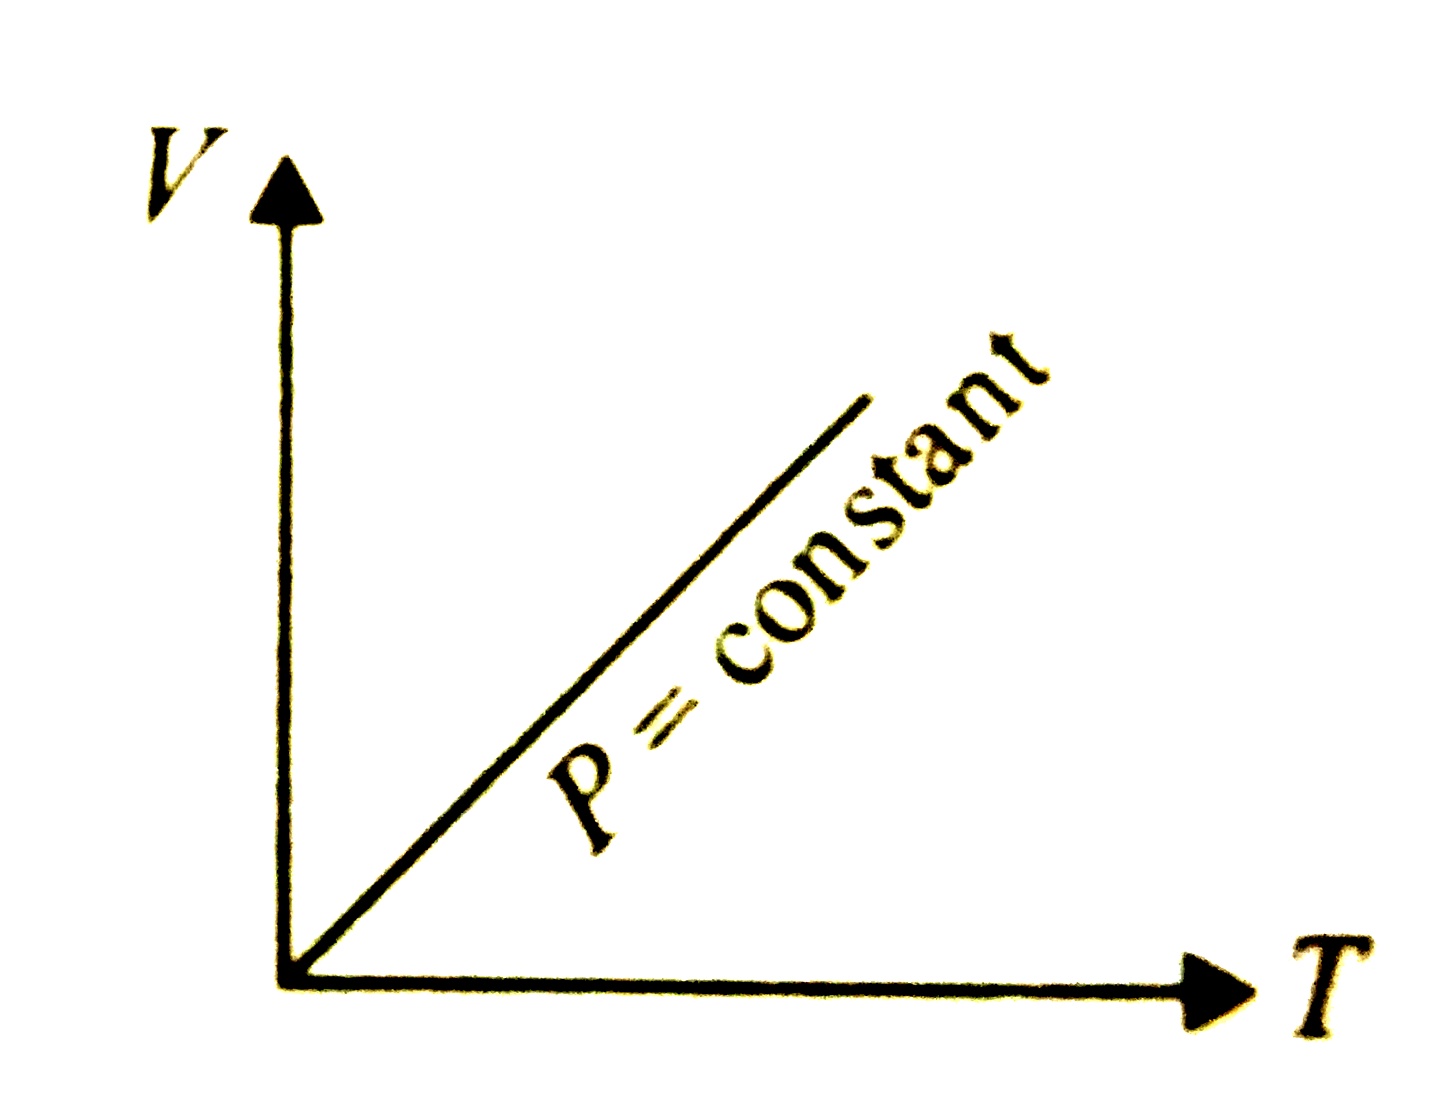 B2.
B2.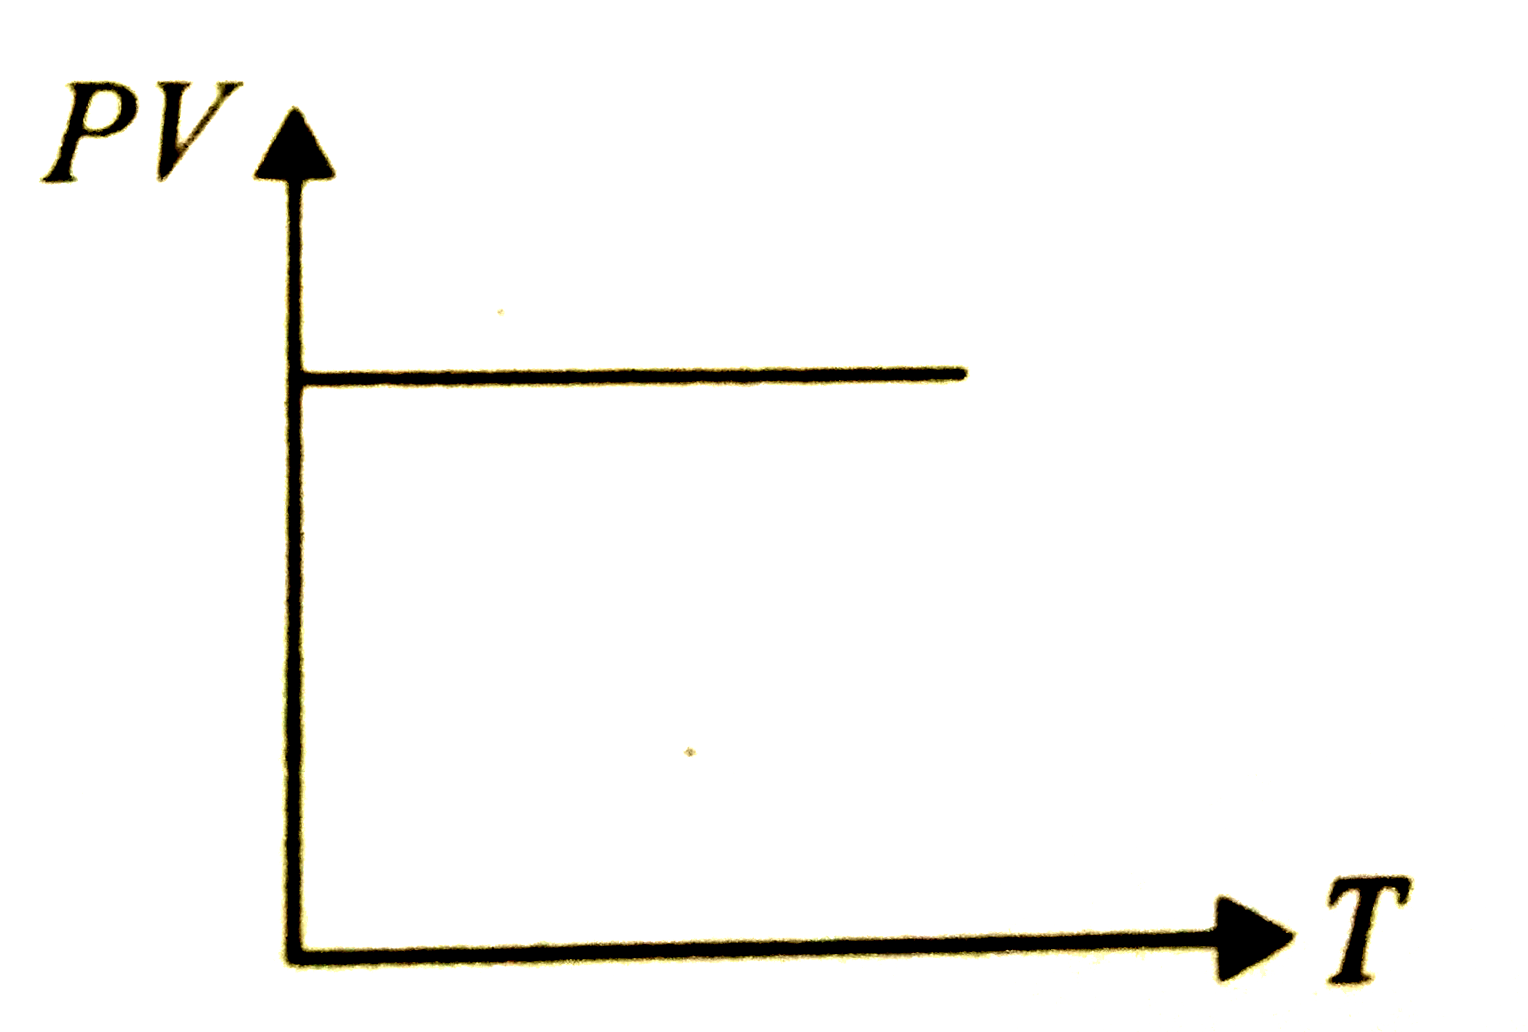 C3.
C3.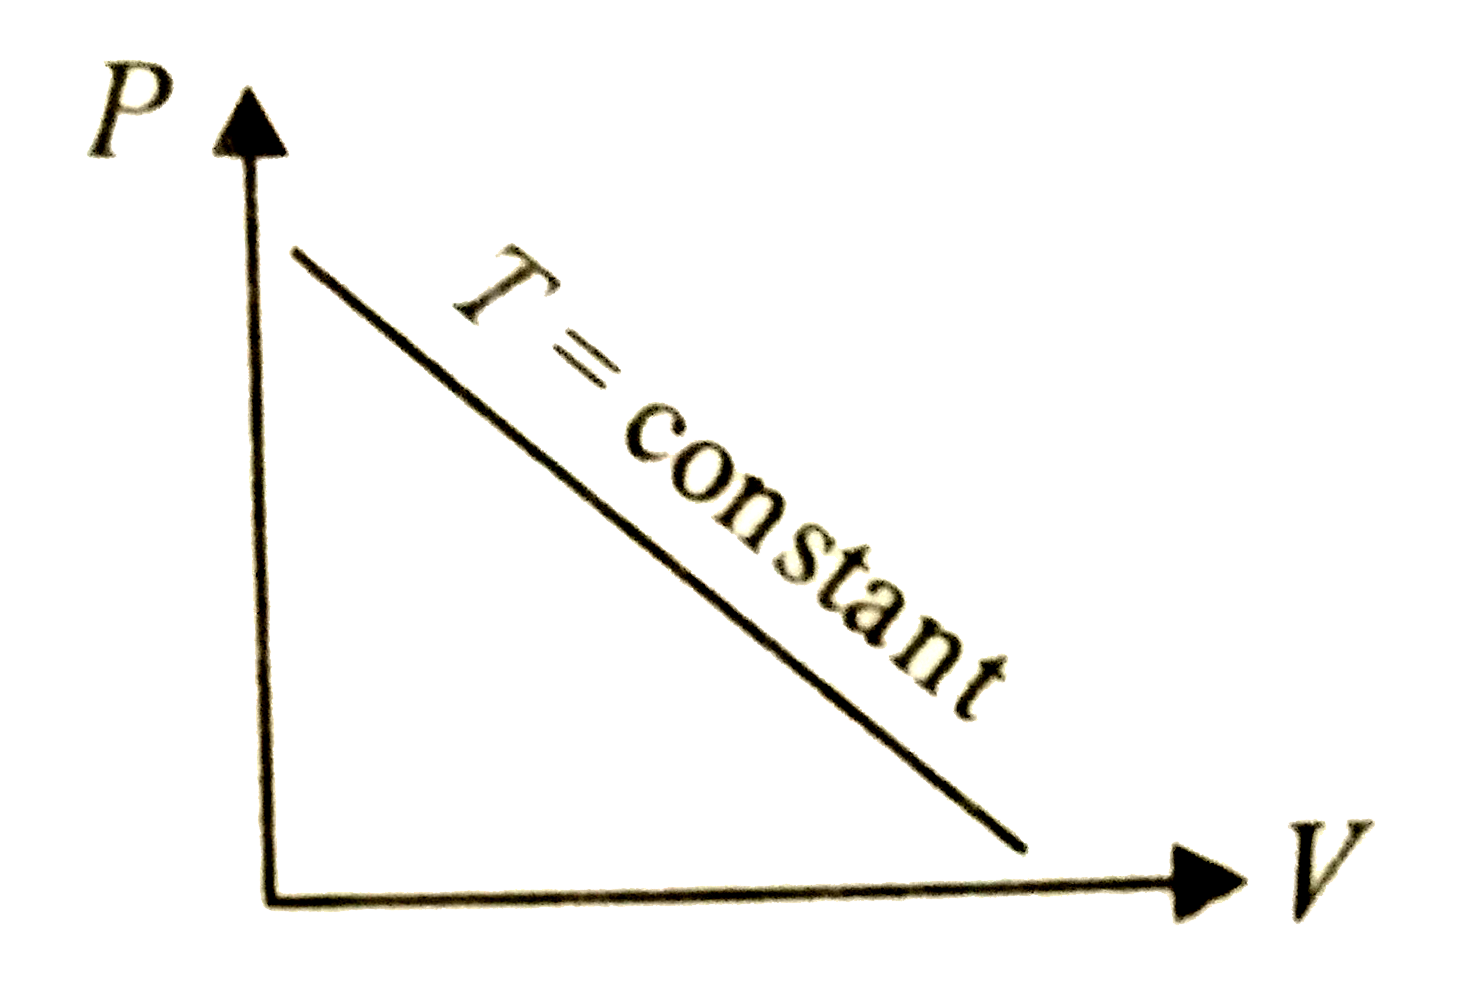 D4.
D4.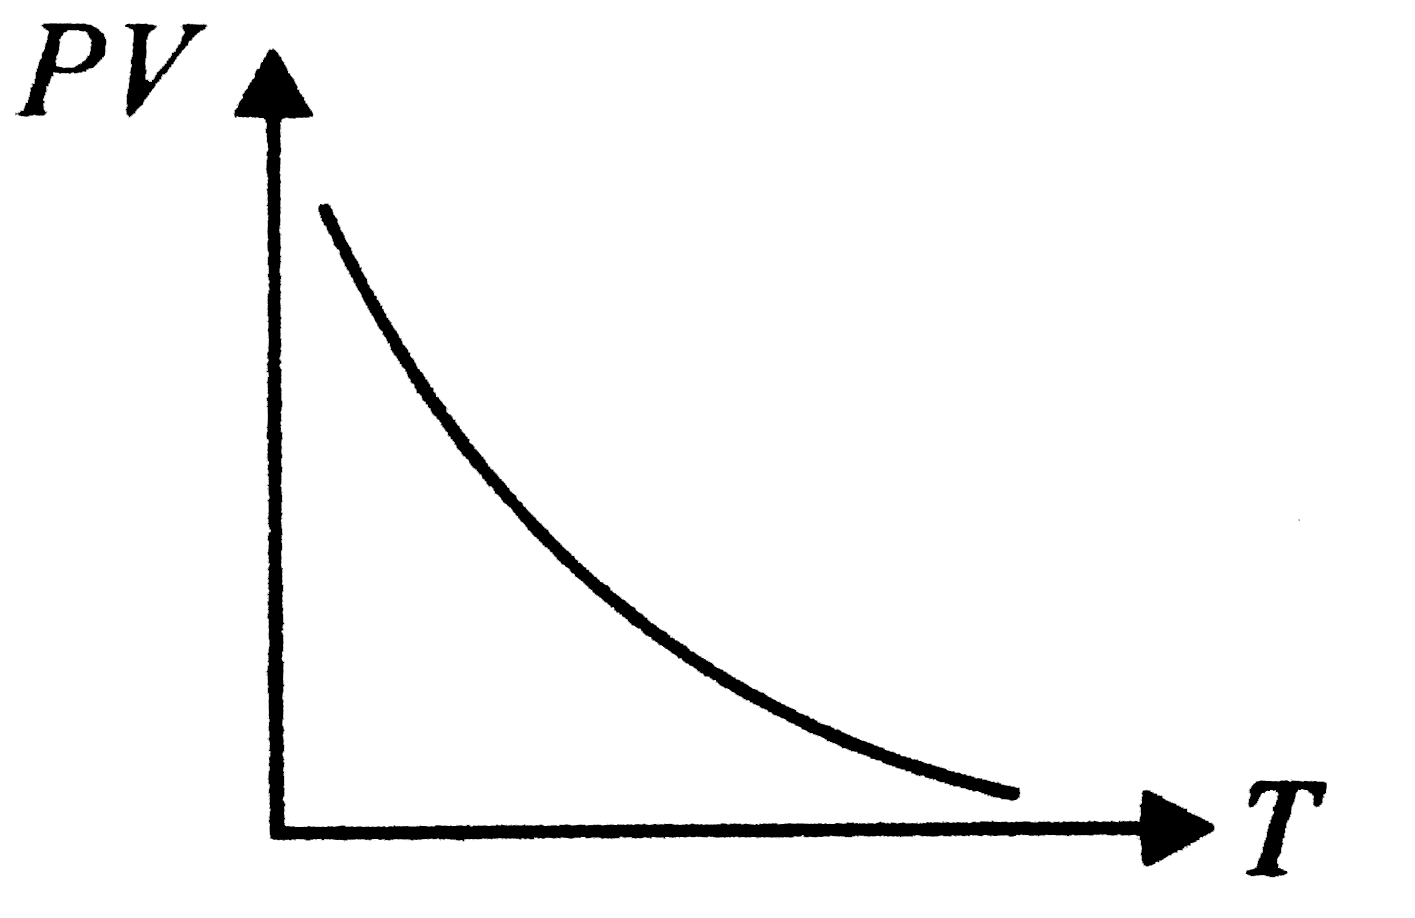
Which one of the following graphs represents variation of specific heat capacity of water with temperature?
A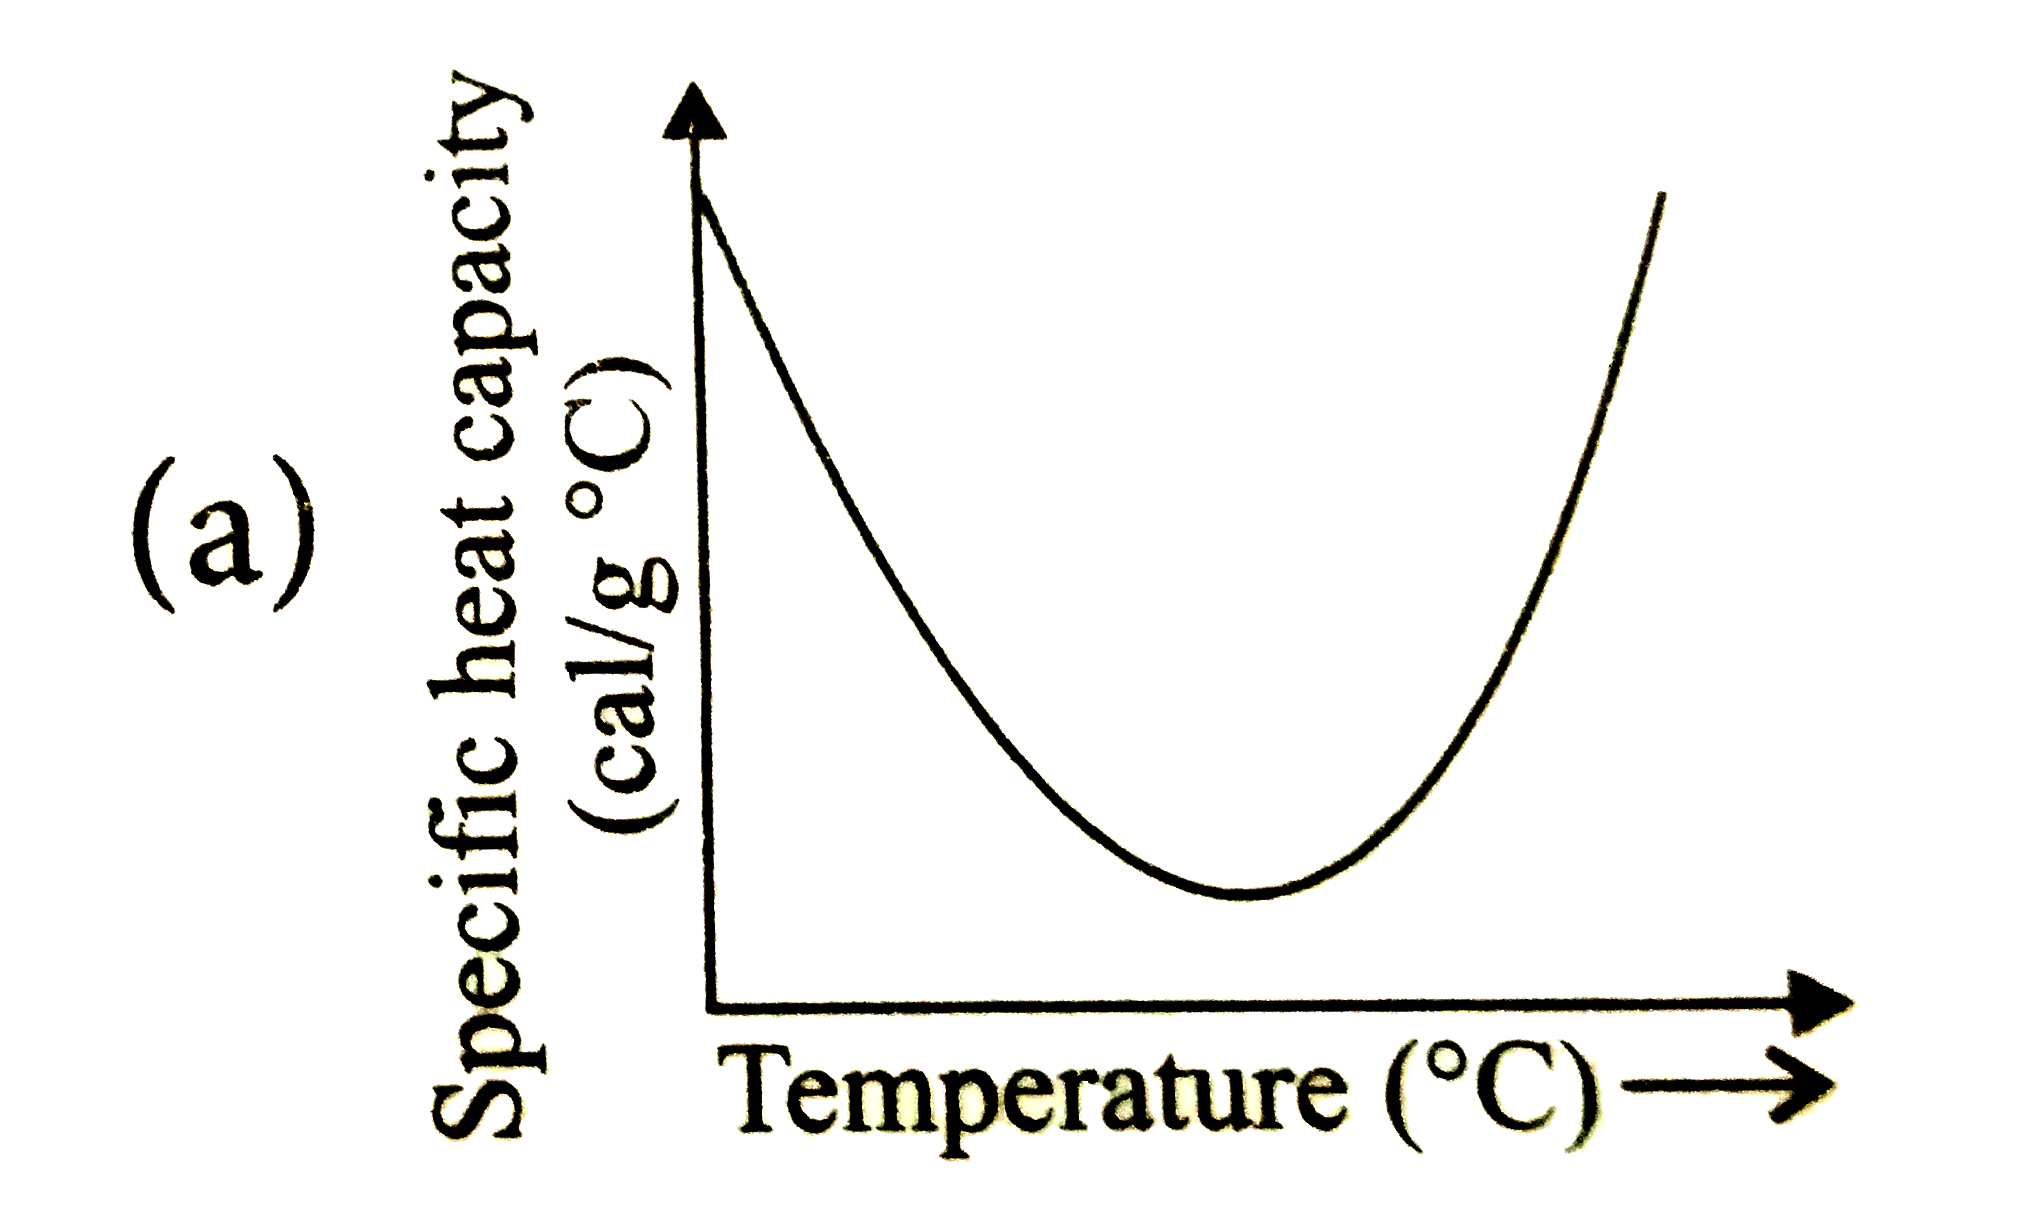 B
B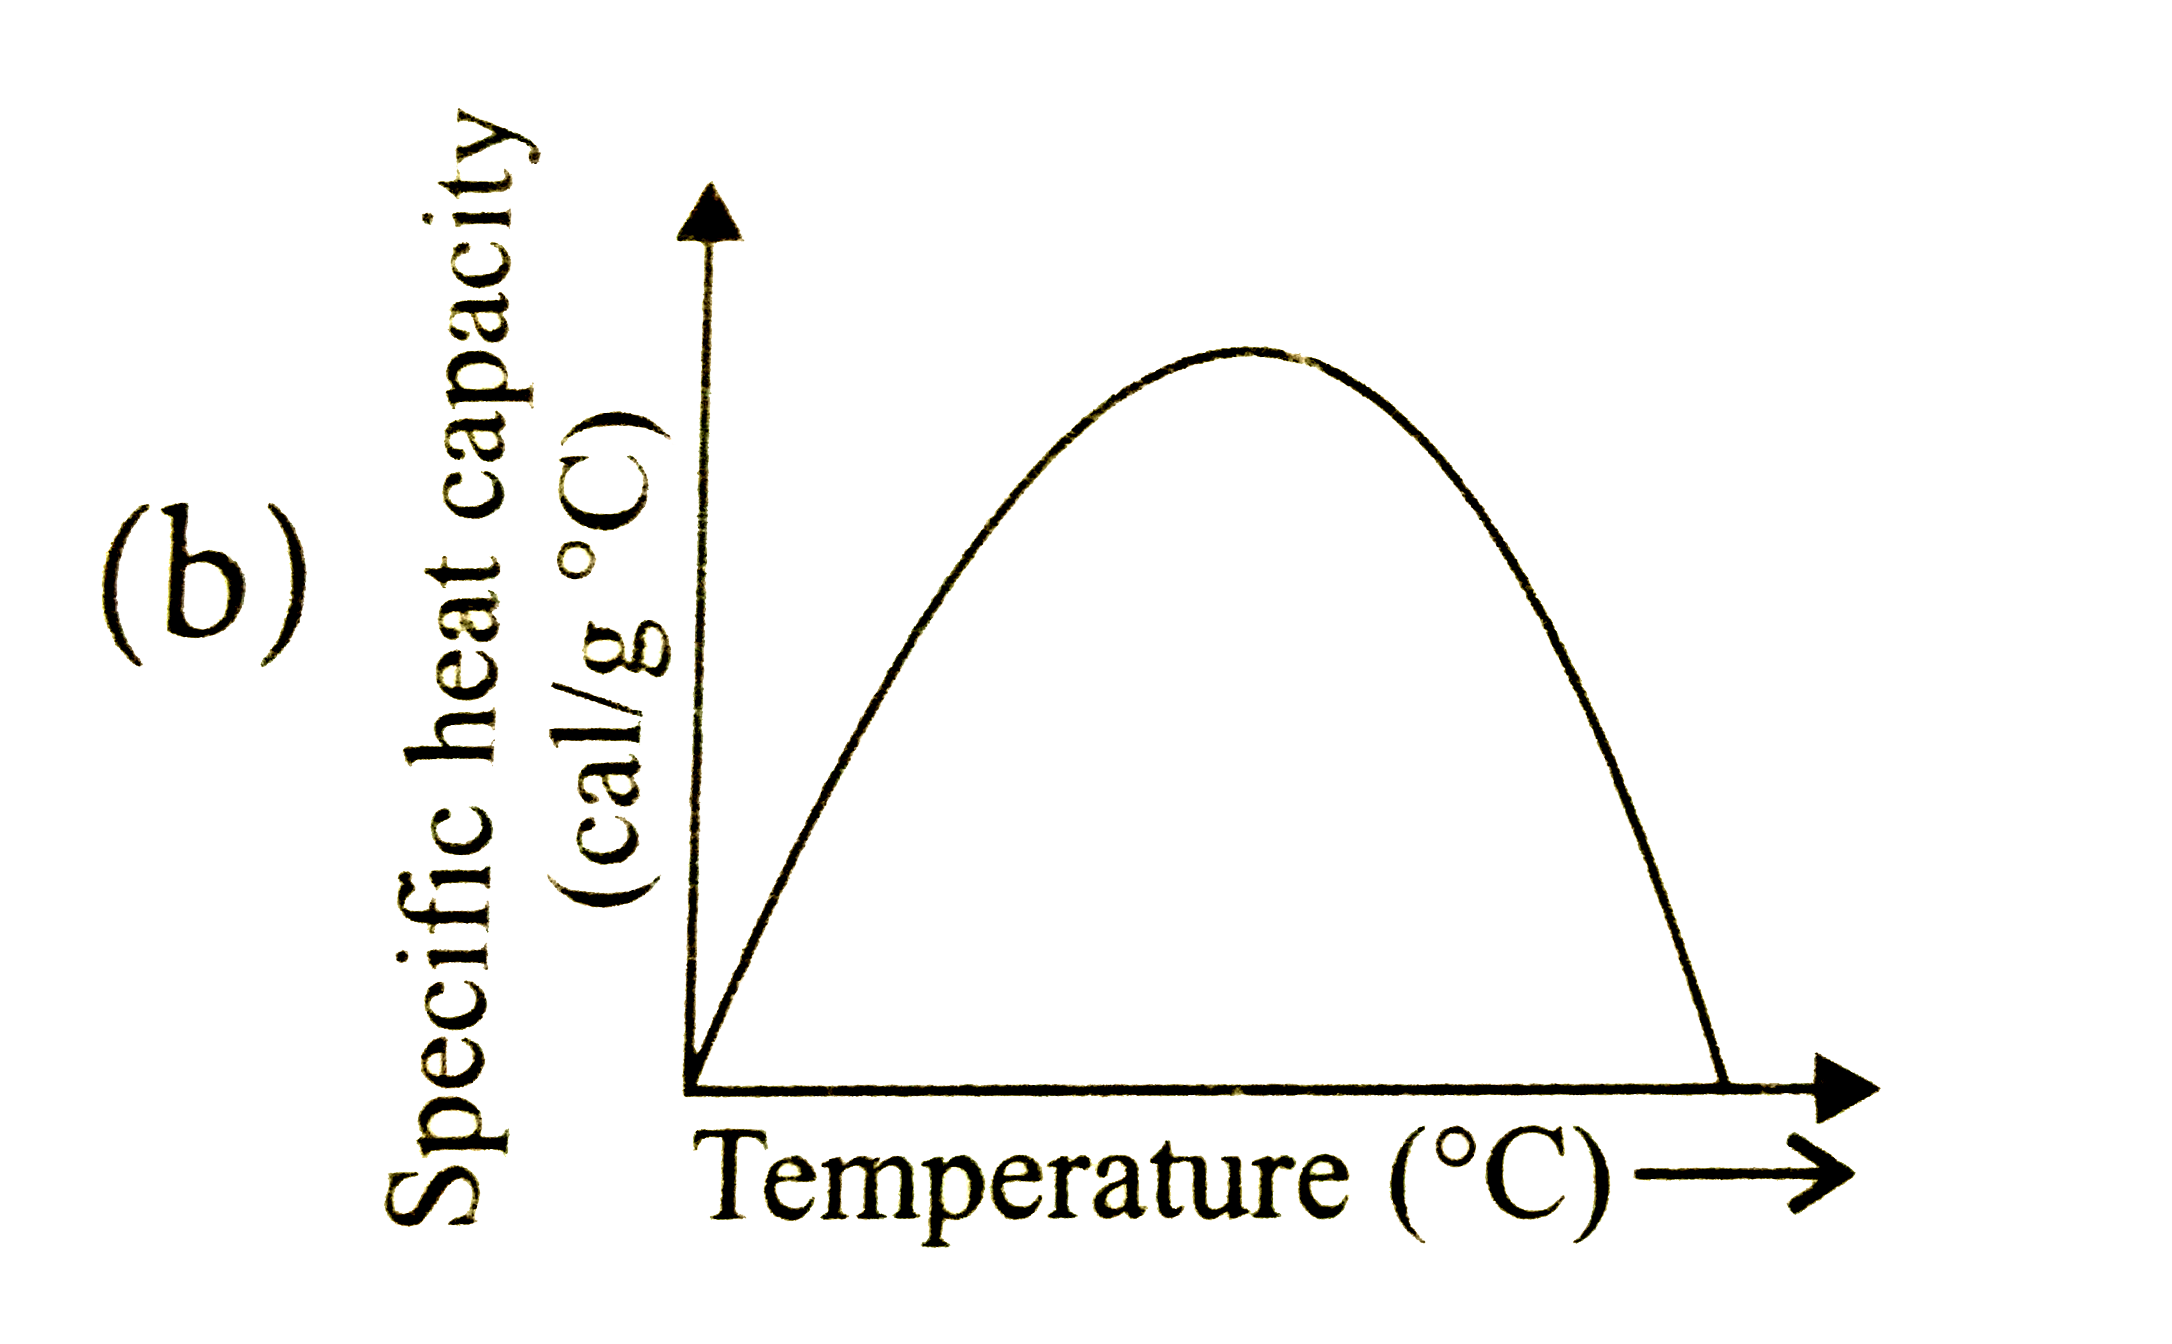 C
C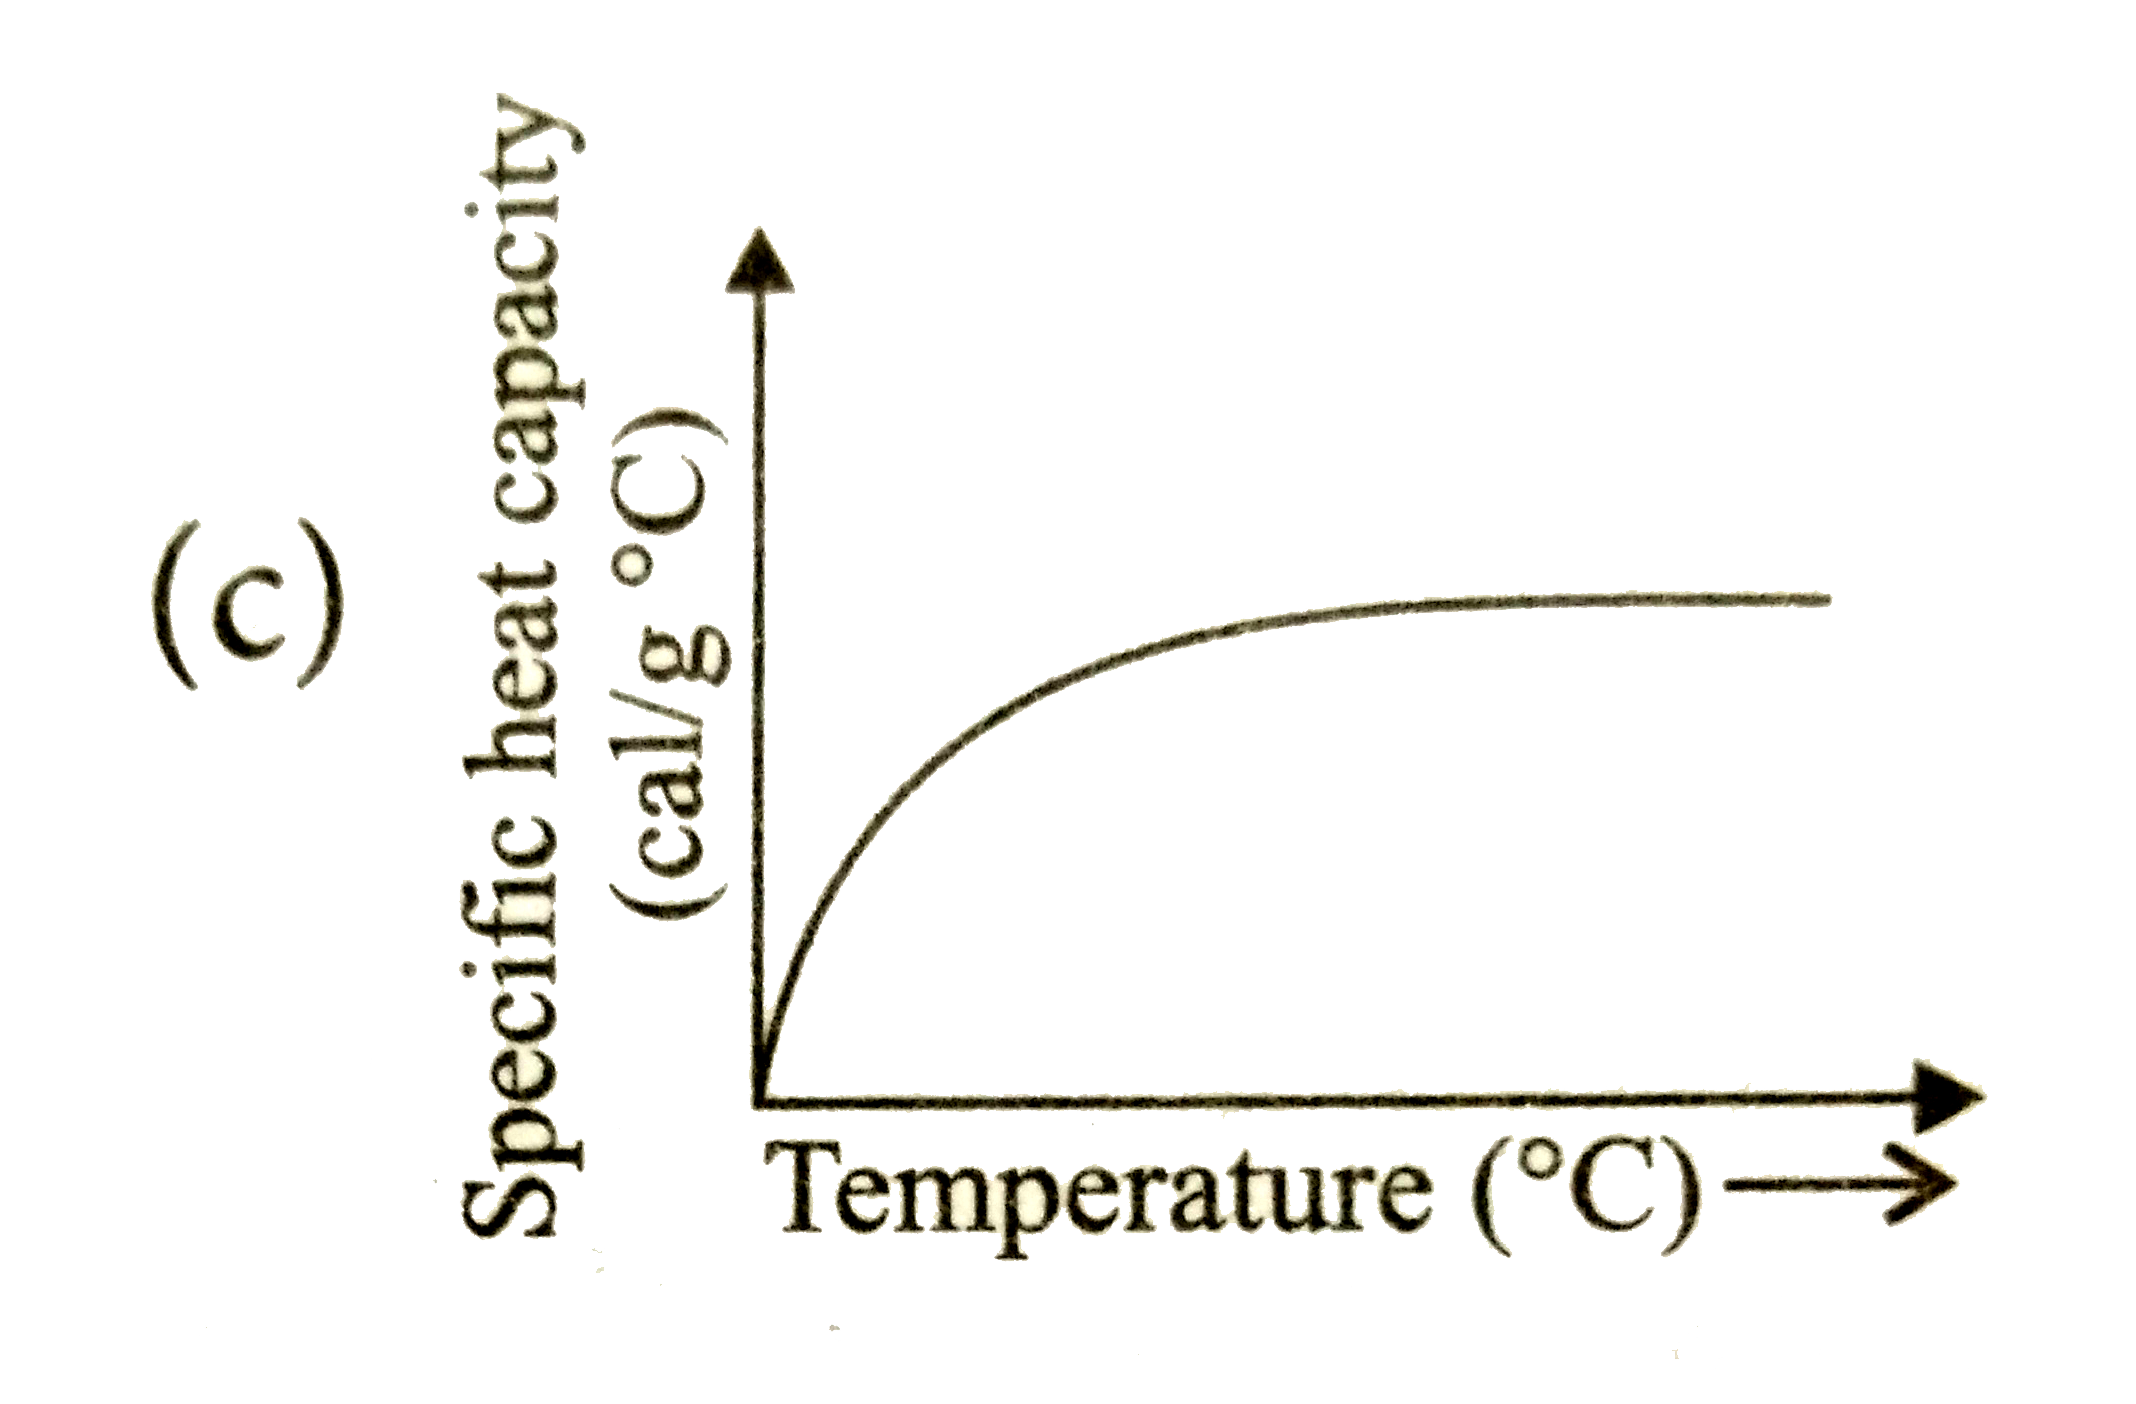 D
D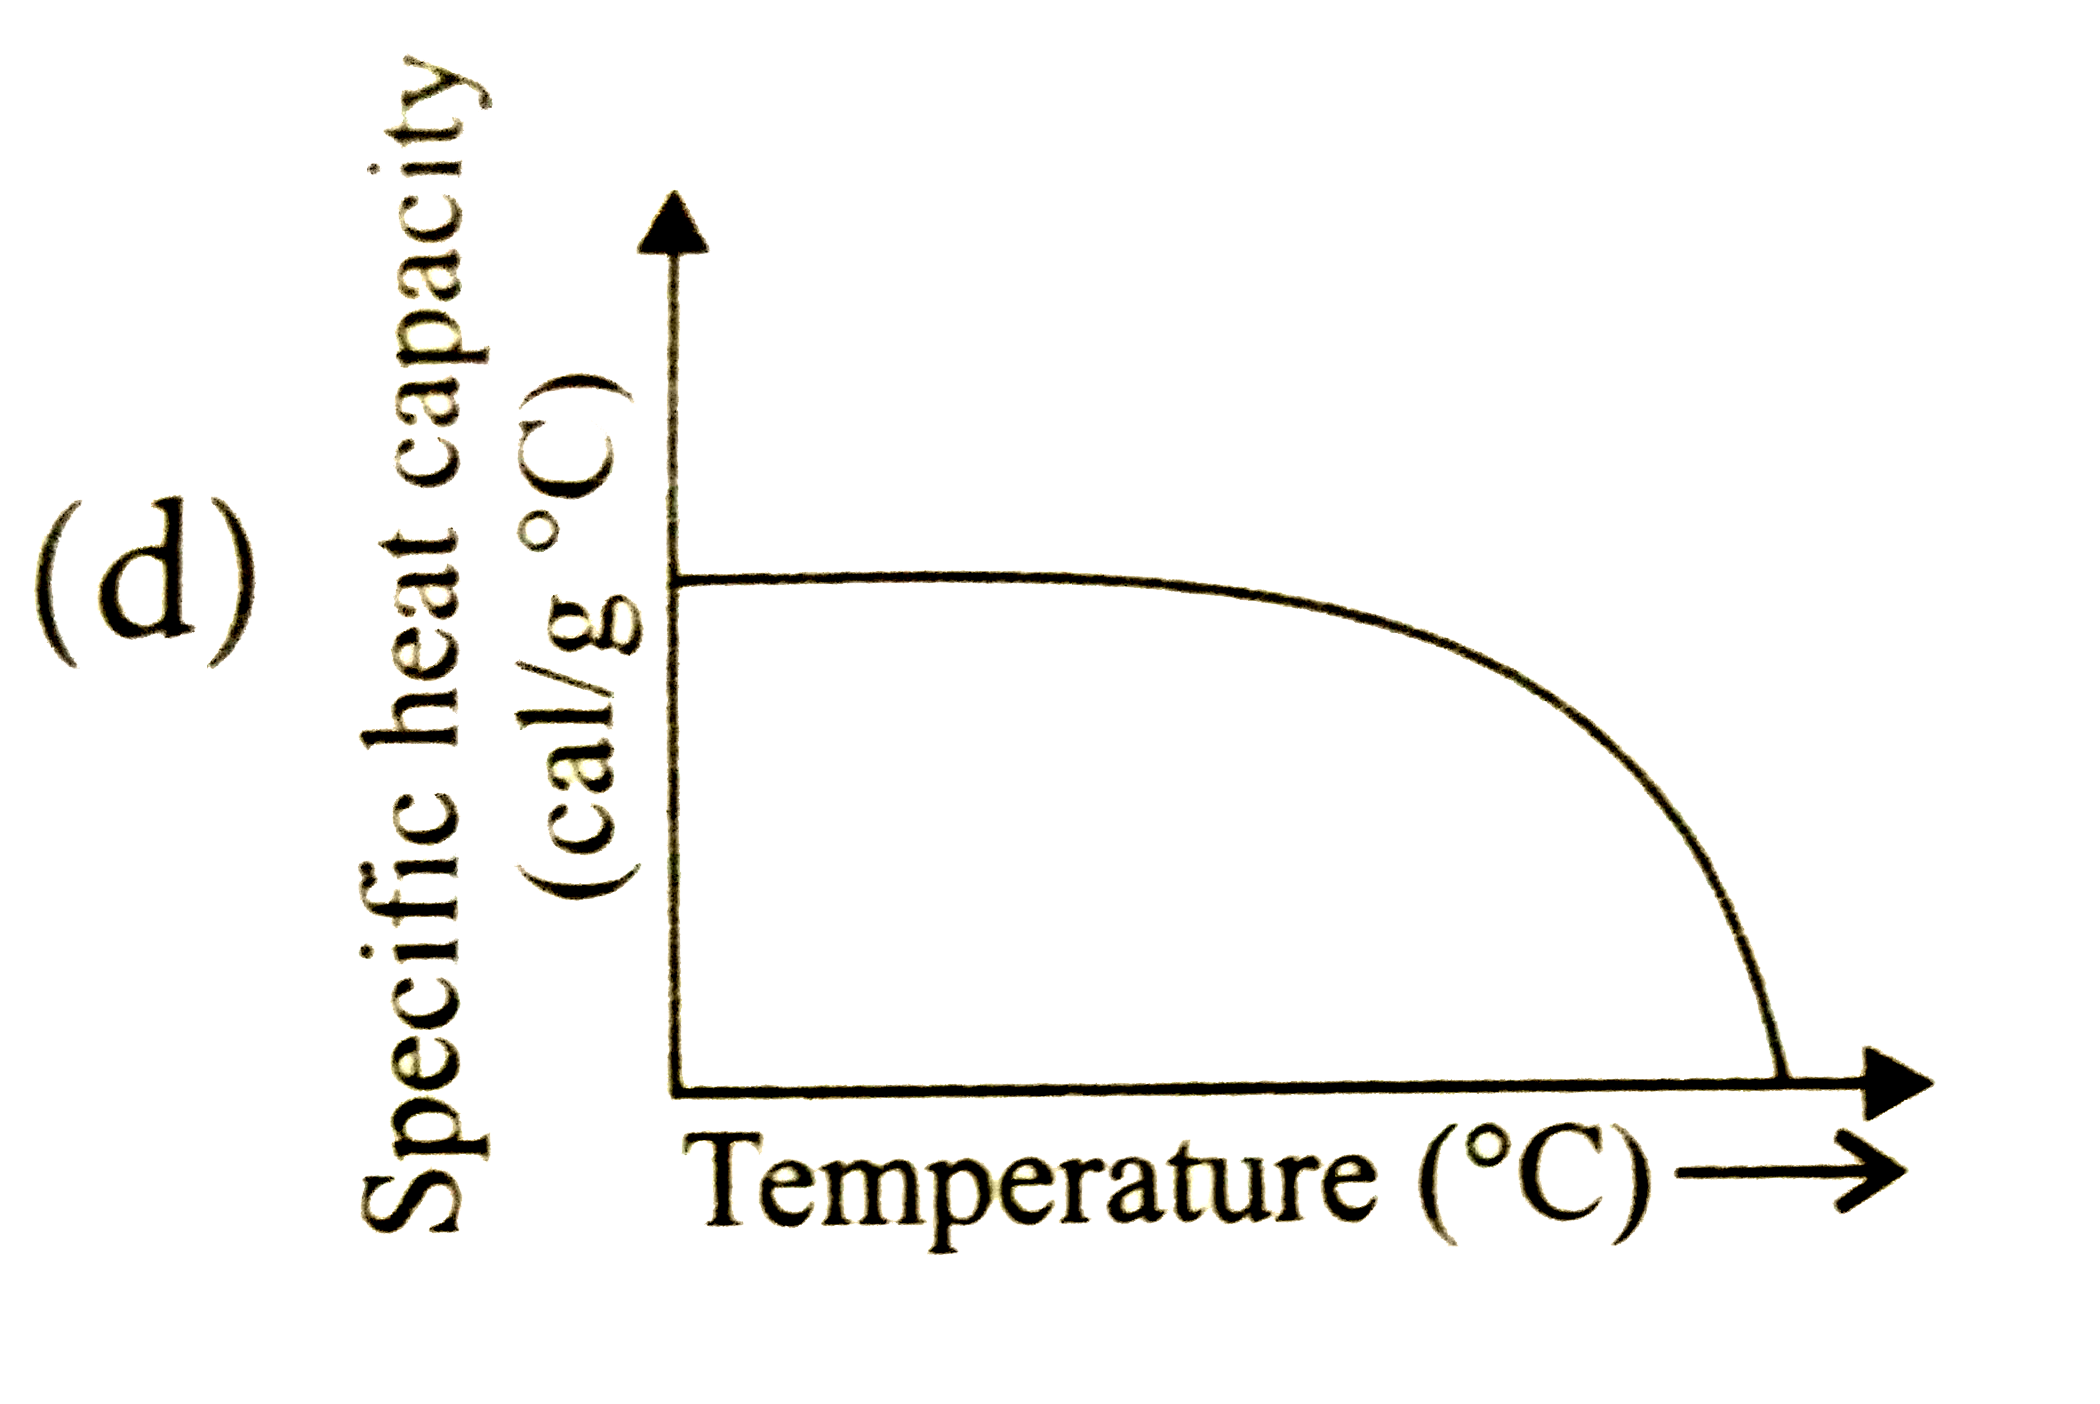
Which of the following graphs represent the correct variation of inductive reactance XL with frequency υ?
A B
B C
C D
D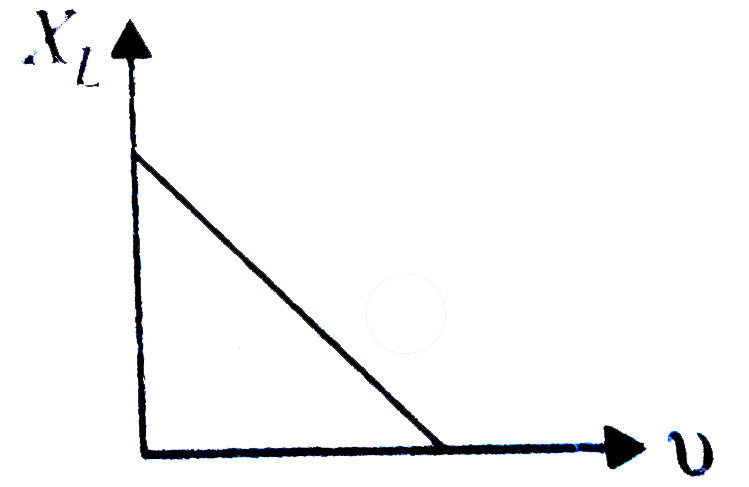
Which of the following graphs best represents the variation of acceleration 'a' with displacement x?
View SolutionWhich of the following graphs correctly represents the variation of g on the - Earth?
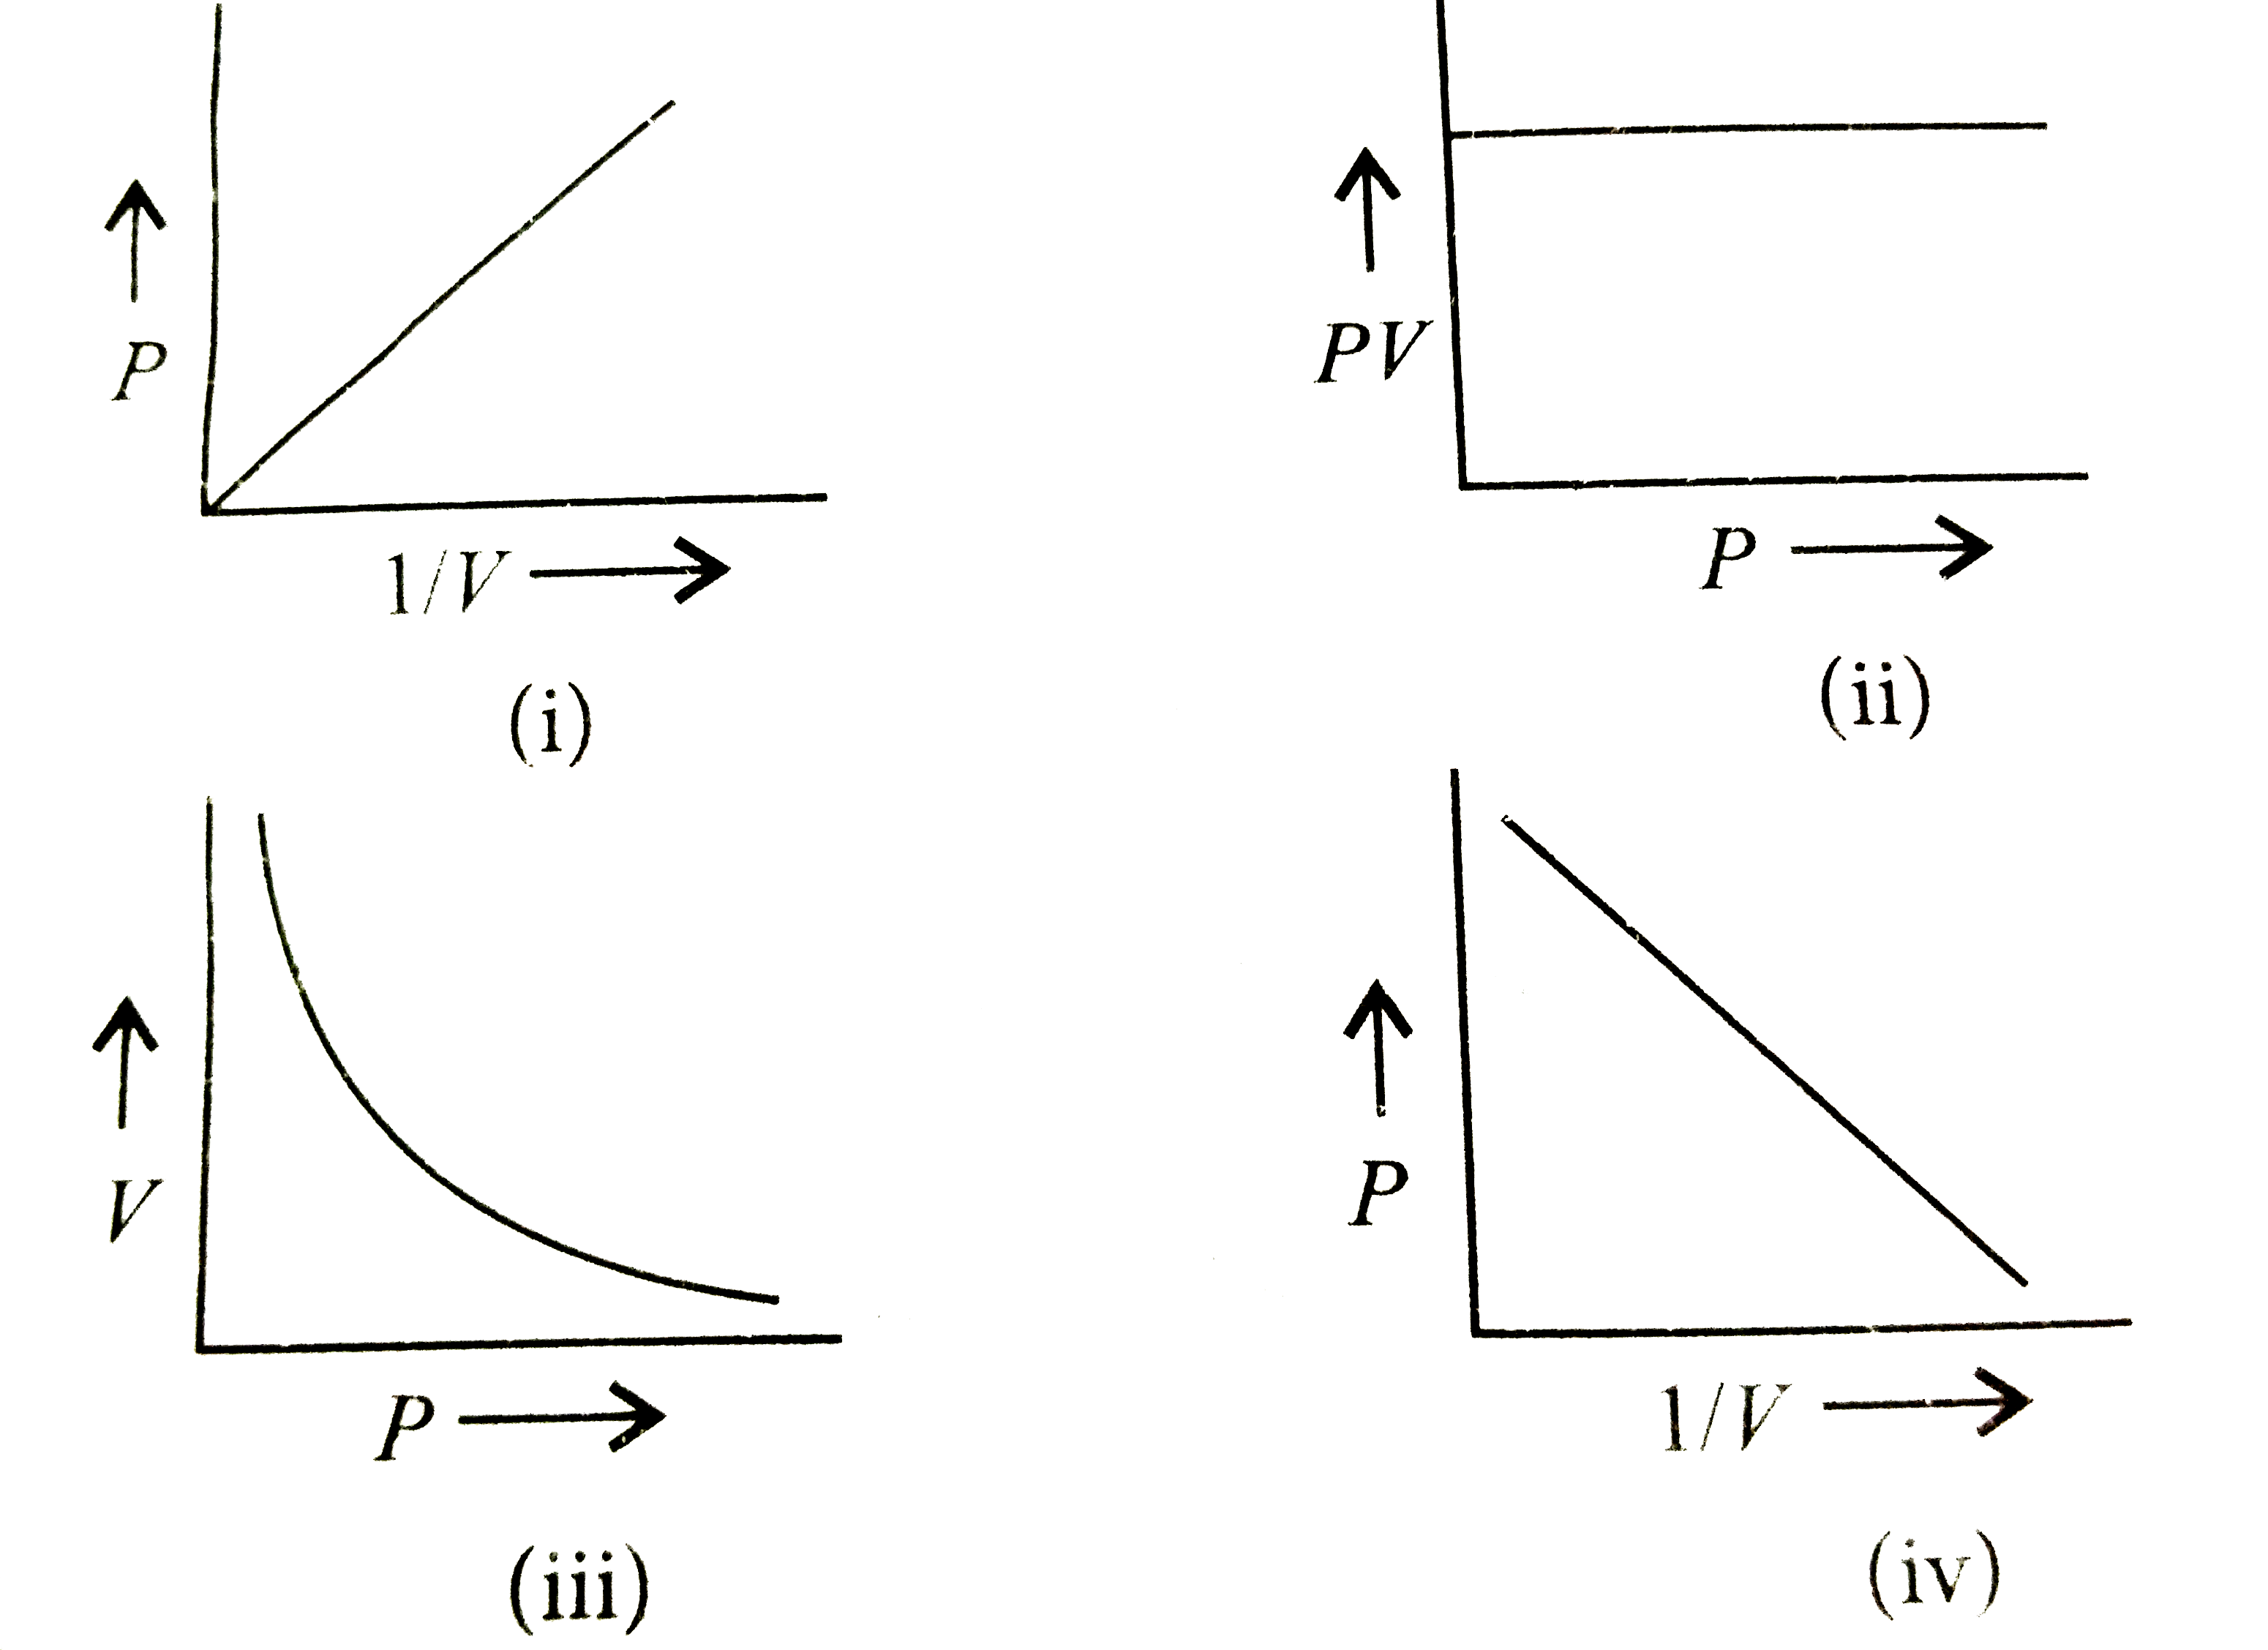
View SolutionWhich of the following graphs represents the correct Boyle's law ?
View SolutionVelocity of sound in a gas does not depend on the pressure of the gas. Why?
View SolutionFor an ideal gas, the graph representing the variation of the speed of sound (v) in a gas, with the r.m.s. speed (vrms) of its gas molecules with be
View Solution
