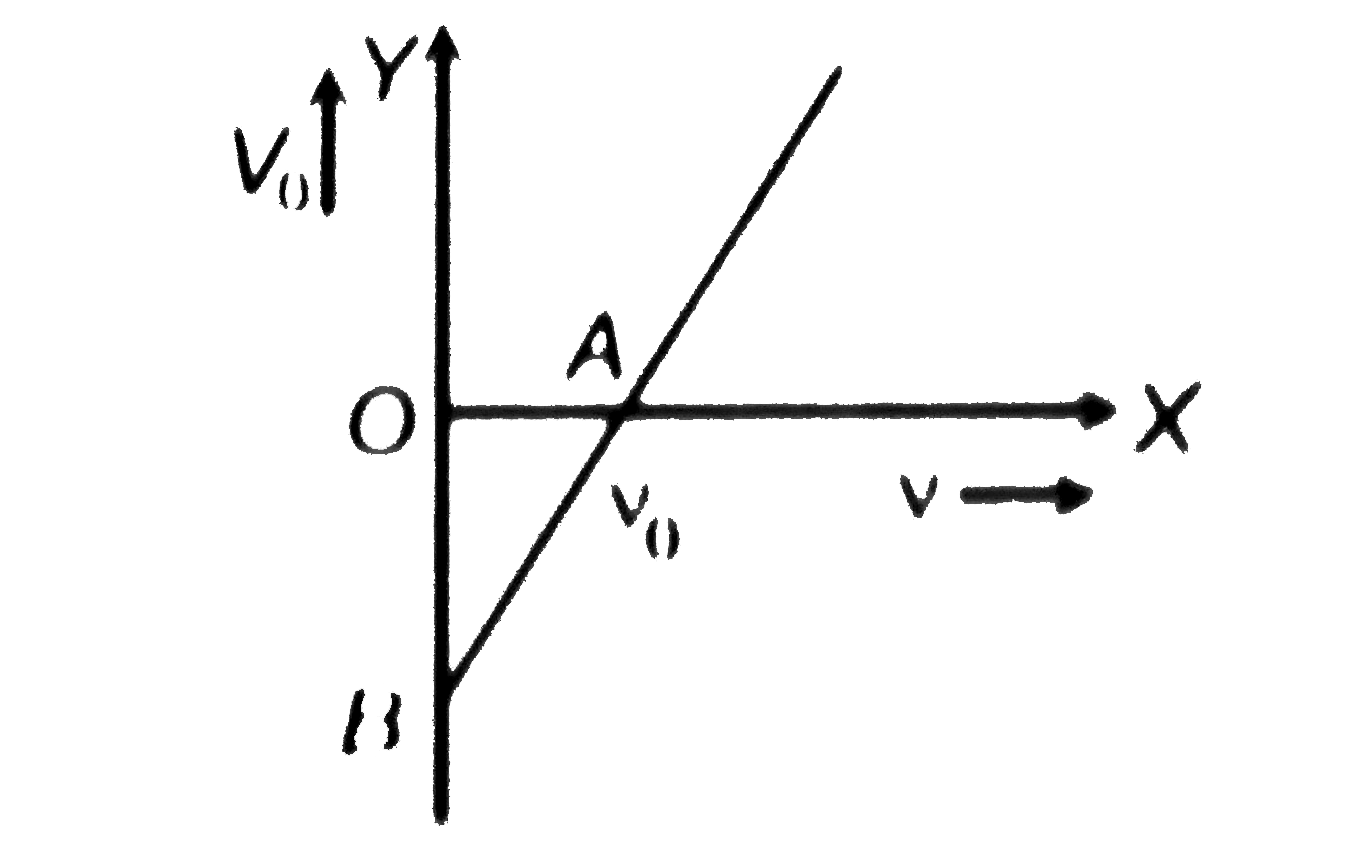
A student performs an experiment on photoelectric effect using two materials A and B. A plot of stopping potential (V0) vs freqency (v) is as shown in the figure.
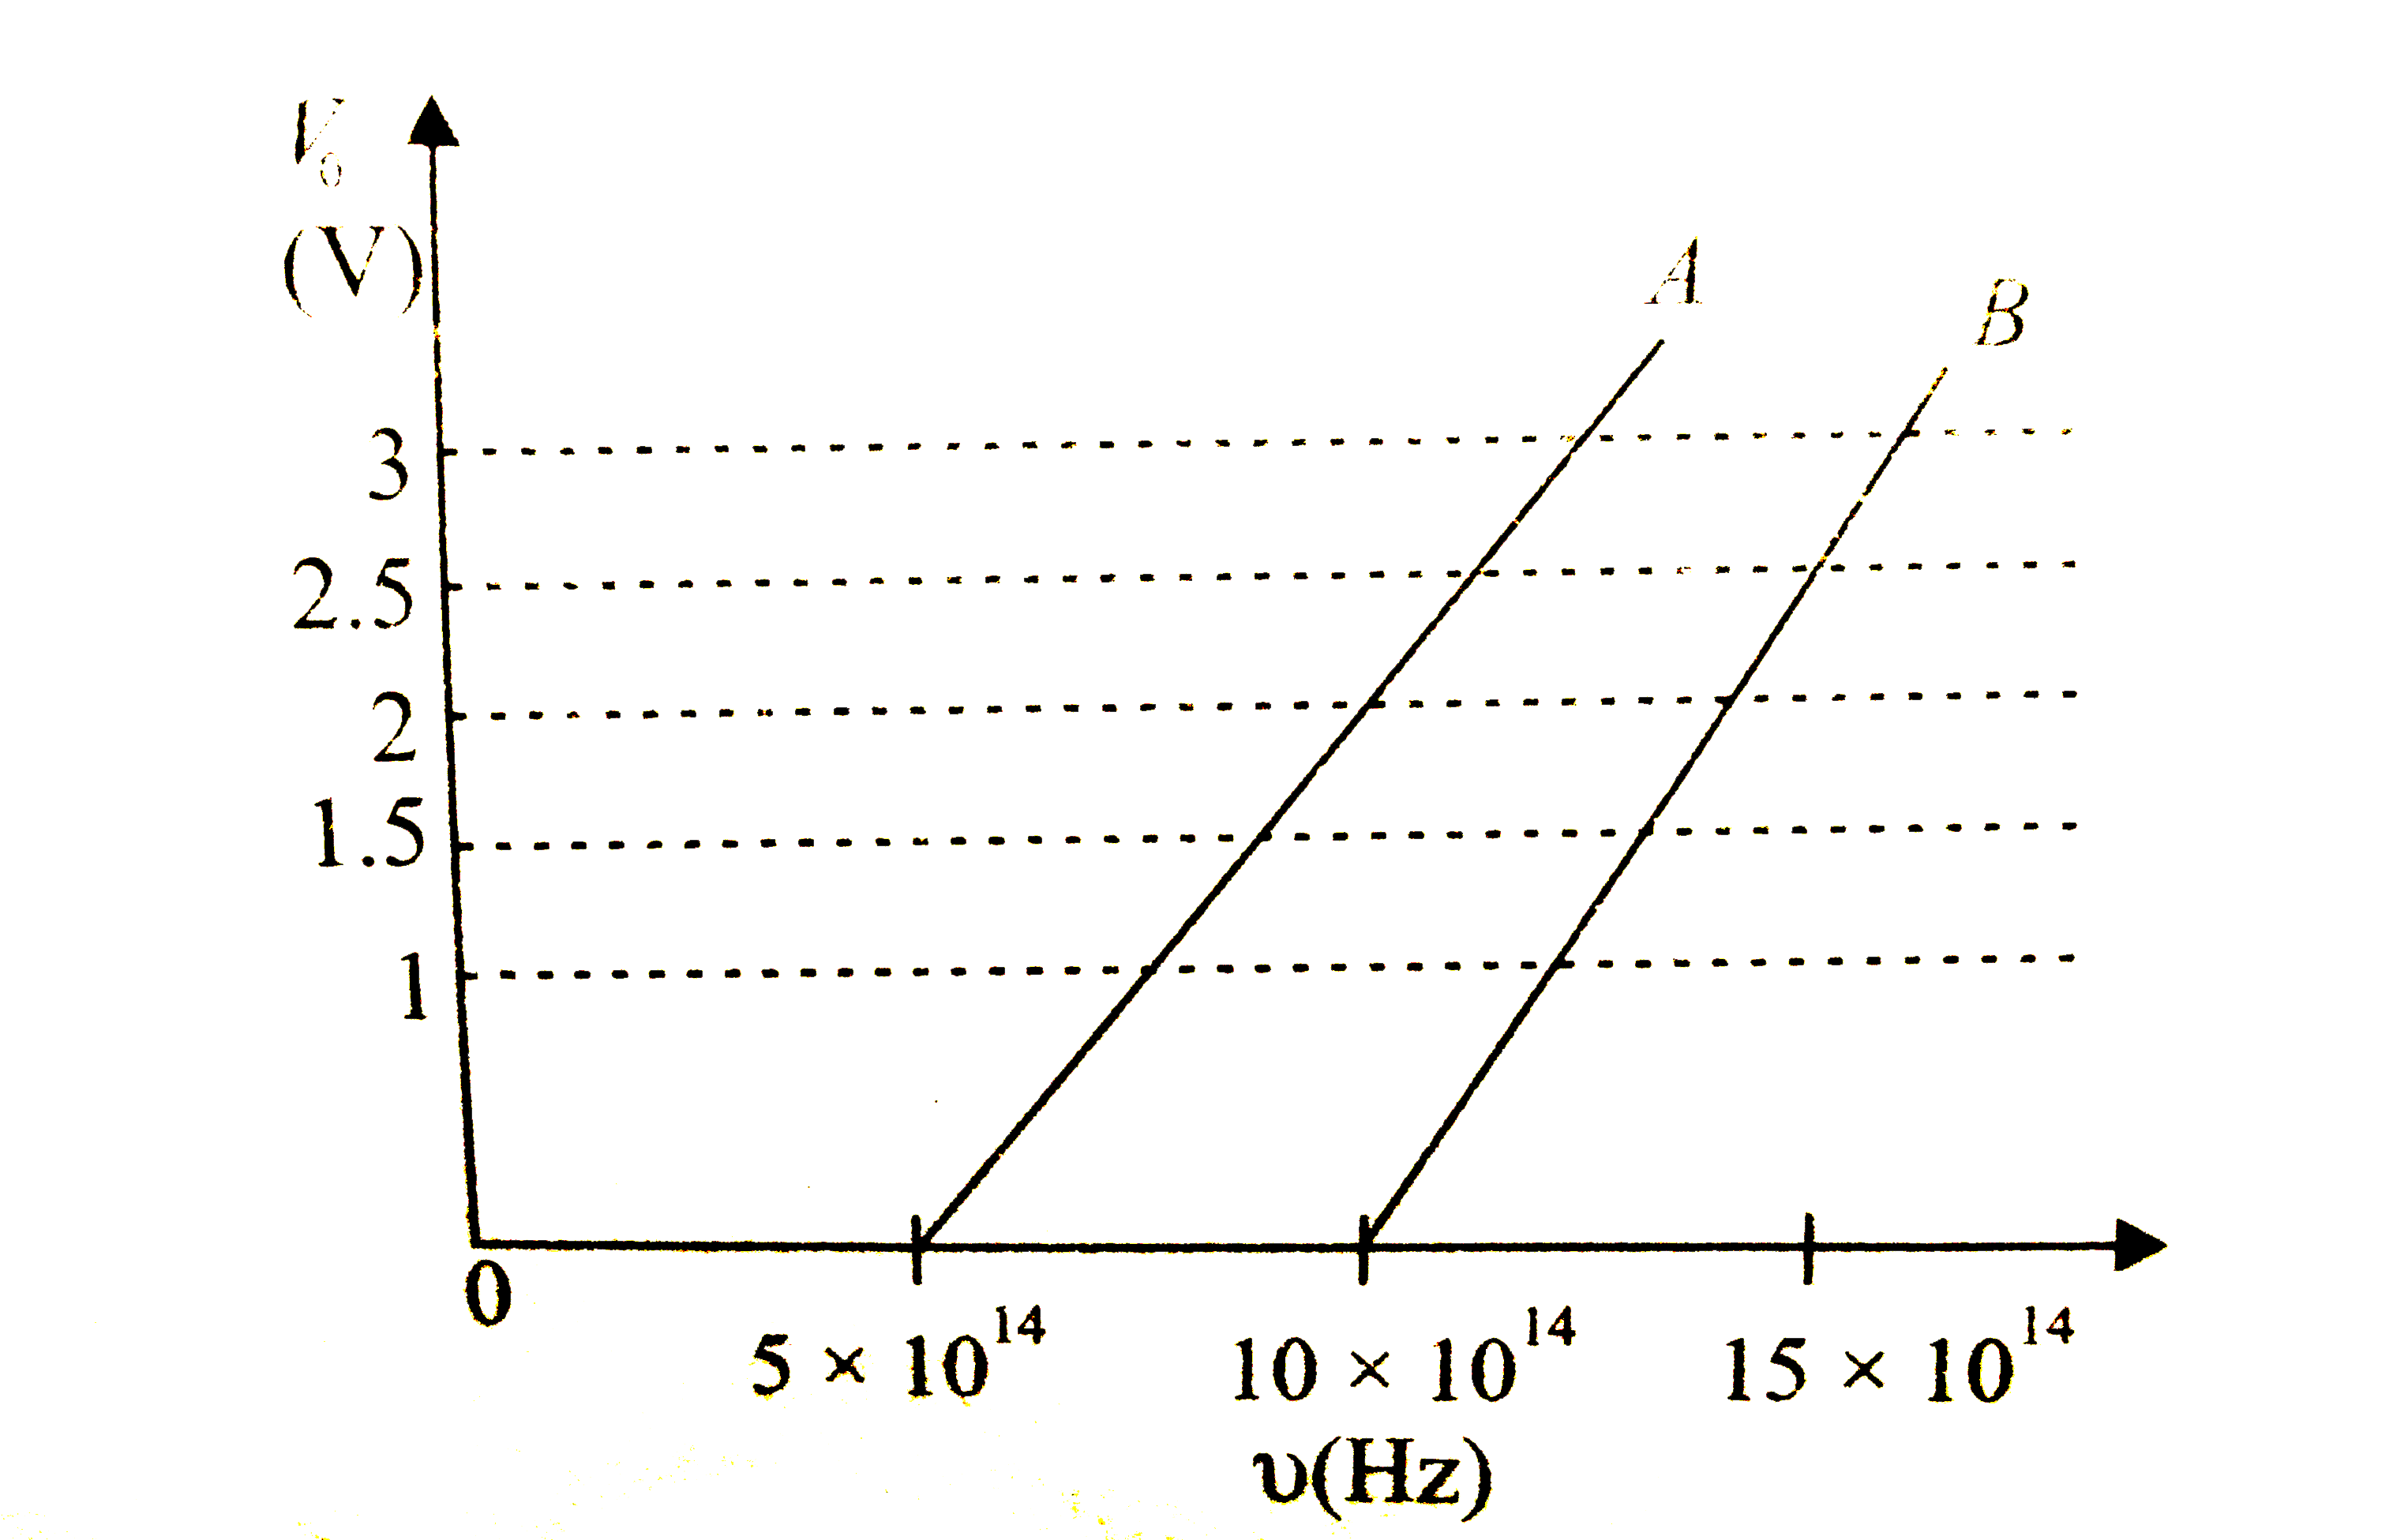
The value of h obtained from the experiment for both A and B respectively is
(Given electric charge of an electron =1.6×10⁻¹⁹C)
3.2×10⁻³⁴Js,4×10−34Js
6.4×10⁻³⁴Js,8×10−34Js
1.2×10⁻³⁴Js,3.2×10−34Js
4.2×10⁻³⁴Js,5×10−34Js
The correct Answer is:B
(b) : 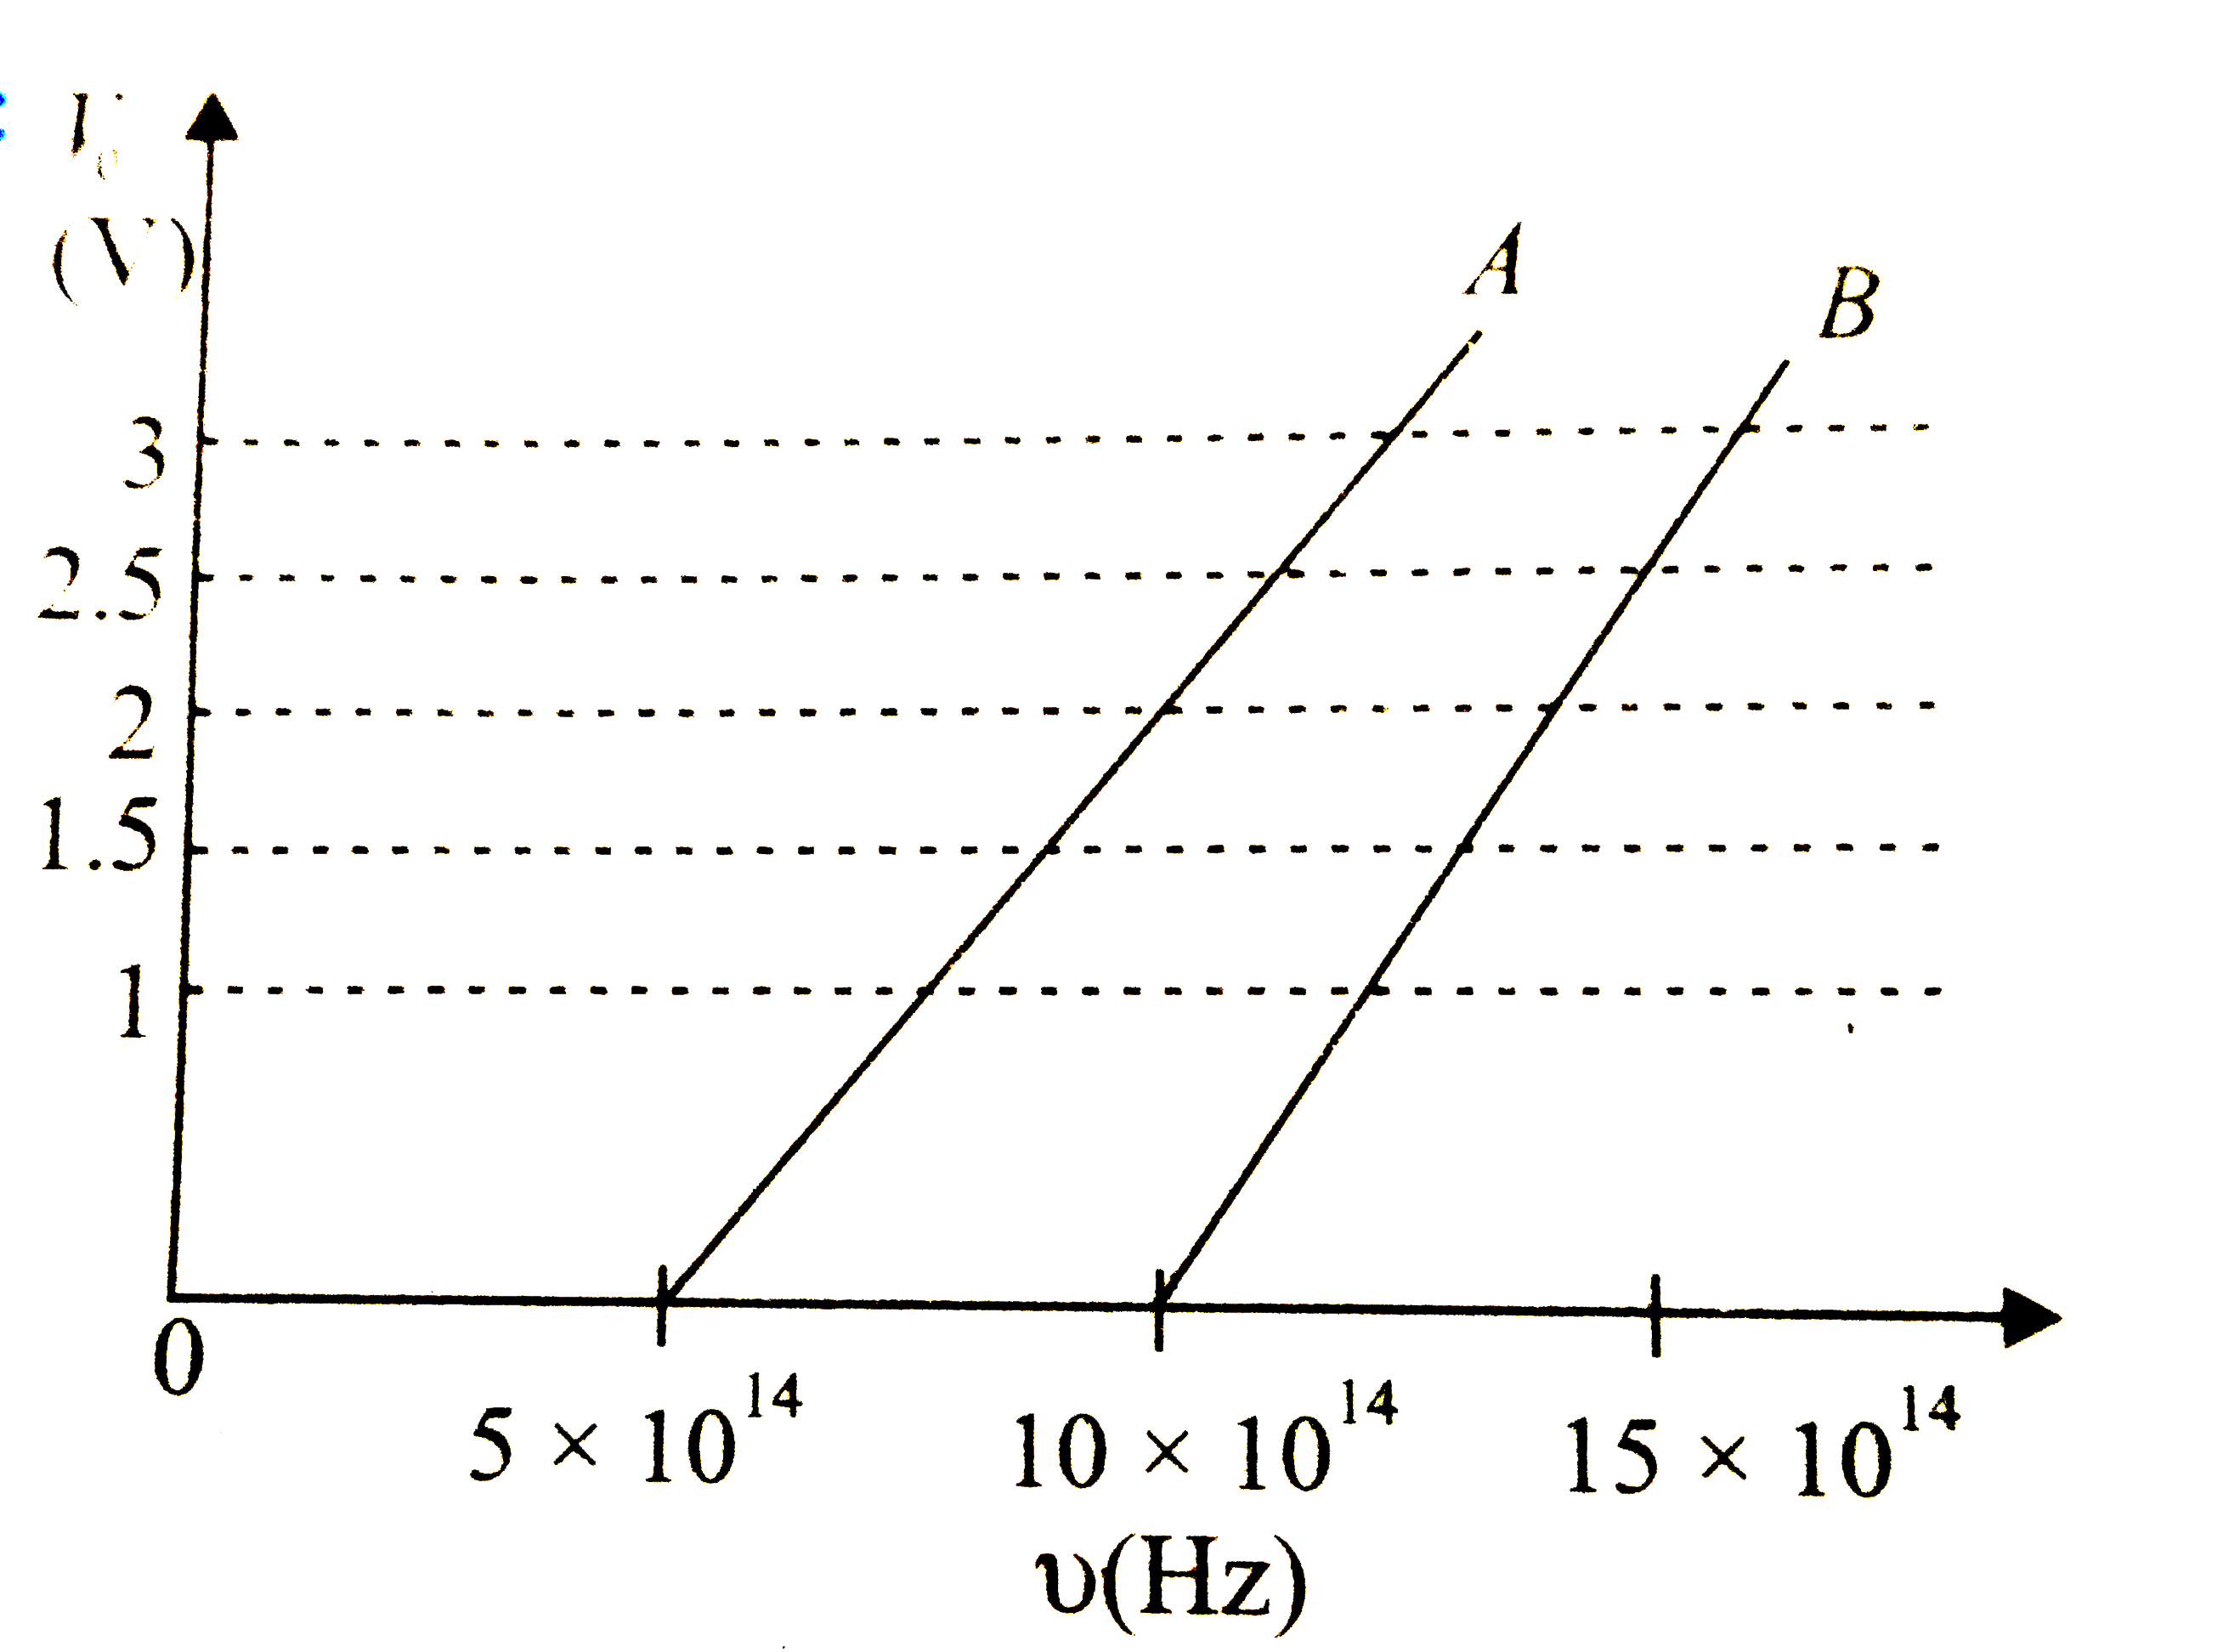
For metal A, Slope =he=2−0(10−5)×1014
orh=2×e5×1014=2×1.6×10−195×1014=6.4×10⁻³⁴J s
For metal B, Slope =he=2.5−0(15−10)×1014
h=2.5×e5×1014=2.5×1.6×10−195×1014=8×10⁻³⁴J s
Topper's Solved these Questions
- DUAL NATURE OF RADIATION AND MATTER BOOK - NCERT FINGERTPS ENGLISHCHAPTER - DUAL NATURE OF RADIATION AND MATTER EXERCISE - PARTICLE NATURE OF LIGHT : THE PHOTON
19 Videos
- DUAL NATURE OF RADIATION AND MATTER BOOK - NCERT FINGERTPS ENGLISHCHAPTER - DUAL NATURE OF RADIATION AND MATTER EXERCISE - WAVE NATURE OF MATTER
37 Videos
- DUAL NATURE OF RADIATION AND MATTER BOOK - NCERT FINGERTPS ENGLISHCHAPTER - DUAL NATURE OF RADIATION AND MATTER EXERCISE - EXPERIMENTAL STUDY OF PHOTOELECTRIC EFFECT
11 Videos
- CURRENT ELECTRICITYBOOK - NCERT FINGERTPS ENGLISHCHAPTER - CURRENT ELECTRICITYEXERCISE - Assertion And Reason
15 Videos
- ELECTRIC CHARGES AND FIELDSBOOK - NCERT FINGERTPS ENGLISHCHAPTER - ELECTRIC CHARGES AND FIELDSEXERCISE - Assertion And Reason
15 Videos
Similar Questions
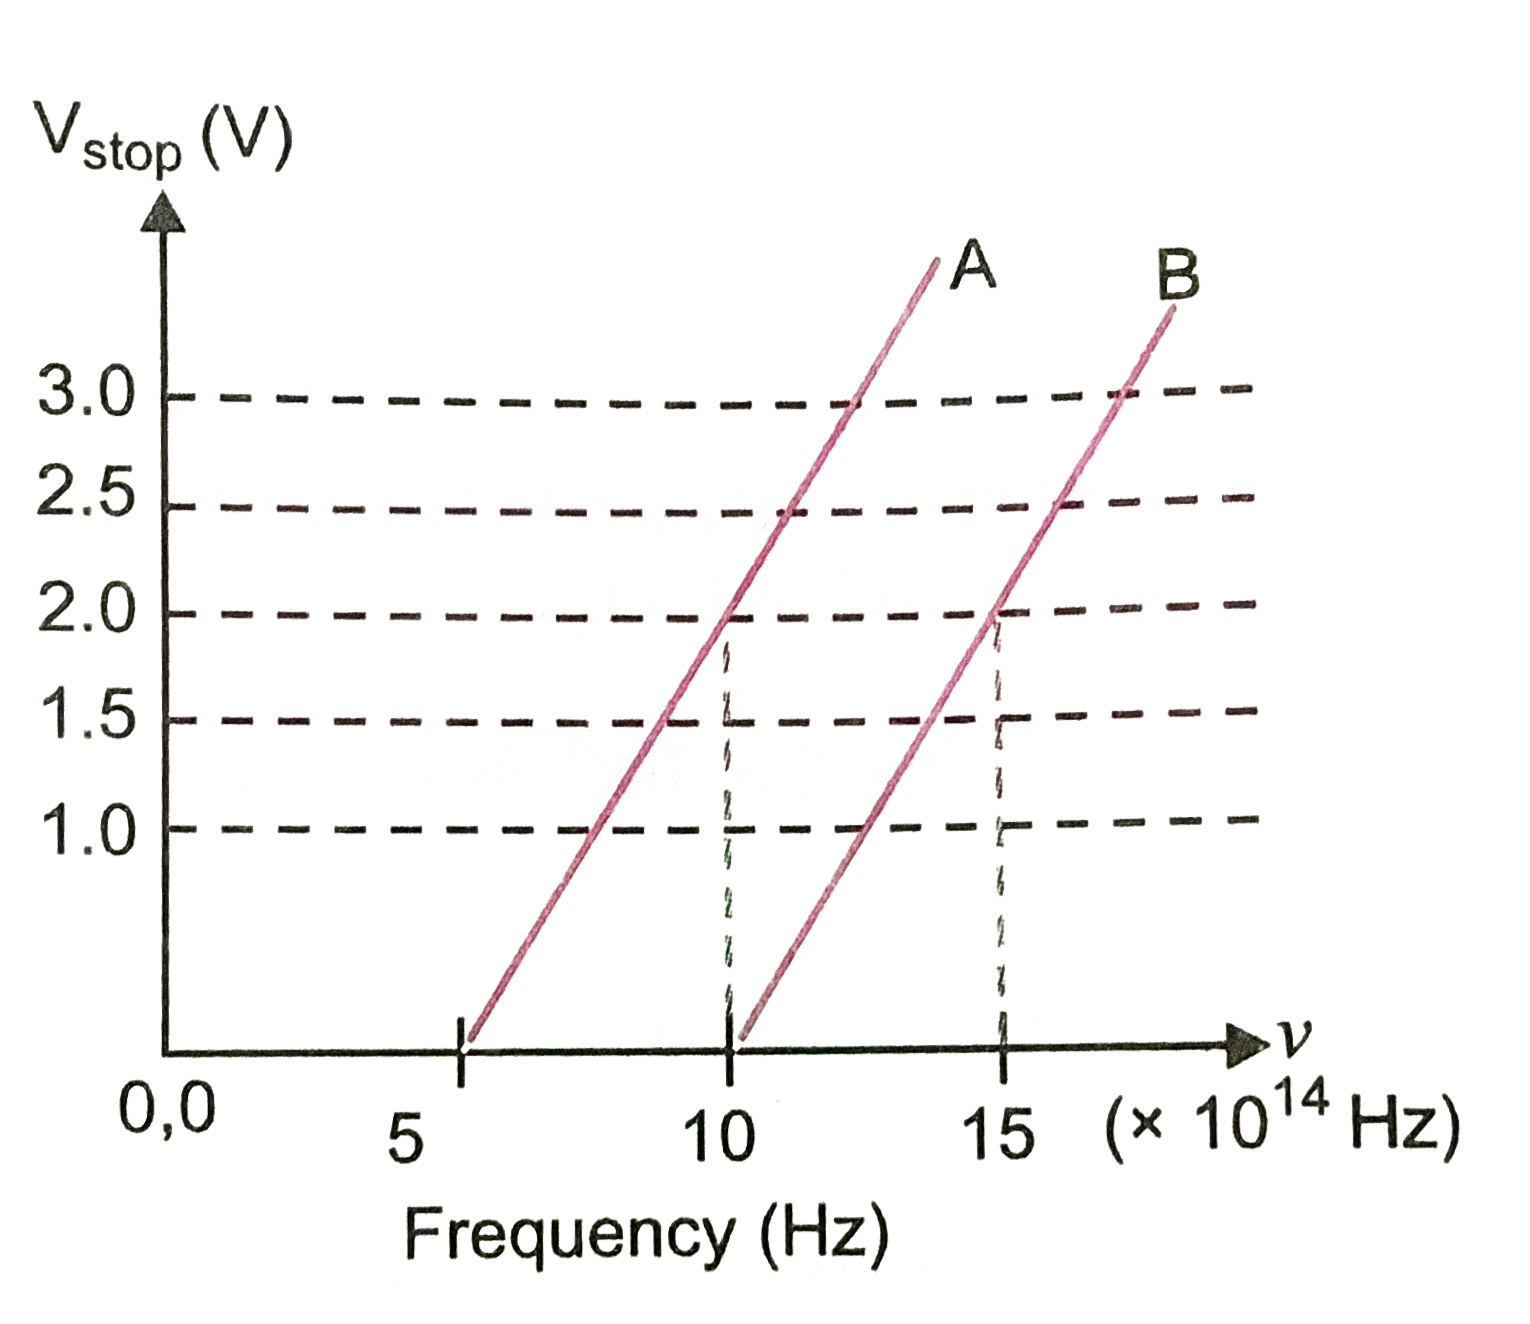
A student performs an experiment on photoelectric effect, using two materials A and B. A plot of Vs⊤ vs ν is given in fig.
(i) Which material A or B has a higher work function?
(ii) Given the electric charge of an electron =1.6×10⁻¹⁹C, find the value of h obtained from the experiment for both A and B. Comment on whether it is consistent with Einstein's theory.
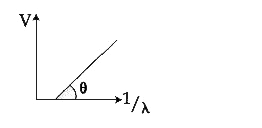
View SolutionIn a photoelectric effect experiment, the graph of stopping potential V versus reciprocal of wavelength obtained is shown in the figure. As the intensity of incident radiation is increased :
View Solution
Knowledge Check
The photoelectric cut off voltage in a certain experiment is 1.5V. What is the maximum kinetic energy of photoelectrons emitted? e=1.6×10⁻¹⁹C.
A2.4 eVB1.5 eVC3.1 eVD4.5 eV
In an experiment on photoelectric effect the frequency f of the incident light is plotted against the stopping potential V0. The work function of the photoelectric surface is given by ( e is the electronic charge)
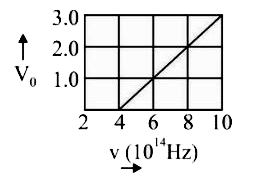
View SolutionThe stopping potential V0 (in volt) as a function of frequency (v) for a sodium emitter, is shown in the figure. The work function of sodium, from the data plotted in the figure, will be:
(Given : Planck’s constant)
(h)=6.63×10⁻³⁴Js electron charge e=1.6×10⁻¹⁹C)
View Solution
the stopping potential Vo (in volt) as a function of frequency (v) for a soidum emitter, is shown in the figure. The work function of sodium from the data plotted in the figure. Will be:
[ given plank's constant (h)=6.63×10⁻³⁴Js, electron charge e=1.6×10⁻¹⁹C)
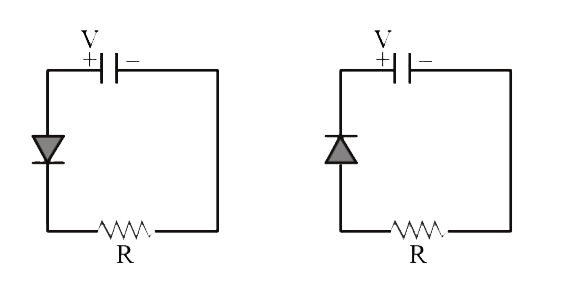
View SolutionTwo identical capacitors A and B are charged to the same potential V and are connected in two circuits at t = 0 as shown in figure. The charge of the capacitors at a time t = CR are respectively -
View SolutionThe photoelectric cut off voltage in a certain experiment is 1.5V. What is the maximum kinetic energy of photoelectrons emitted? e=1.6×10⁻¹⁹C.
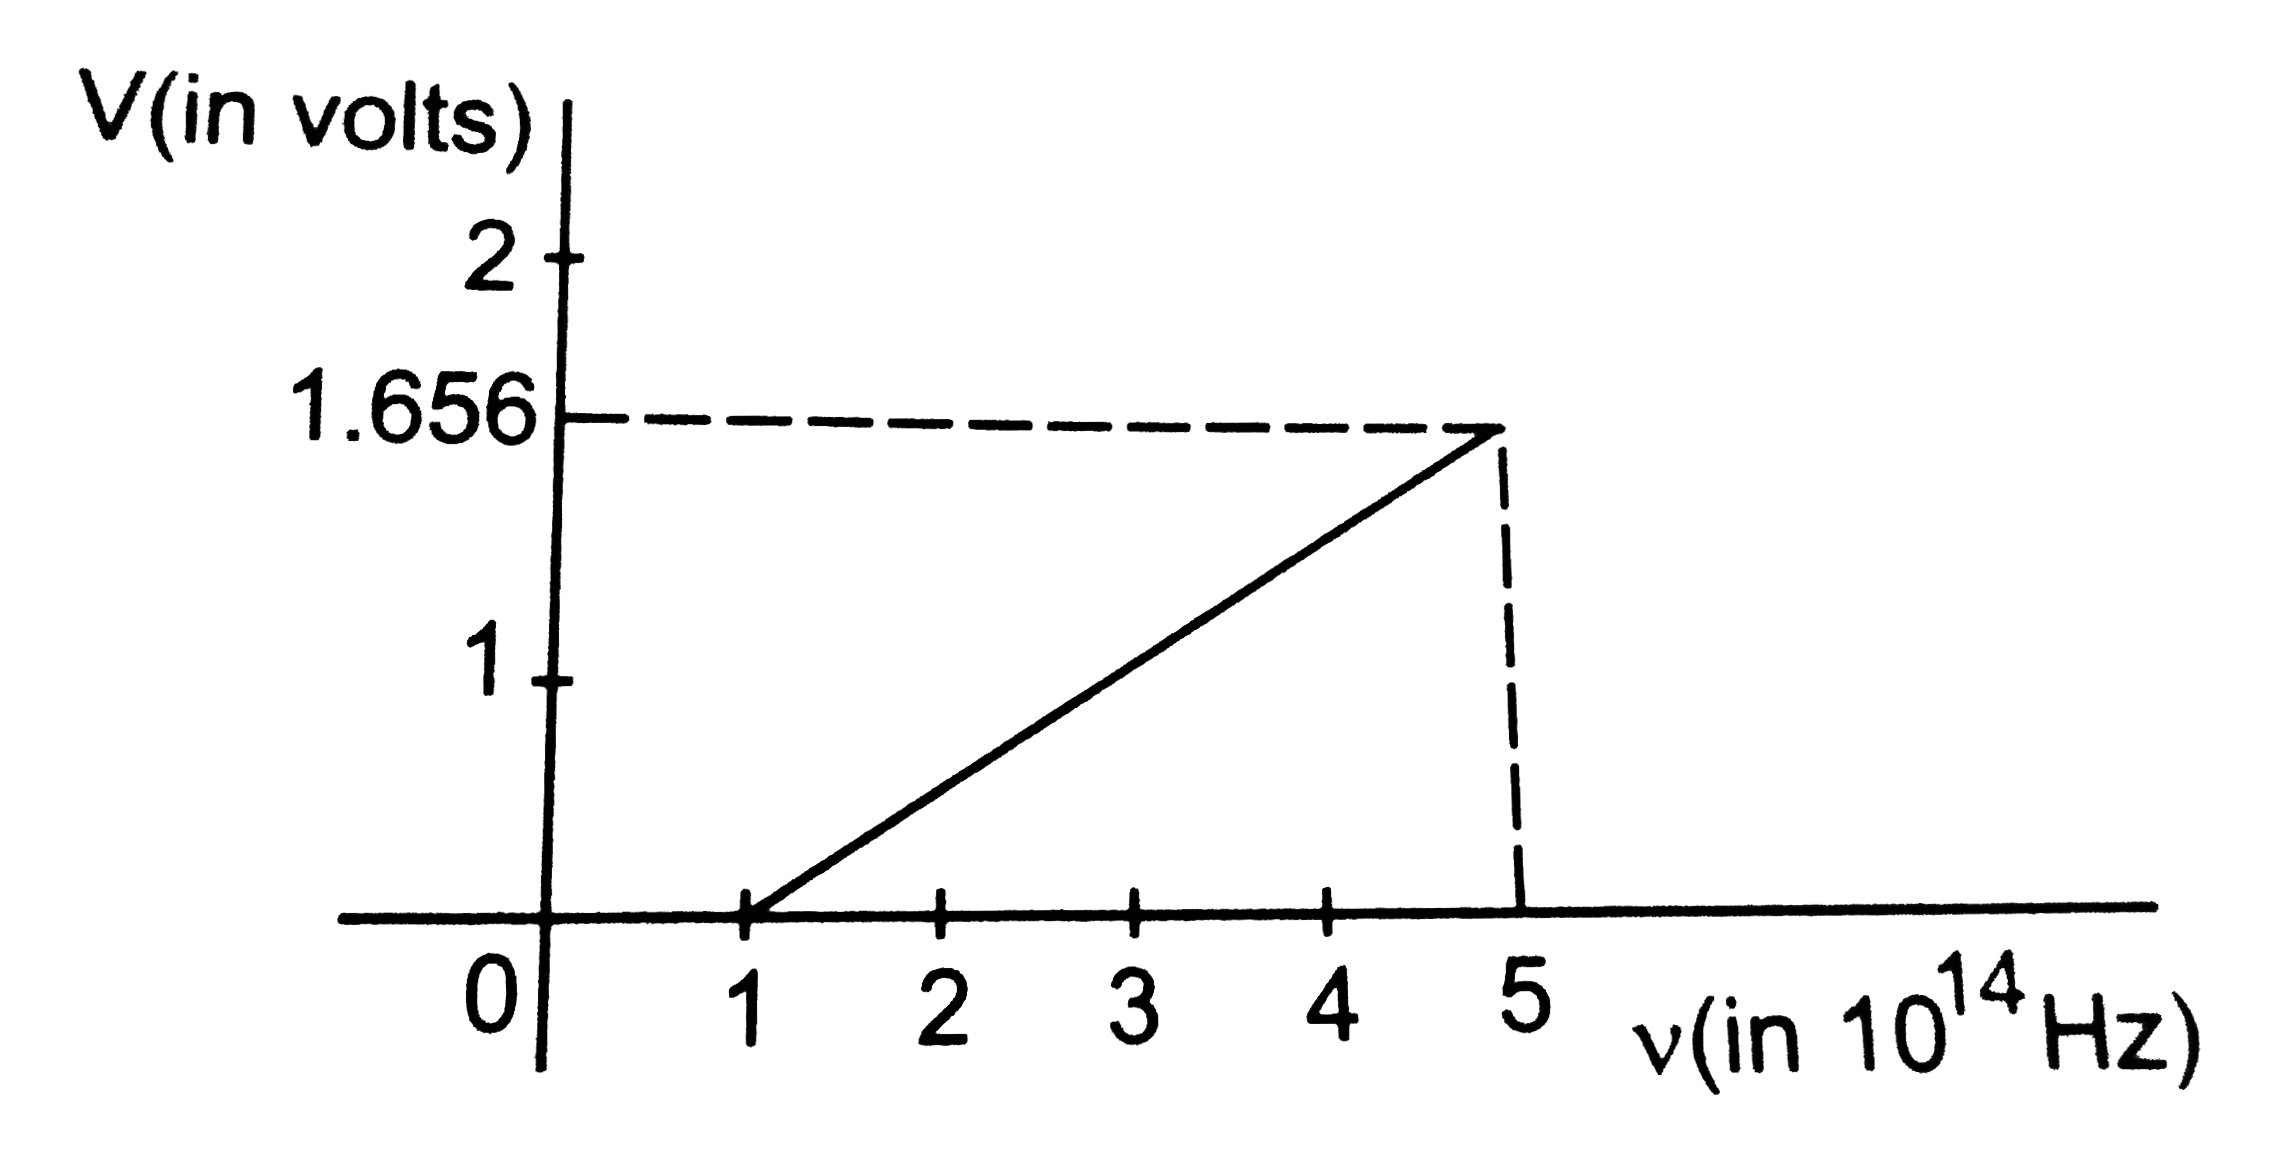
View SolutionFigure is the plot of the stopping potential versus the frequency of the light used in an experiment on photoelectric effect. Find (a) the ratio h/e and (b) the work function.
View SolutionIn an experiment of photo-electric effect, the graph of maximum kinetic energy Ek of the emitted photoelectrons versus the frequency v of the incident light is a straight line AB as shown in figure below :
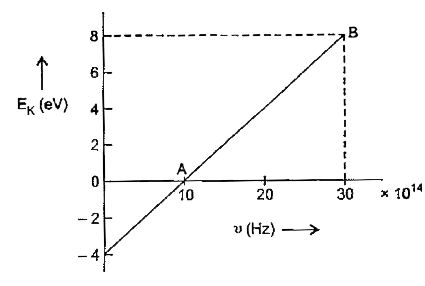
Stopping potential for the photoelectrons emitted by the light of frequency
v=30×1014Hz
View Solution
