Among the four graphs shown in the figure there is only one graph for which average velocity over the time interval (0,T) can vanish for a suitably chosen T. Which one is it ?


The correct Answer is:(b)
To determine which graph allows the average velocity over the time interval (0, T) to vanish for a suitably chosen T, we can follow these steps:
1. Understand Average Velocity:
- Average velocity (v_avg) is defined as the total displacement (Δx) divided by the total time (Δt). Mathematically, it is given by:
vavg=ΔxΔt
2. Identify Displacement:
- Displacement is the difference between the final position and the initial position. For the average velocity to be zero, the total displacement must be zero.
3. Analyze Each Graph:
- We need to examine the four graphs provided to see which one can yield a total displacement of zero over some time interval (0, T).
4. Graph A:
- If the graph shows a continuous increase in displacement, the average velocity cannot be zero since the displacement is always positive.
5. Graph B:
- If the graph has segments where the object moves forward and then returns to the starting point, it can have a total displacement of zero. This means there are two times (t1 and t2) where the object has the same displacement, allowing for a zero average velocity.
6. Graph C:
- If this graph shows a continuous increase or decrease without returning to the starting point, the average velocity cannot be zero.
7. Graph D:
- Similar to Graph A, if there is no point where the displacement returns to zero, the average velocity will not vanish.
8. Conclusion:
- After analyzing the graphs, we conclude that Graph B is the only graph where the average velocity can vanish for a suitably chosen T, as it allows for a scenario where the total displacement is zero.
Final Answer:
The correct graph is Graph B.
- Average velocity (v_avg) is defined as the total displacement (Δx) divided by the total time (Δt). Mathematically, it is given by:
vavg=ΔxΔt
- Displacement is the difference between the final position and the initial position. For the average velocity to be zero, the total displacement must be zero.
- We need to examine the four graphs provided to see which one can yield a total displacement of zero over some time interval (0, T).
- If the graph shows a continuous increase in displacement, the average velocity cannot be zero since the displacement is always positive.
- If the graph has segments where the object moves forward and then returns to the starting point, it can have a total displacement of zero. This means there are two times (t1 and t2) where the object has the same displacement, allowing for a zero average velocity.
- If this graph shows a continuous increase or decrease without returning to the starting point, the average velocity cannot be zero.
- Similar to Graph A, if there is no point where the displacement returns to zero, the average velocity will not vanish.
- After analyzing the graphs, we conclude that Graph B is the only graph where the average velocity can vanish for a suitably chosen T, as it allows for a scenario where the total displacement is zero.
The correct graph is Graph B.
Topper's Solved these Questions
- MOTION IN A STRAIGHT LINEBOOK - NCERT FINGERTPS ENGLISHCHAPTER - MOTION IN A STRAIGHT LINEEXERCISE - ASSERTION AND REASON
15 Videos
- MOTION IN A STRAIGHT LINEBOOK - NCERT FINGERTPS ENGLISHCHAPTER - MOTION IN A STRAIGHT LINEEXERCISE - Higher Order Thinking Skills
10 Videos
- MOTION IN A STRAIGHT LINEBOOK - NCERT FINGERTPS ENGLISHCHAPTER - MOTION IN A STRAIGHT LINEEXERCISE - HOTS
10 Videos
- MOTION IN A PLANE BOOK - NCERT FINGERTPS ENGLISHCHAPTER - MOTION IN A PLANE EXERCISE - Assertion And Reason
15 Videos
- OSCILLATIONS BOOK - NCERT FINGERTPS ENGLISHCHAPTER - OSCILLATIONS EXERCISE - Assertion And Reason
15 Videos
Similar Questions
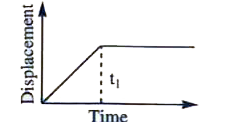
The x-t graph shown in figure represents

View SolutionThe x-t graph shown in figure represents.
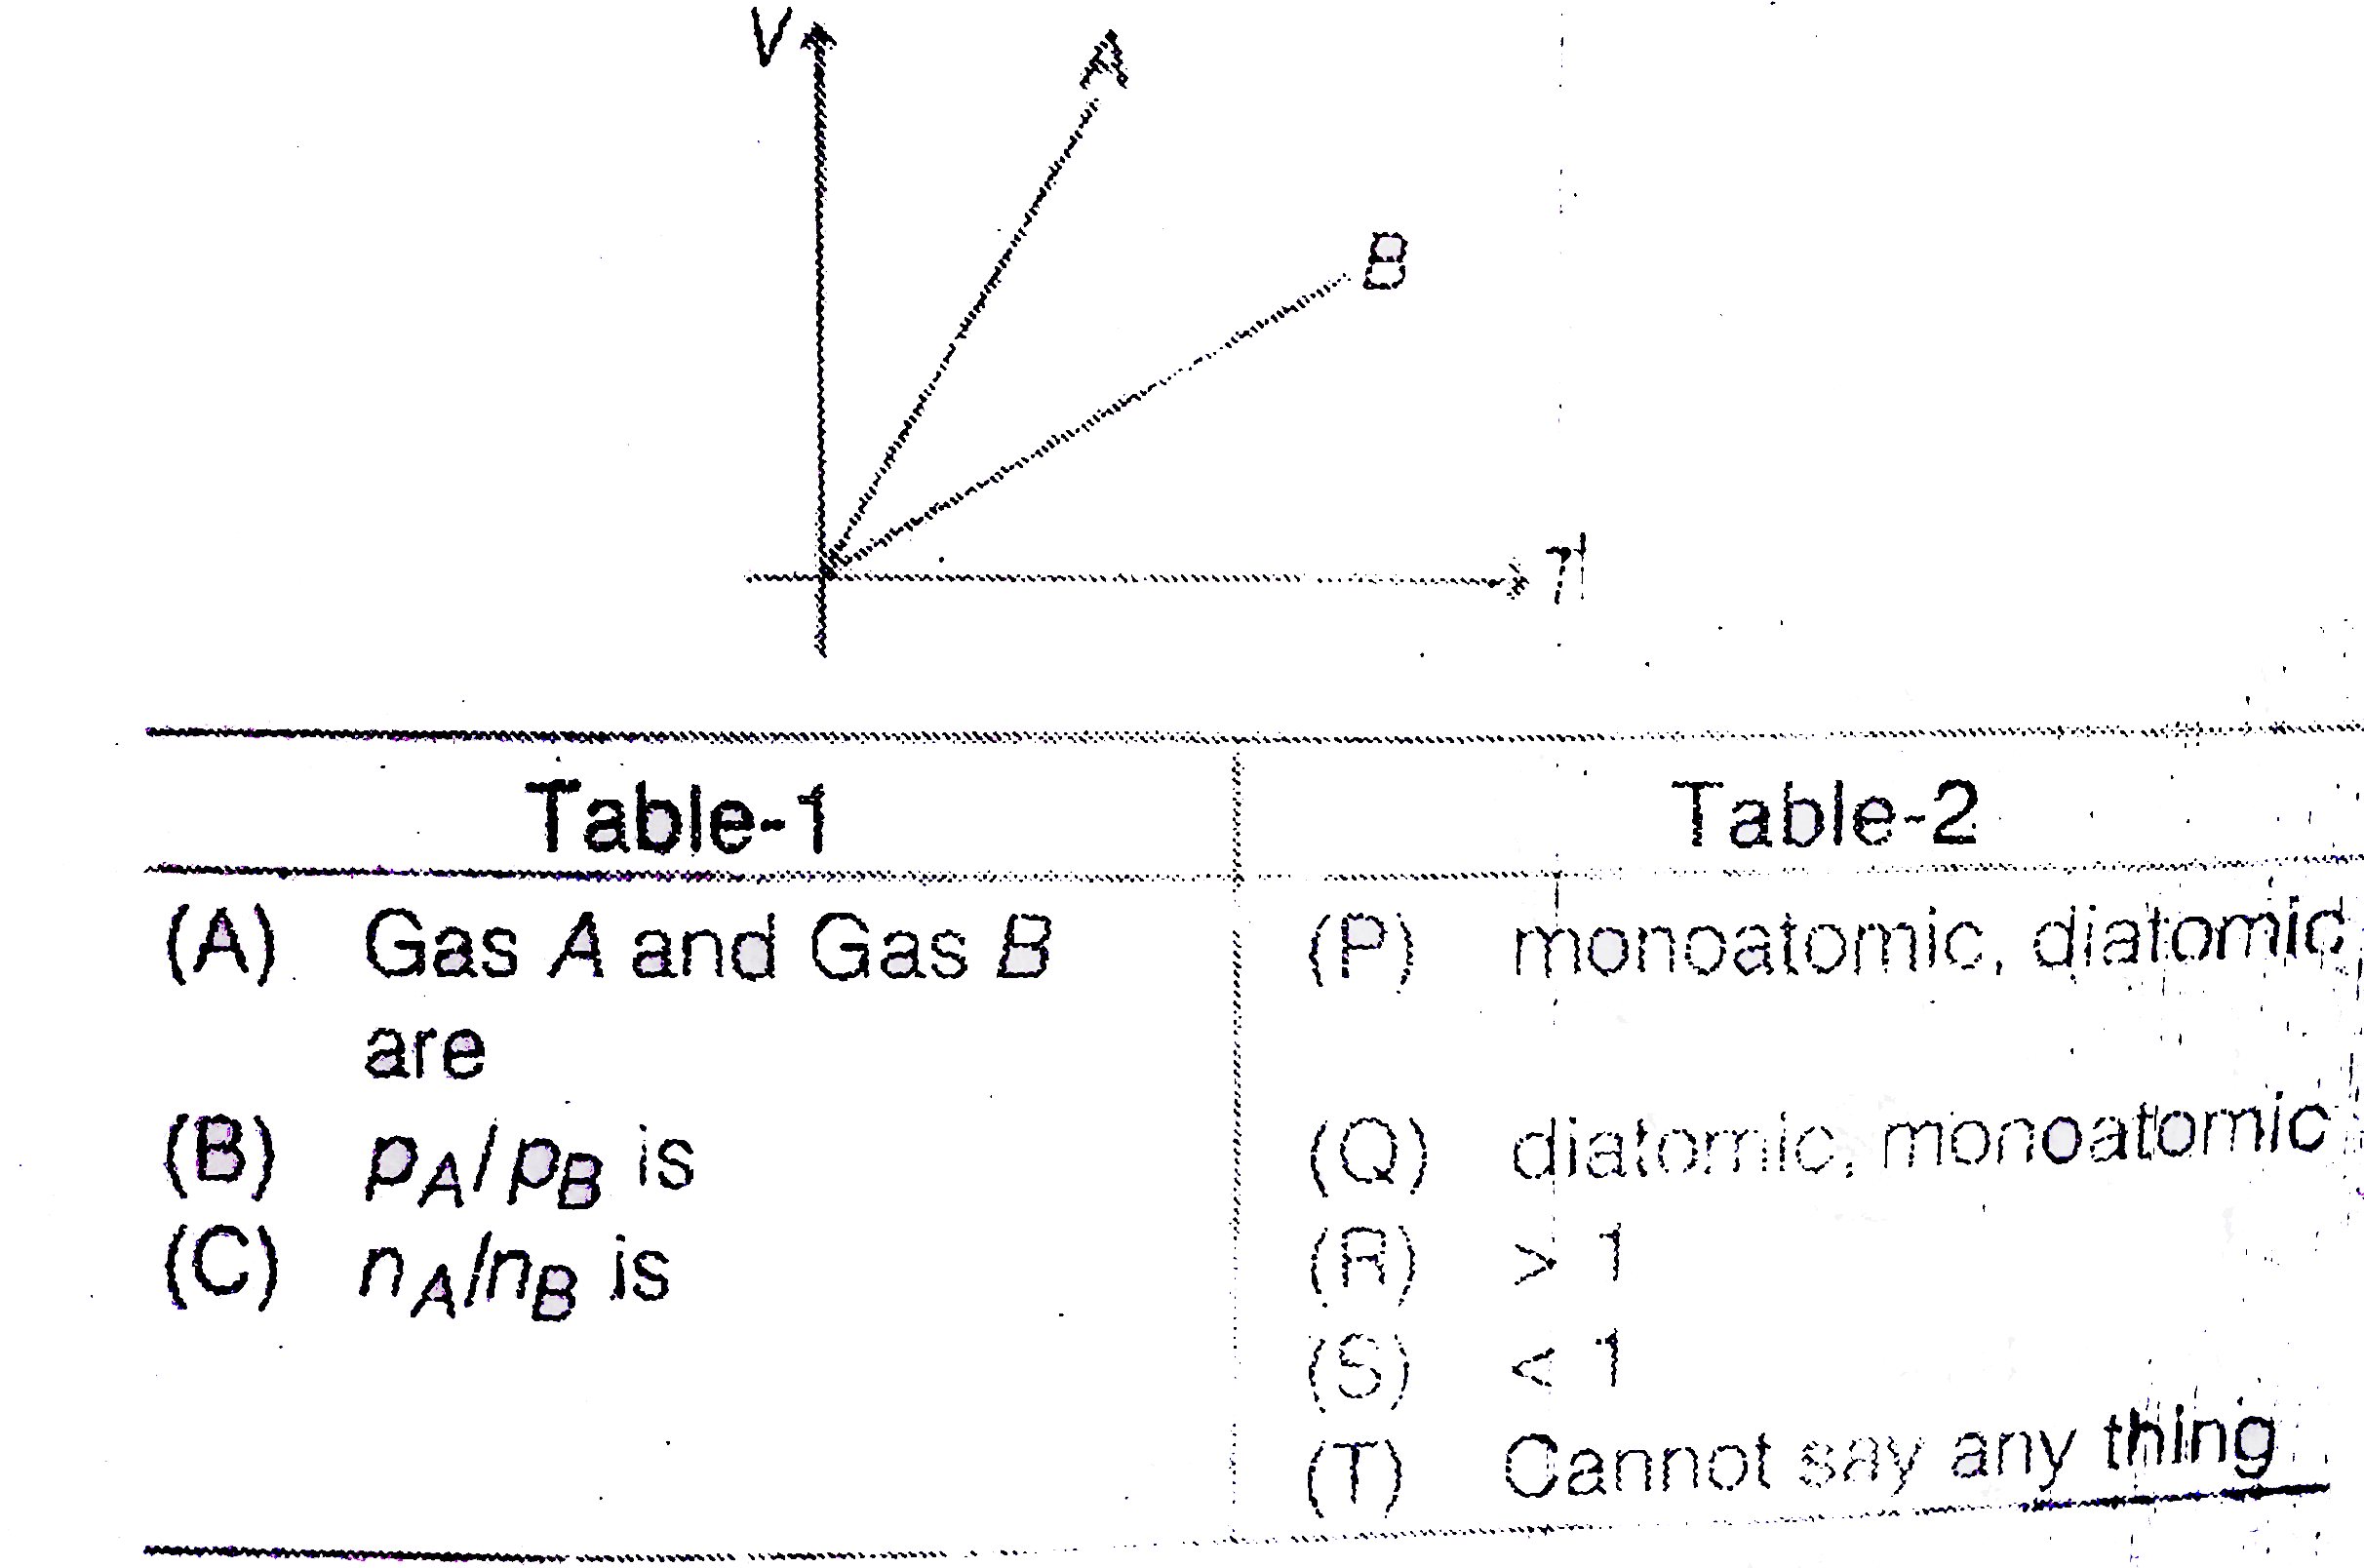
View SolutionIn the V-T graph shown in figure match the following.
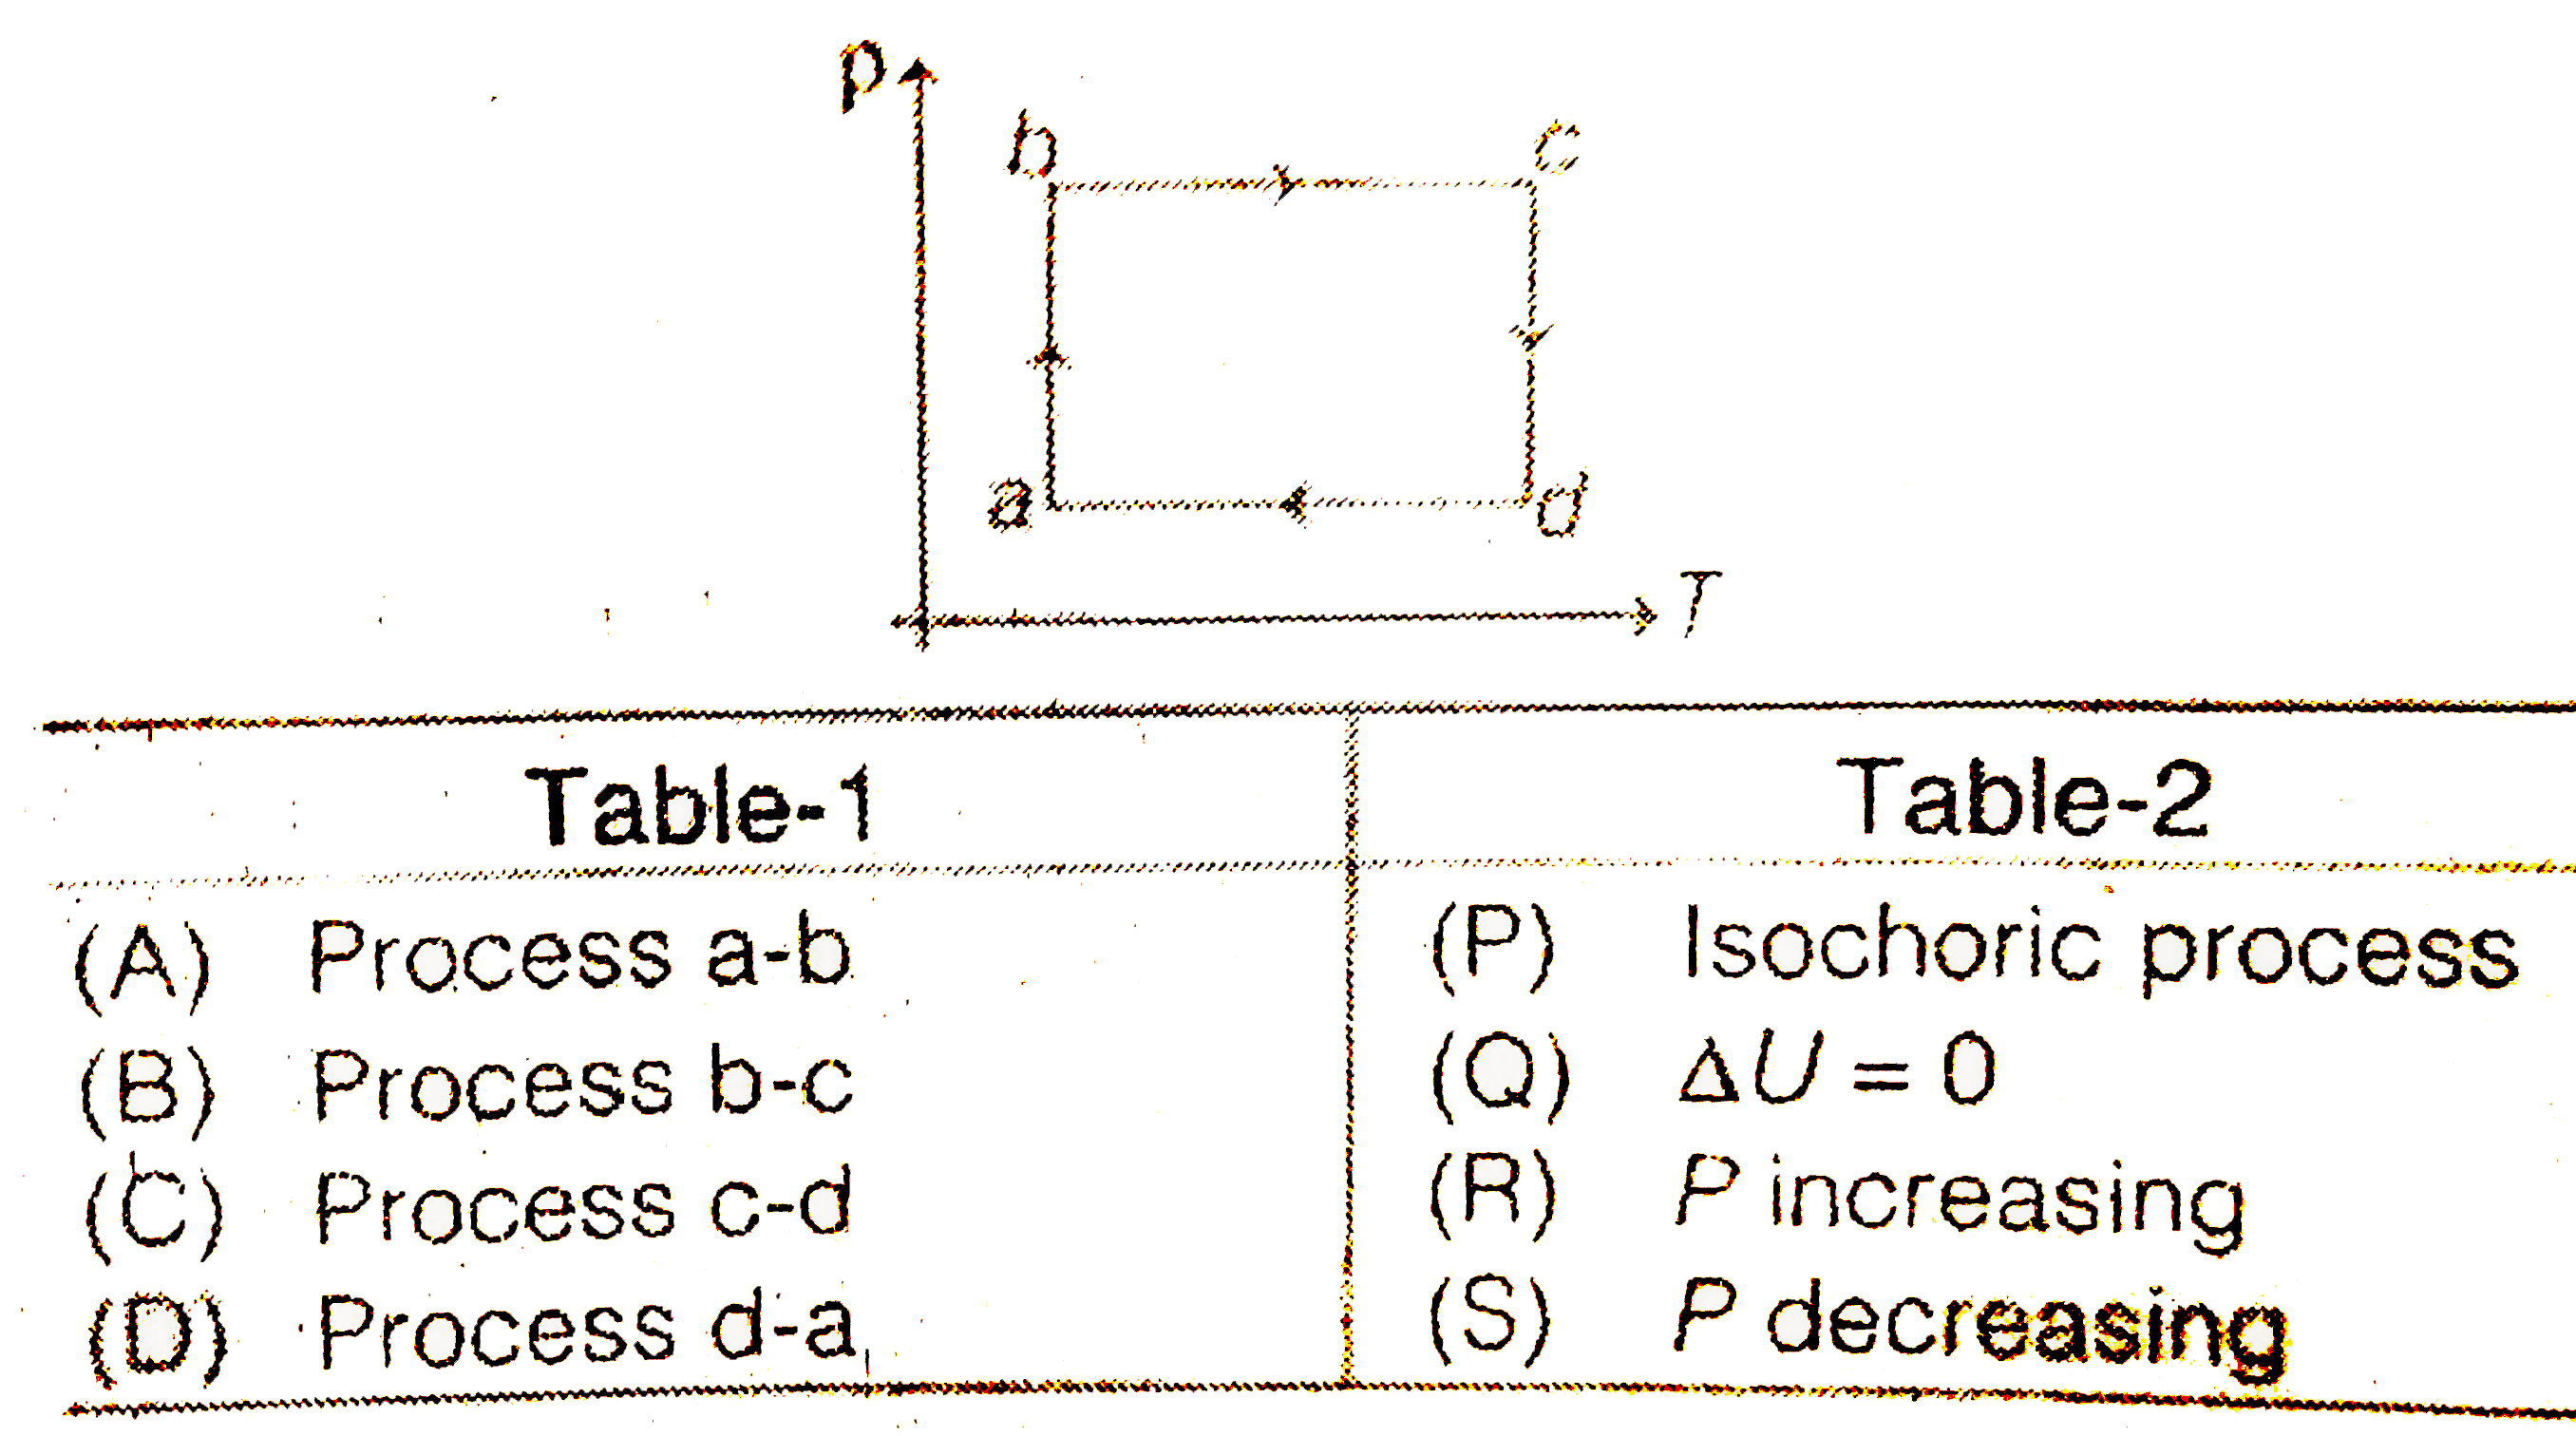
View SolutionIn the ρ-T graph shown in figure, match the following.
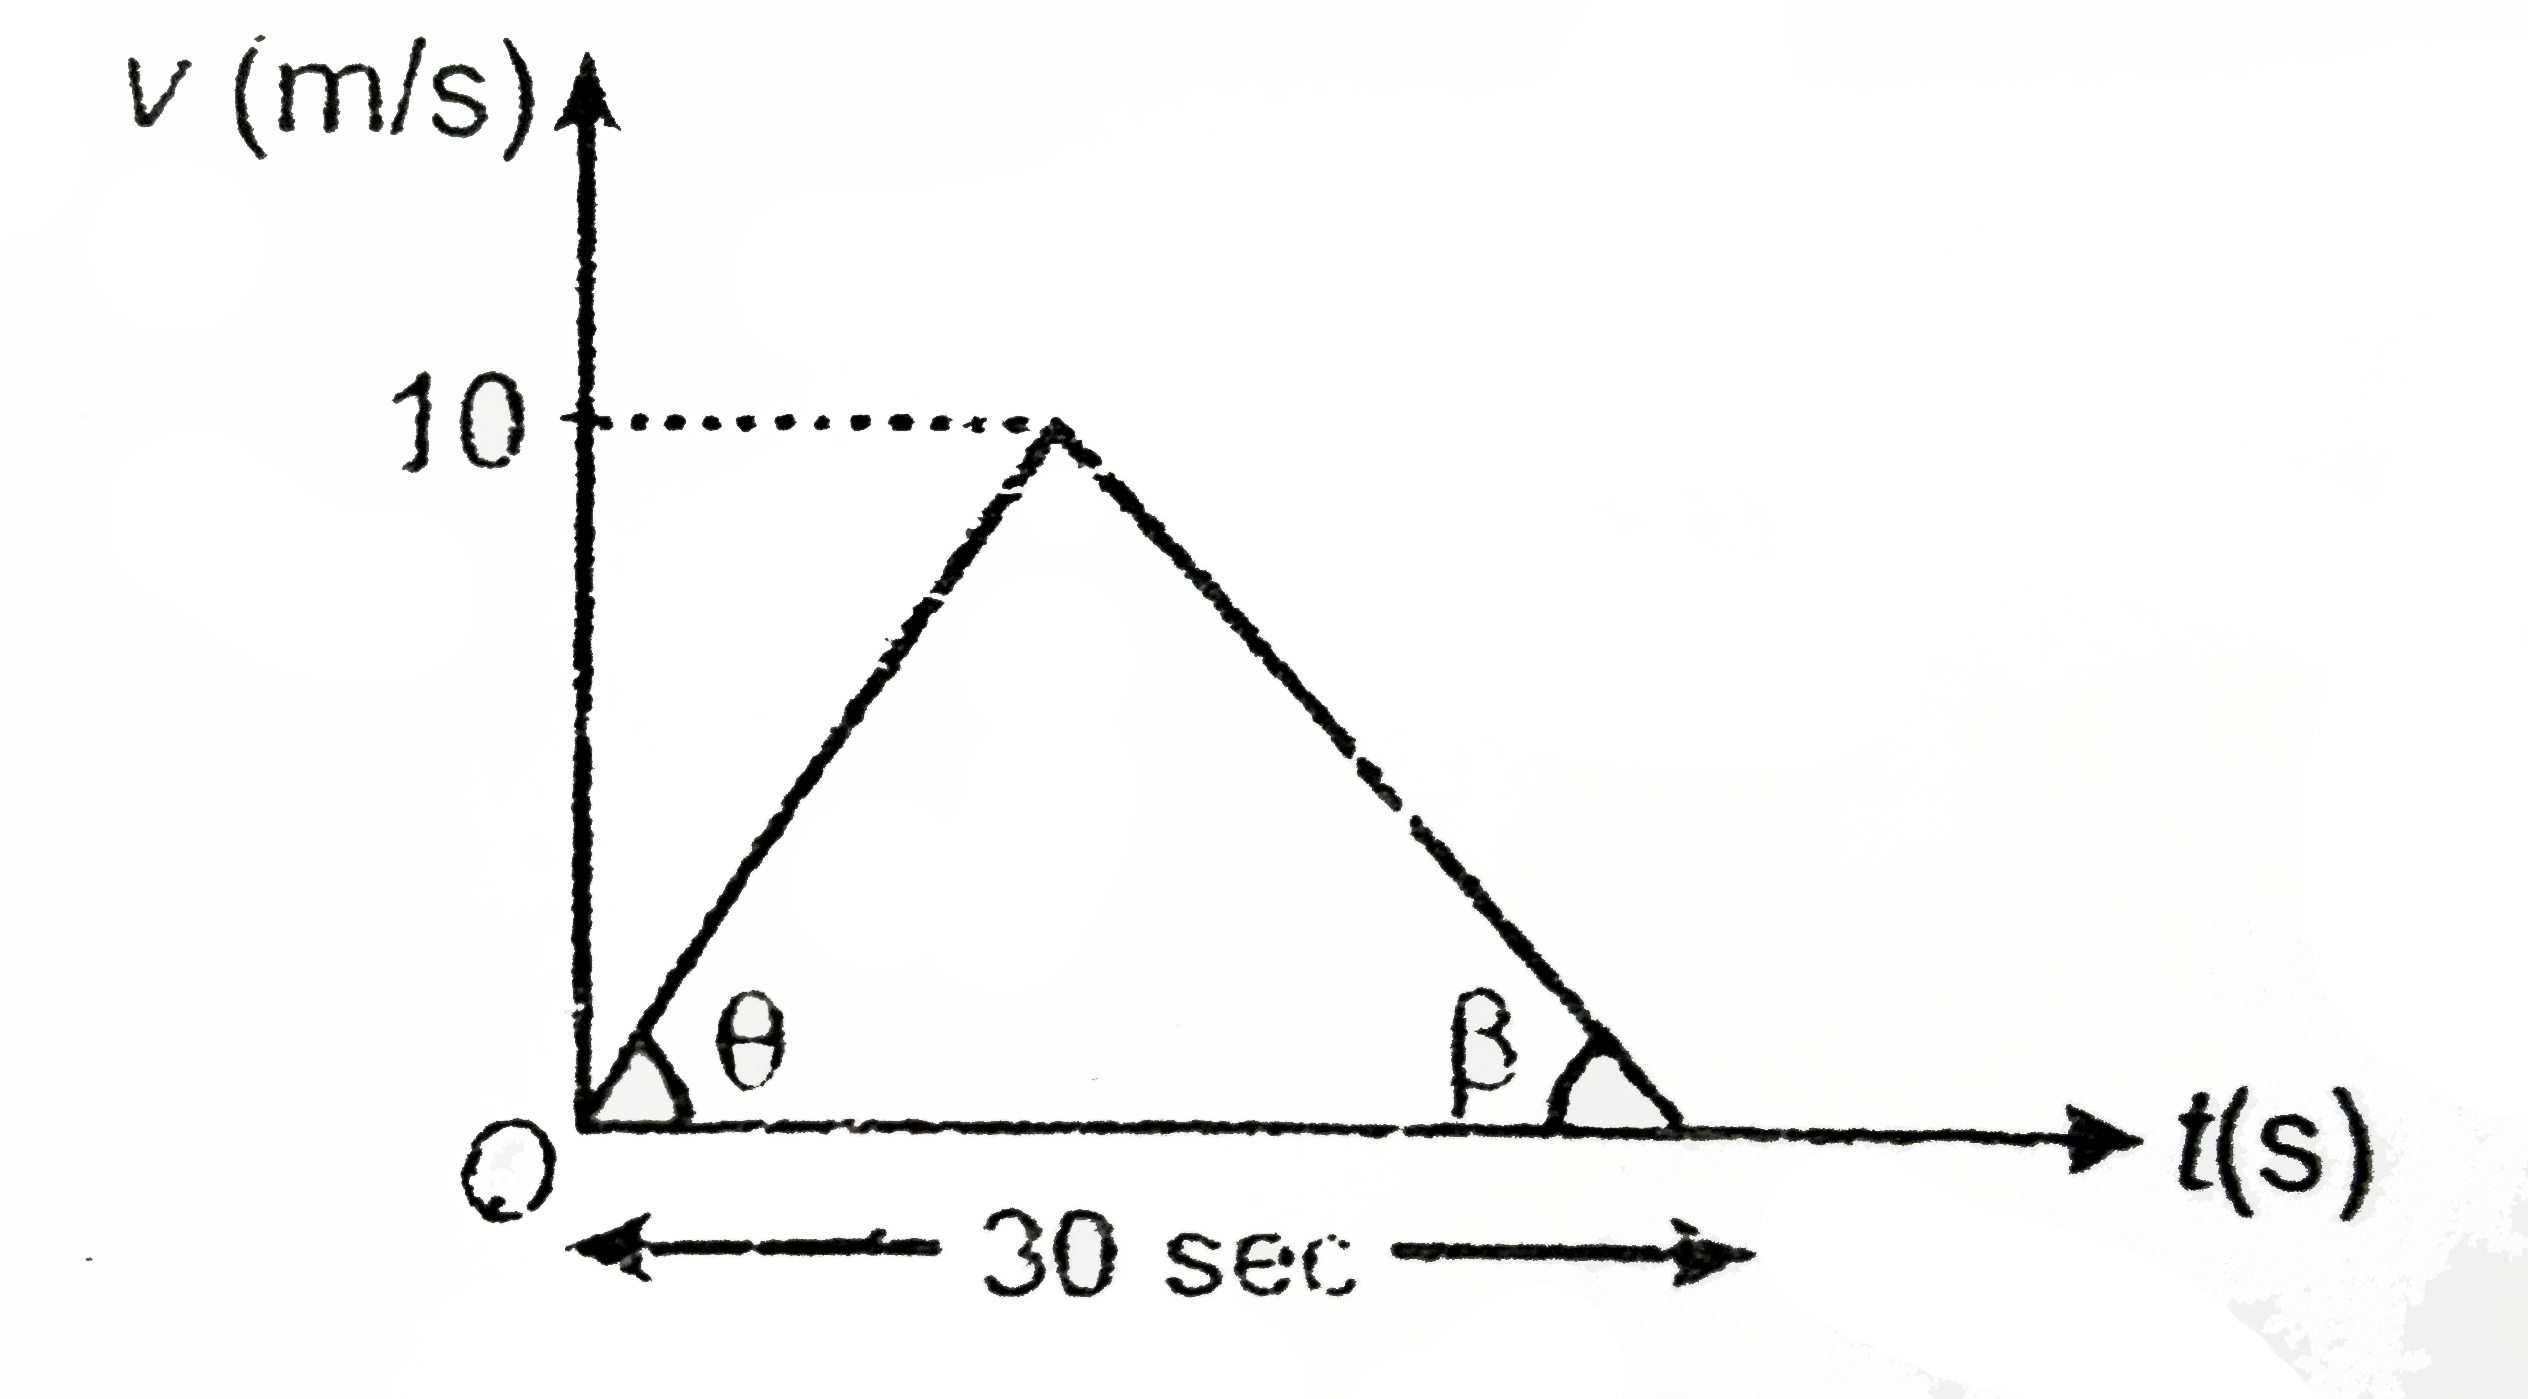
View SolutionA particle obeys the following v - t graph as shown. The average velocity over 30 s is
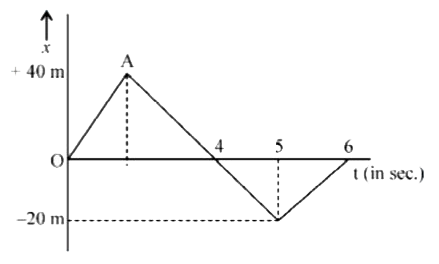
View Solutions-t graph of a particle in motion is shown in Fig. Calculate Average velocity
View SolutionThe a -t graph is shown in the figure. The maximum velocity attained by the body from rest will be

View Solution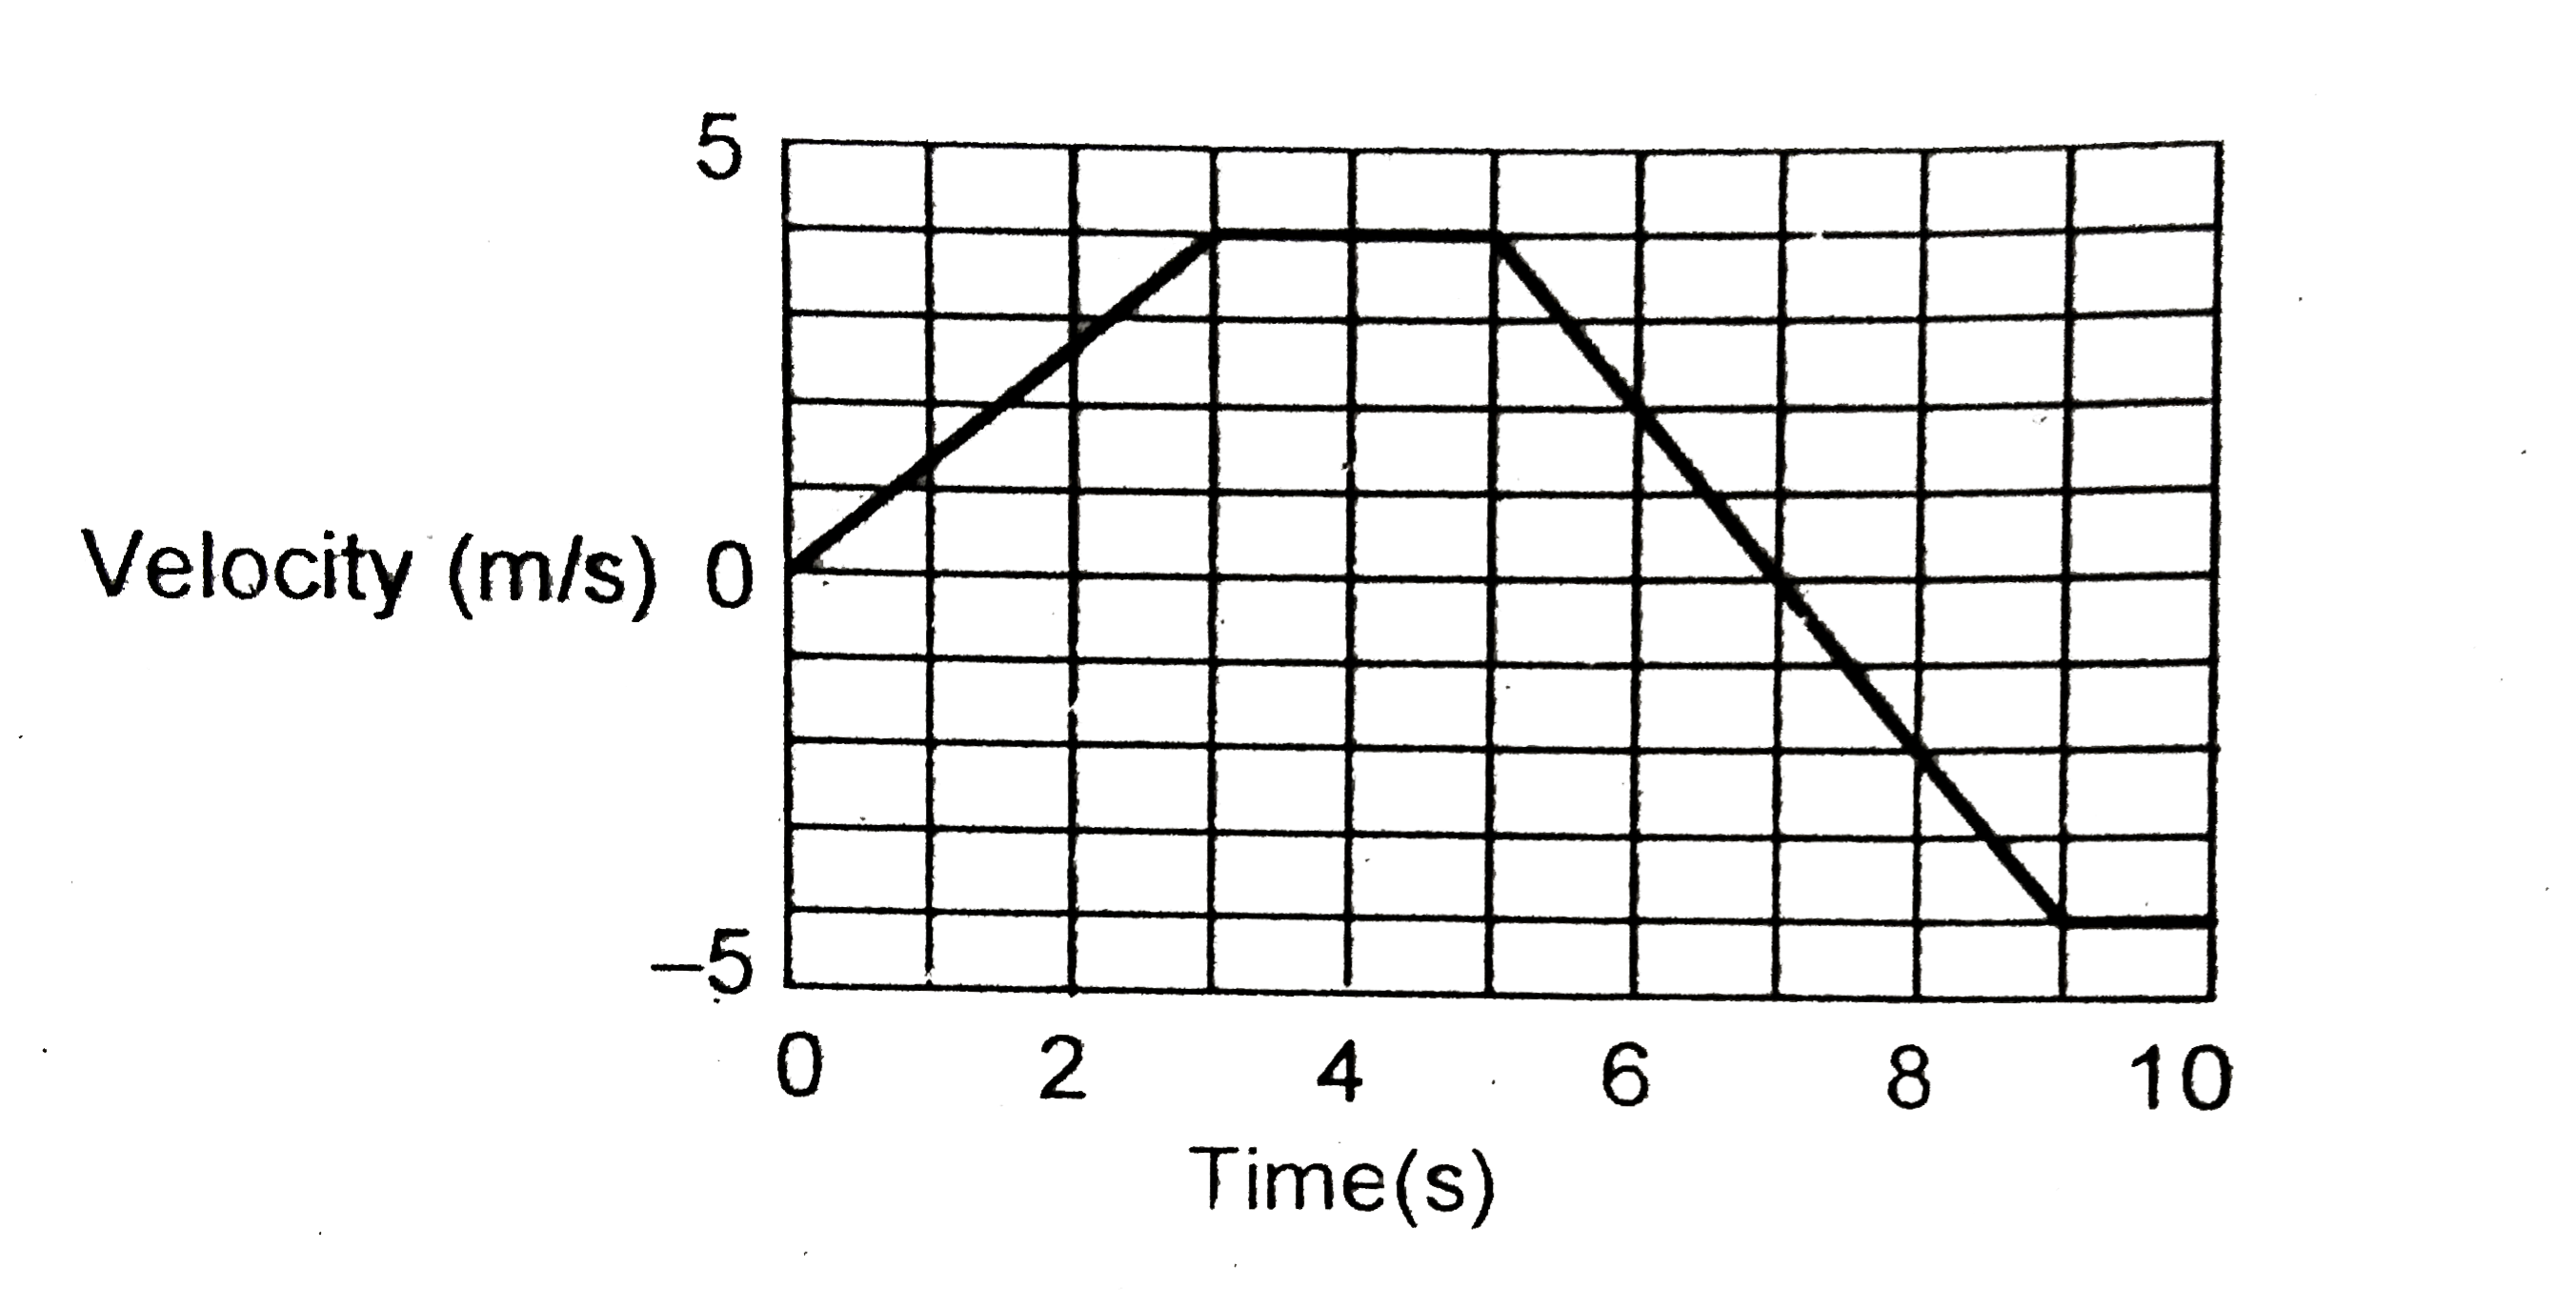
An object starts at the origin in a straight line. Its velocity versus time graph is shown in the figure. Which one of the following choices best gives the proper intervals (s) of time for which the object is moving away from the origin?
View SolutionFor which of the following graphs the average velocity of a particle moving along a straight line for time interval (0,t) must be negative−
View SolutionFor which of the following graphs the average velocity of a particl moving along a straight line for time interval (0,t) must be negative−
View Solution
