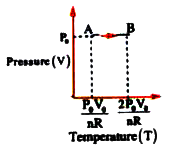
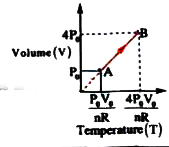
Draws the P-Tand V-T diagrams for an isobaric process of expansion, corresponding to n moles of an ideal gas at a pressure P0 from V0 to 2V0 From the equation state PV = nRT

we haveV=(nRPn)TorV∝T
AtV=V0=T1=P0V0nRandatV=2V0,T1=2P0V0nR
For the graph of P versus T the variation is a straight line normal to the pressure axis, the temperature varying from T1 to T2 as shown figure.
From the graph of V versus T, the equation V=(nRp0)T
(or) V = KT shows that the volume varies directly, as the temperature (Charles. law). So, the graph is a straight line inclined to the (V T) axis, and passingthrough the origin (when produced) as shown in figure.

Topper's Solved these Questions
- THERMODYNAMICSBOOK - AAKASH SERIESCHAPTER - THERMODYNAMICSEXERCISE - TEST YOUR SELF
17 Videos
- THERMODYNAMICSBOOK - AAKASH SERIESCHAPTER - THERMODYNAMICSEXERCISE - SHORT ANSWER TYPE QUESTIONS
8 Videos
- THERMODYNAMICSBOOK - AAKASH SERIESCHAPTER - THERMODYNAMICSEXERCISE - ADDITIONAL PRACTICE EXERCISE (PRACTICE SHEET ((ADVANCED) INTEGER/SUBJECTIVE TYPE QUESTIONS))
11 Videos
- THERMAL PROPERTIES OF MATTERBOOK - AAKASH SERIESCHAPTER - THERMAL PROPERTIES OF MATTEREXERCISE - ADDITIONAL PRACTICE EXERCISE (LEVEL - II) PRACTICE SHEET (ADVANCED) Integer/Subjective Type Questions
2 Videos
- THERMOMETRY BOOK - AAKASH SERIESCHAPTER - THERMOMETRY EXERCISE - Numerical Exercise (LEVEL- 1)
11 Videos
Similar Questions
Draw the P-T and V-T diagrams for an isobaric process of expansion, corresponding to n moles of an ideal gas at pressure P0 from V0 to 2V0
View SolutionDraw the P-T and V-T diagrams for an isobabaric process of expansion, corresponding to n moles of an ideal gas at pressure P0 from V0 to 2V0
View Solution
Knowledge Check
Thermal coefficient of volume expansion at constant pressure for an ideal gas sample of n moles having pressure P0, volume V0, and temperature T0 is
ARP0V0BP0V0RC1T0D1nT0An ideal monoatomic gas indergoes a pressure pVn=constant. The adiabatic constant for gas is y. During the process, volume of gas increases from V0 to rV0 and pressure decreases for p0 to p02r Based on above information, answer the following questios :
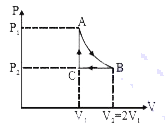
The of n isA2logrlog2rBlog2r3Clog2rlogrDlog2r3logrn mole a perfect gas undergoes a cyclic process ABCA (see figure) consisting of the following processes.
A→B: Isothermal expansion at temperature T so that the volume is doubled from V1 to V2=2V1 and pressure changes from P1 to P2
B→C : Isobaric compression at pressure P2 to initial volume V1
C→A : Isochoric change leading to change of pressure from P2 toP1 .
Total work done in the complete cycle ABCA is :
 A0BnRT(ln2+12)CnRTln2DnRT(ln2−12)
Draw the P-T and V-T diagrams of an isochoric process of n moles an ideal gas from pressure P0 volume V0 to pressure 4P0, indicating the pressures and temperatures of the gas in the initial and the final states.
View SolutionDraw the P-T and V-T diagrams of an isochoric process of n moles an ideal gas from pressure P0 volume V0 to pressure 4P0, indicating the pressures and temperatures of the gas in the initial and the final states.
View SolutionIf n moles of an ideal gas undergoes a thermodynamic process P=P0[1+(2V0V)2]−1, then change in temperature of the gas when volume is changed from V=V0 to V=2V0 is [Assume P0 and V0 are constants]
View SolutionAn ideal gaseous sample at initial state I (P0,V0,T0) is allowed to expand to volume 2V0 using two different process, in the first process the equation of process is PV2=K1 and in second process the equation of the process is PV=K2.Then
View SolutionIf n moles of an ideal gas are expanded is isothermally and reversibly from an initial state in which it has pressure p1 and volume V1 to the final state of volume V2 and pressure P2, then
View Solution
