Draw the P-T and V-T diagrams for an isobabaric process of expansion, corresponding to n moles of an ideal gas at pressure P0 from V0 to 2V0
To solve the problem of drawing the P-T (Pressure-Temperature) and V-T (Volume-Temperature) diagrams for an isobaric process of expansion of an ideal gas, we will follow these steps:
1. Understand the Isobaric Process:
- An isobaric process is one in which the pressure remains constant. In this case, the pressure is denoted as P0.
2. Identify Initial and Final States:
- The initial volume V0 and the final volume after expansion is 2V0.
- The initial temperature is denoted as T0 and we need to find the final temperature T2.
3. Use the Ideal Gas Law:
- For an ideal gas, the relationship between pressure, volume, and temperature can be expressed as:
V1T1=V2T2
- Here, V1=V0, T1=T0, V2=2V0.
4. Calculate the Final Temperature:
- Rearranging the equation gives:
T2=V2⋅T1V1
- Substituting the values:
T2=2V0⋅T0V0=2T0
5. Draw the P-T Diagram:
- On the P-T diagram, plot pressure P on the y-axis and temperature T on the x-axis.
- Since pressure is constant at P0, draw a horizontal line from T0 to 2T0 at P=P0.
6. Draw the V-T Diagram:
- On the V-T diagram, plot volume V on the y-axis and temperature T on the x-axis.
- Mark the points: (T0,V0) and (2T0,2V0).
- Draw a straight line connecting these two points.
Final Diagrams:
- P-T Diagram: A horizontal line at P=P0 from T0 to 2T0.
- V-T Diagram: A straight line from (T0,V0) to (2T0,2V0).
- An isobaric process is one in which the pressure remains constant. In this case, the pressure is denoted as P0.
- The initial volume V0 and the final volume after expansion is 2V0.
- The initial temperature is denoted as T0 and we need to find the final temperature T2.
- For an ideal gas, the relationship between pressure, volume, and temperature can be expressed as:
V1T1=V2T2
- Here, V1=V0, T1=T0, V2=2V0.
- Rearranging the equation gives:
T2=V2⋅T1V1
- Substituting the values:
T2=2V0⋅T0V0=2T0
- On the P-T diagram, plot pressure P on the y-axis and temperature T on the x-axis.
- Since pressure is constant at P0, draw a horizontal line from T0 to 2T0 at P=P0.
- On the V-T diagram, plot volume V on the y-axis and temperature T on the x-axis.
- Mark the points: (T0,V0) and (2T0,2V0).
- Draw a straight line connecting these two points.
- P-T Diagram: A horizontal line at P=P0 from T0 to 2T0.
- V-T Diagram: A straight line from (T0,V0) to (2T0,2V0).
Topper's Solved these Questions
- KINETIC THEORY OF GASES AND FIRST LAW OF THERMODYNAMICSBook:CENGAGE PHYSICS ENGLISHChapter:KINETIC THEORY OF GASES AND FIRST LAW OF THERMODYNAMICSExercise:Solved Examples
Explore 14 Videos
- KINETIC THEORY OF GASES AND FIRST LAW OF THERMODYNAMICSBook:CENGAGE PHYSICS ENGLISHChapter:KINETIC THEORY OF GASES AND FIRST LAW OF THERMODYNAMICSExercise:Exercise 2.1
Explore 20 Videos
- KINETIC THEORY OF GASESBook:CENGAGE PHYSICS ENGLISHChapter:KINETIC THEORY OF GASESExercise:Compression
Explore 2 Videos
- LINEAR AND ANGULAR SIMPLE HARMONIC MOTIONBook:CENGAGE PHYSICS ENGLISHChapter:LINEAR AND ANGULAR SIMPLE HARMONIC MOTIONExercise:Single correct anwer type
Explore 14 Videos
Similar Questions
Draw the P-T and V-T diagrams of an isochoric process of n moles an ideal gas from pressure P0 volume V0 to pressure 4P0, indicating the pressures and temperatures of the gas in the initial and the final states.
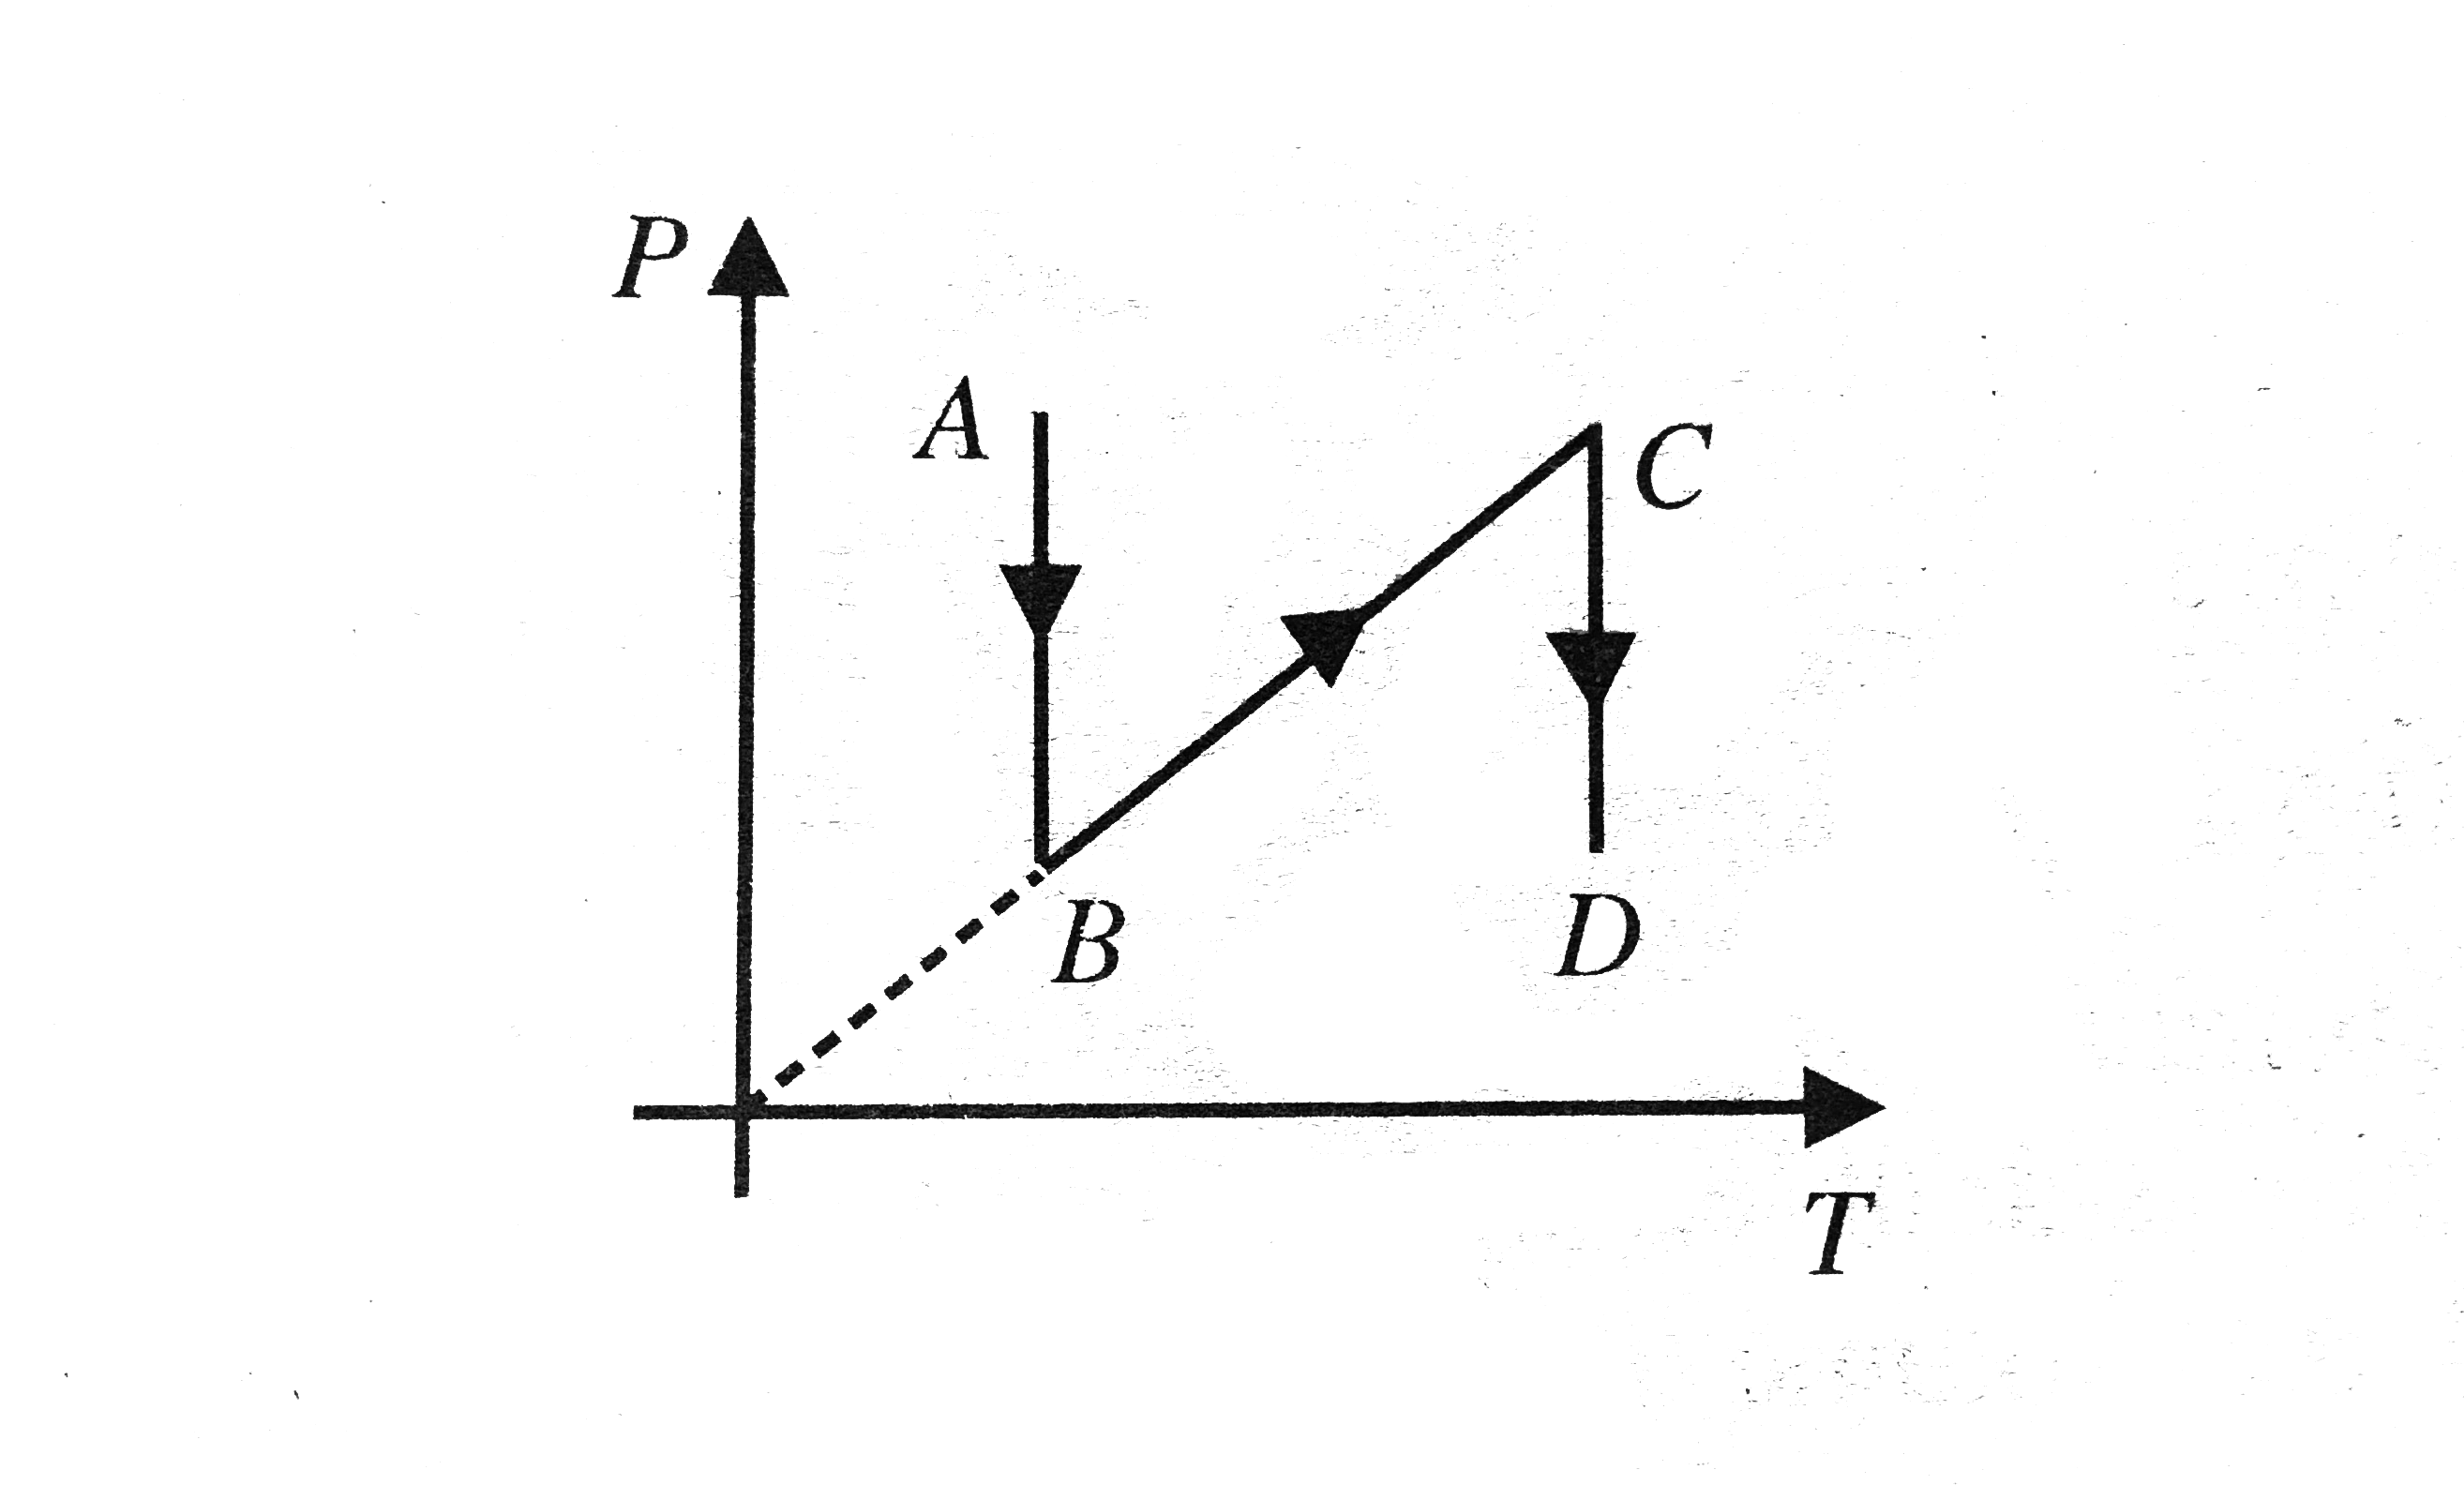
View SolutionP−T diagram is shown in Fig. Choose the corresponding V−T diagram.
View Solution
Knowledge Check
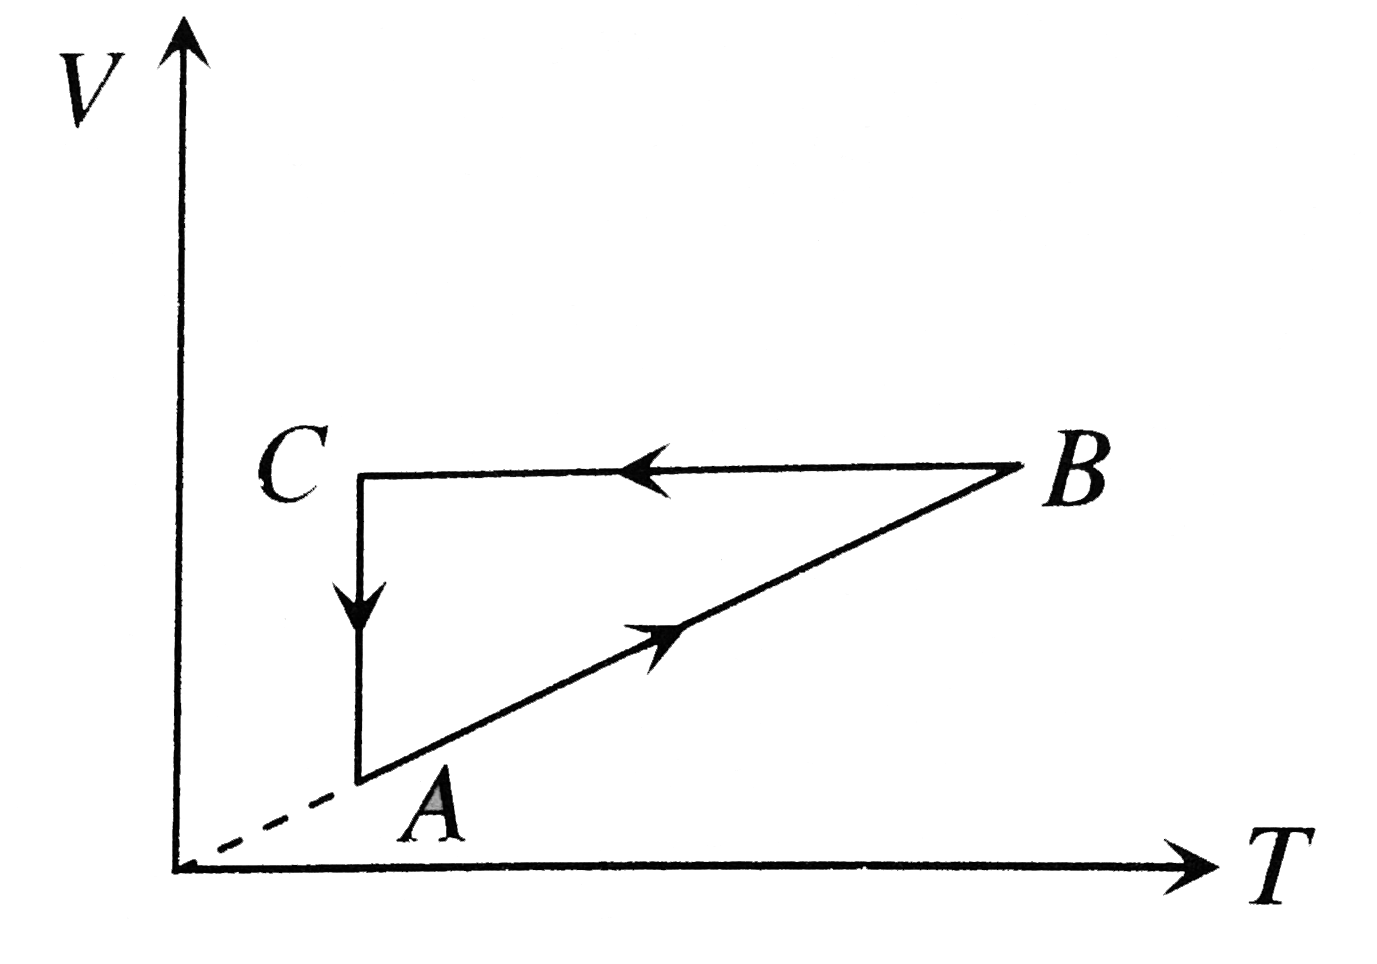
A cyclic process ABCA is shown in the V−T diagram process on the P−V
 A
A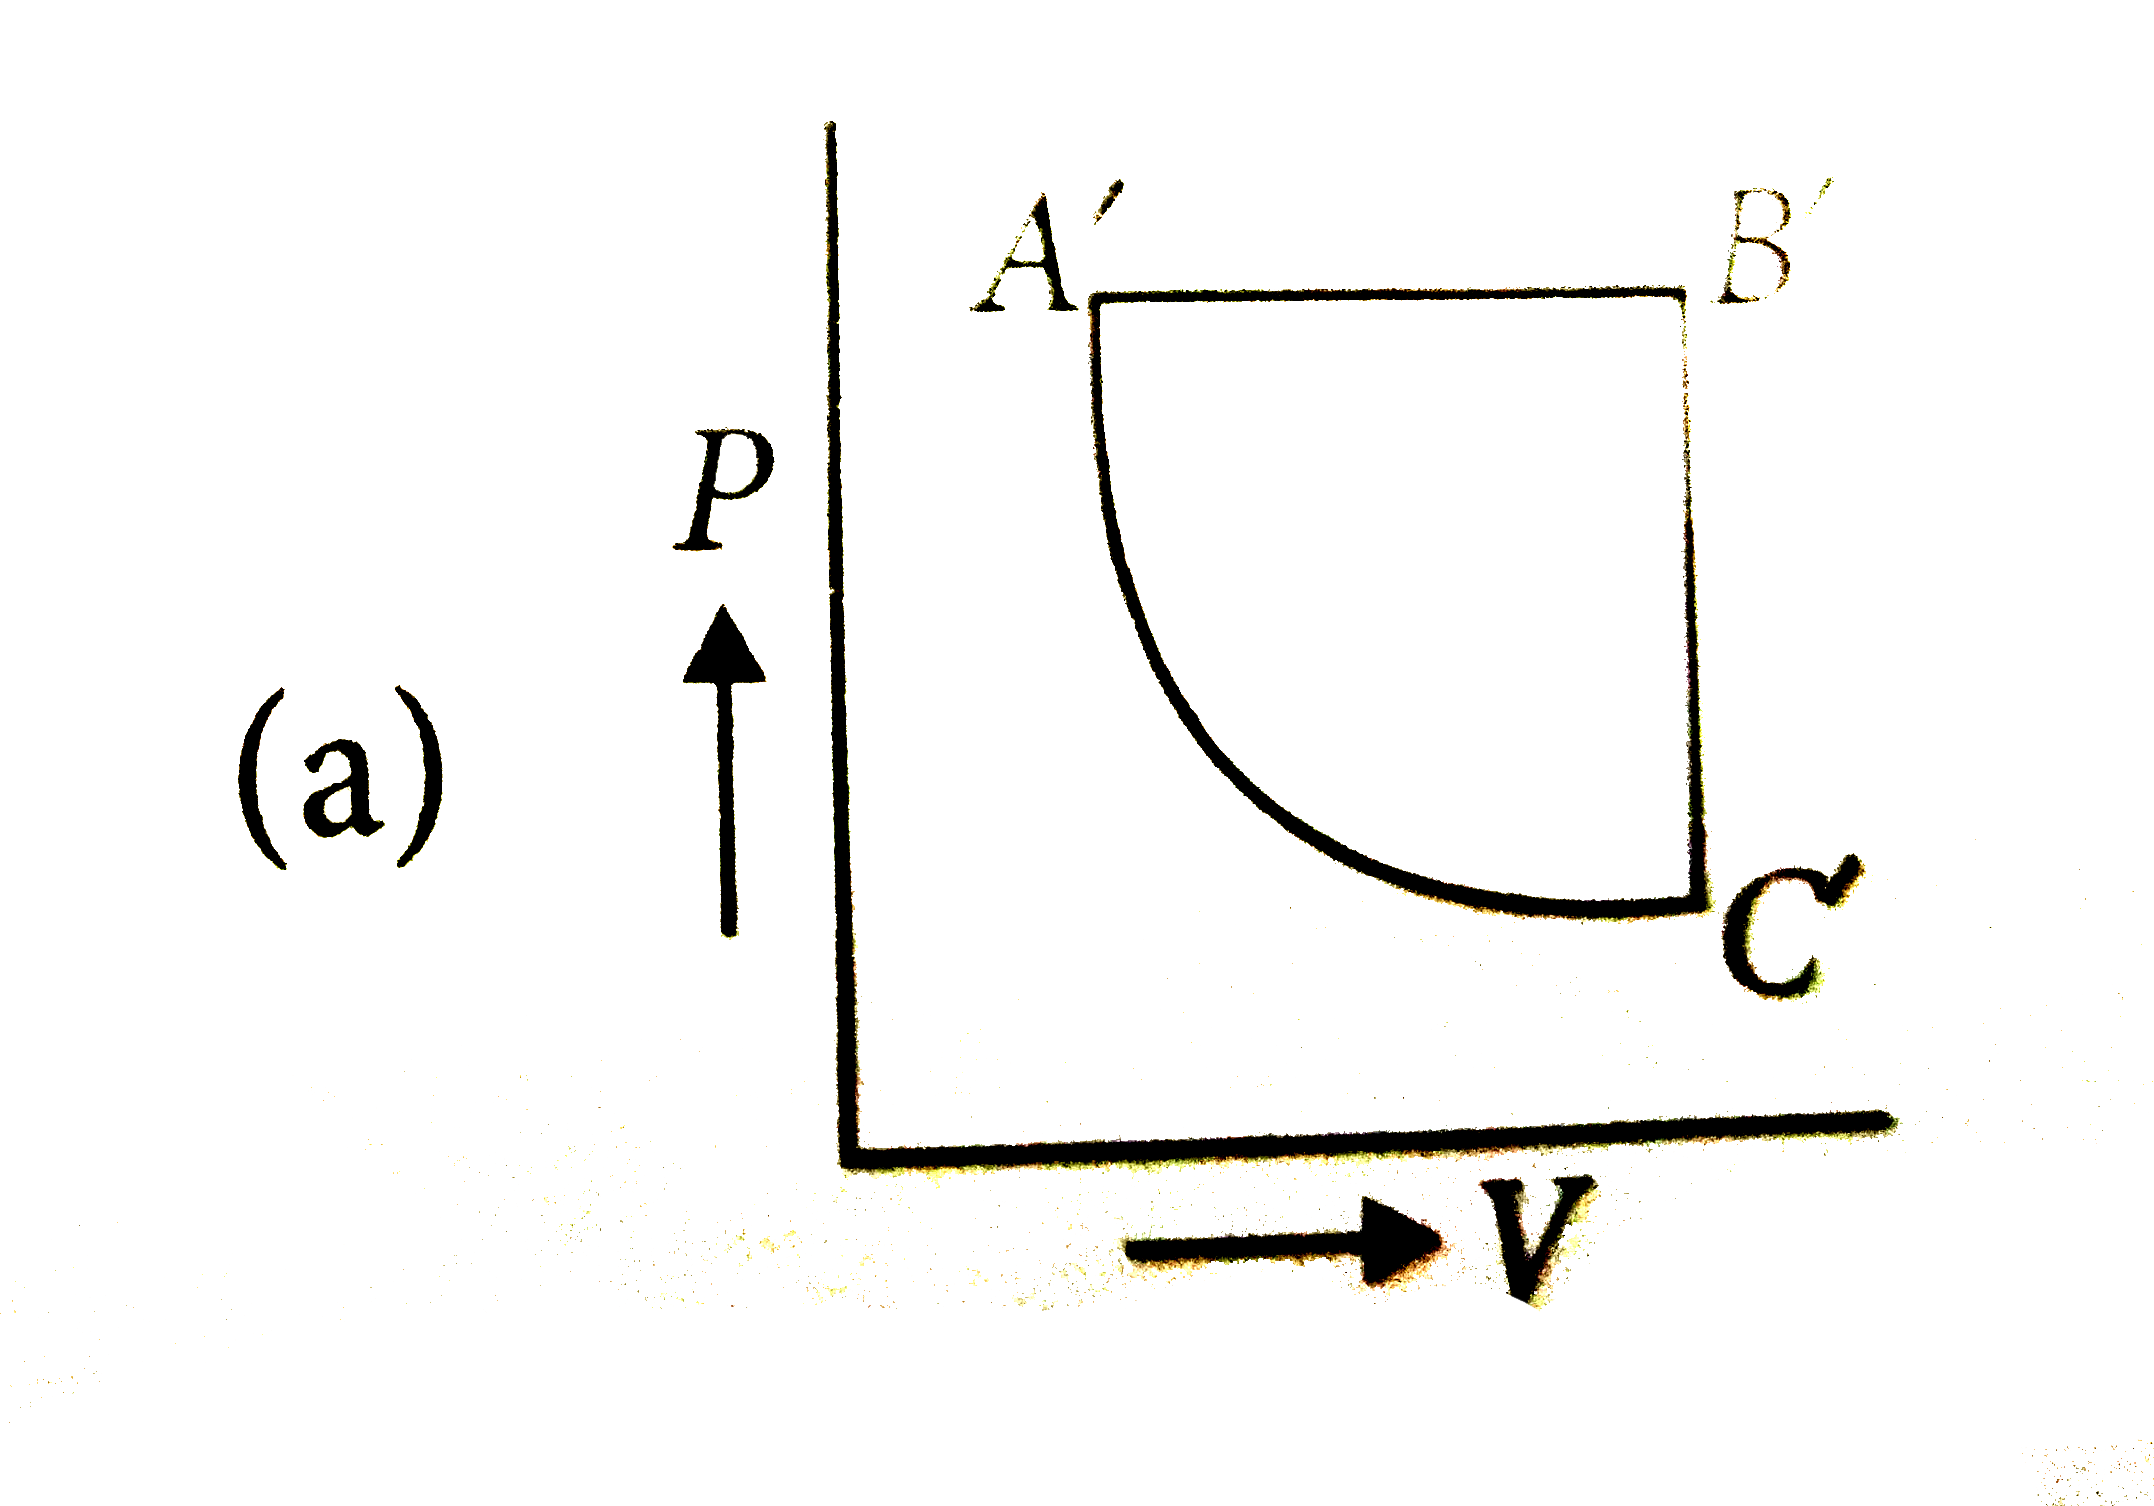 B
B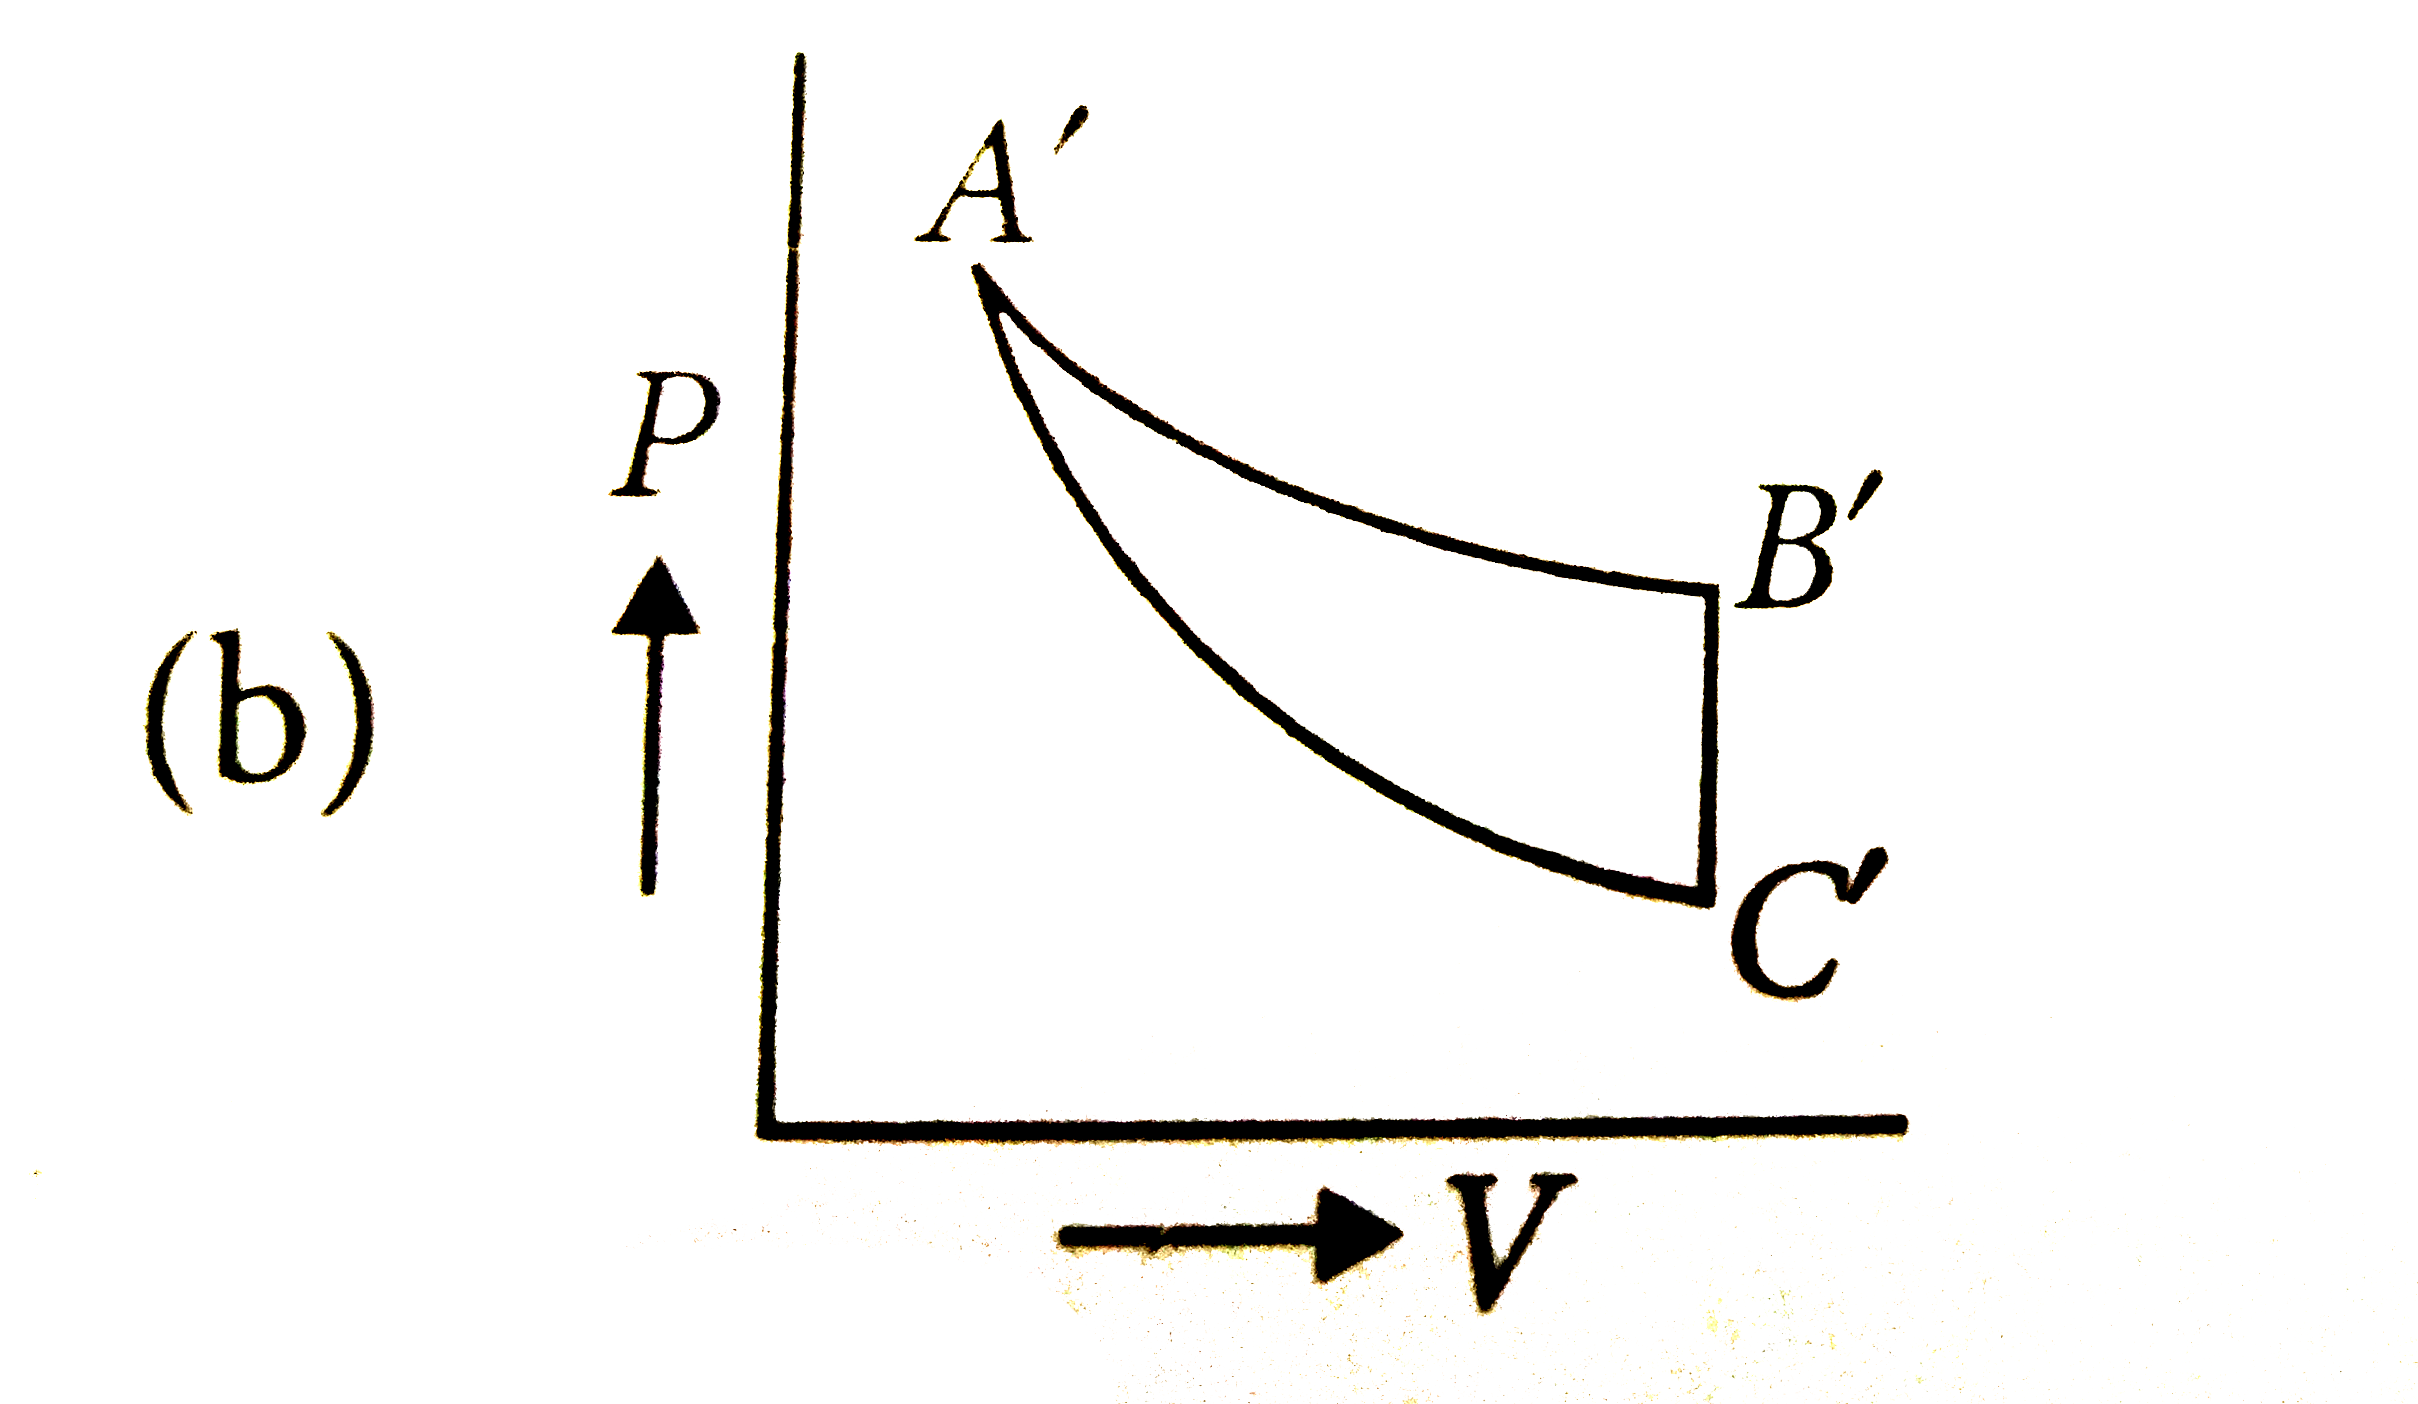 C
C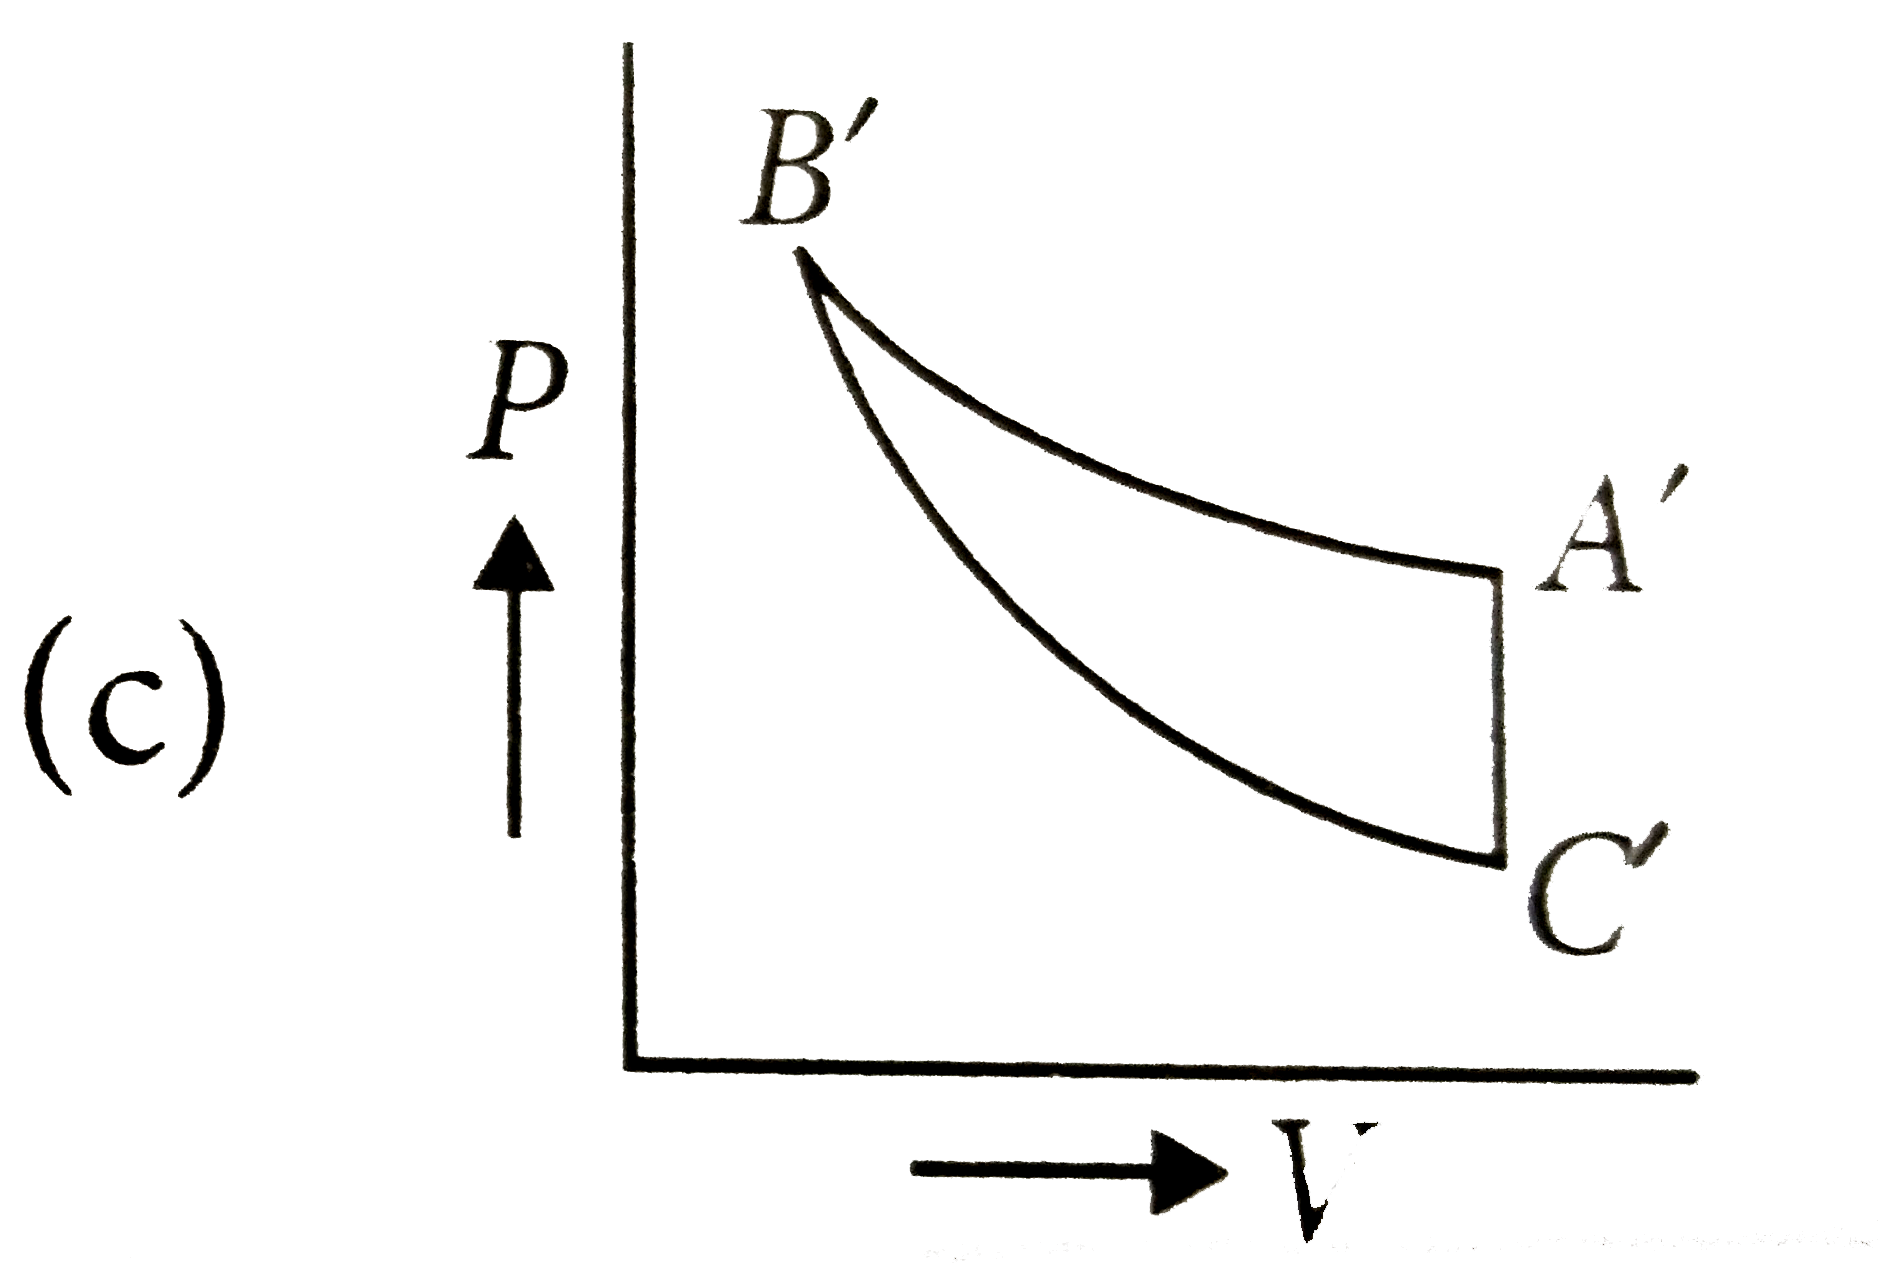 D
D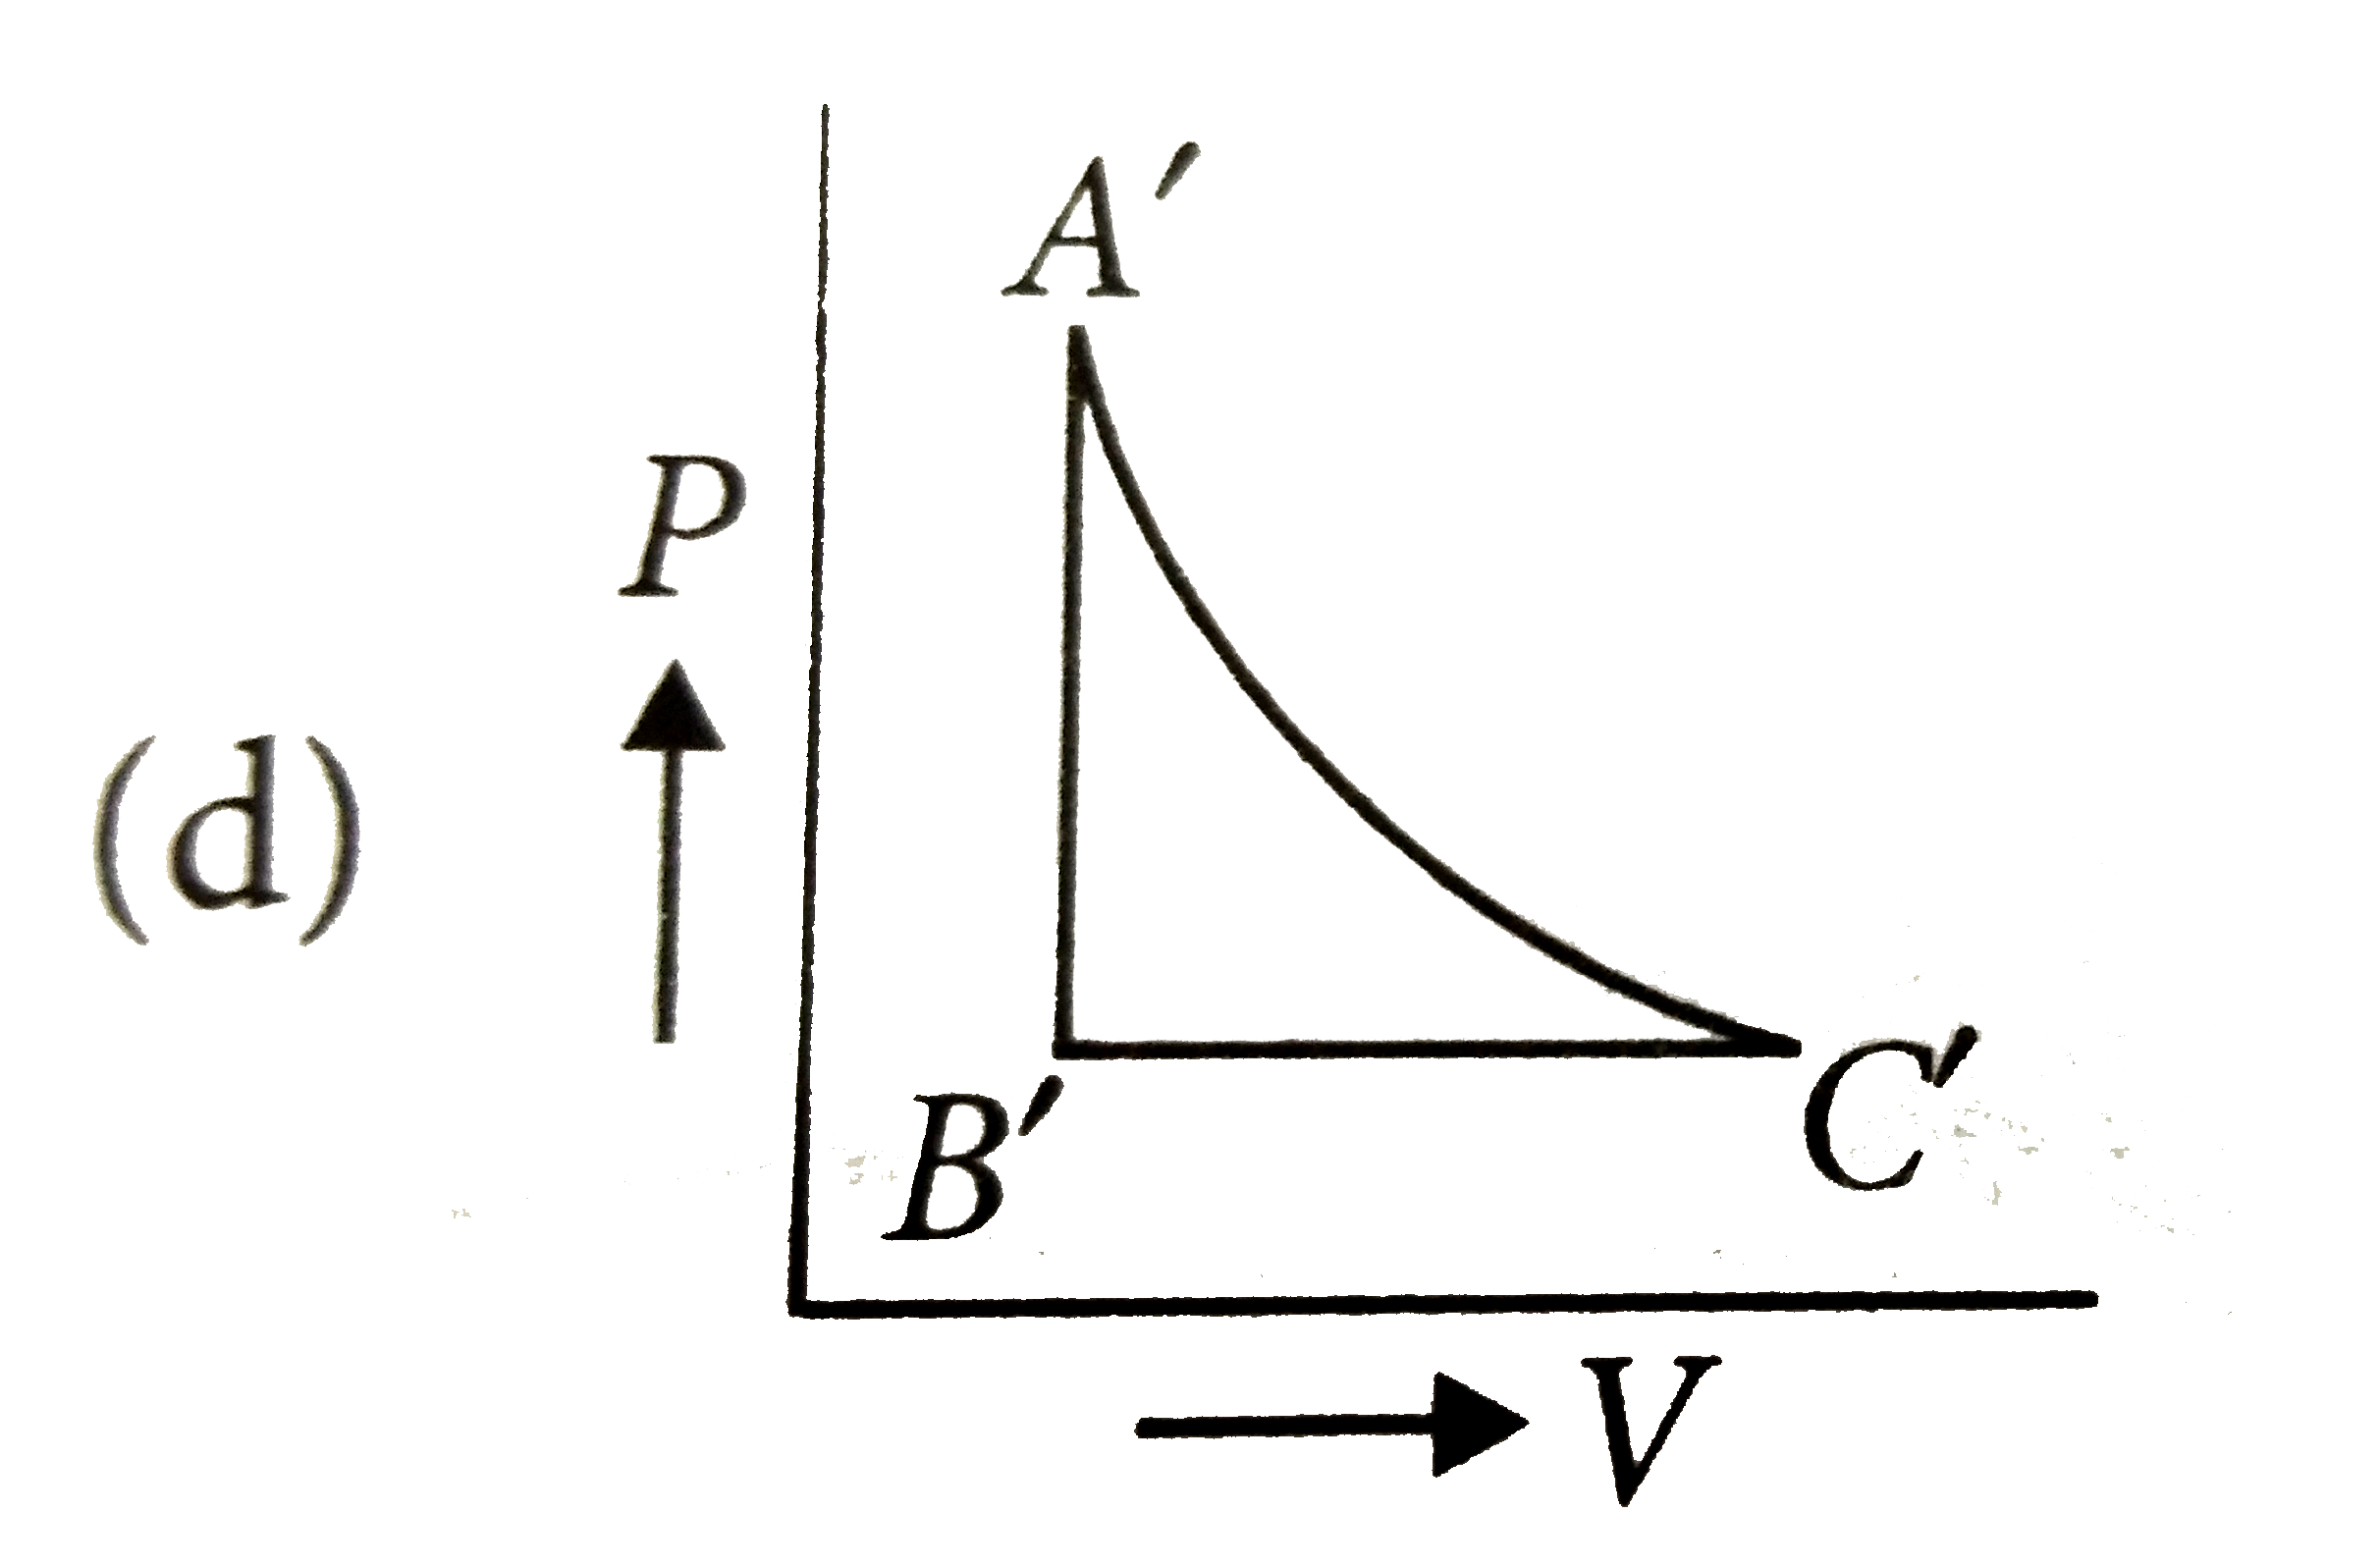
P−T diagram is shown in Fig. Choose the corresponding V−T diagram.

View SolutionPlot (p - V),(V - T) and (ρ - T) graph corresponding to the (p - T) graph for an ideal gas shown in figure.
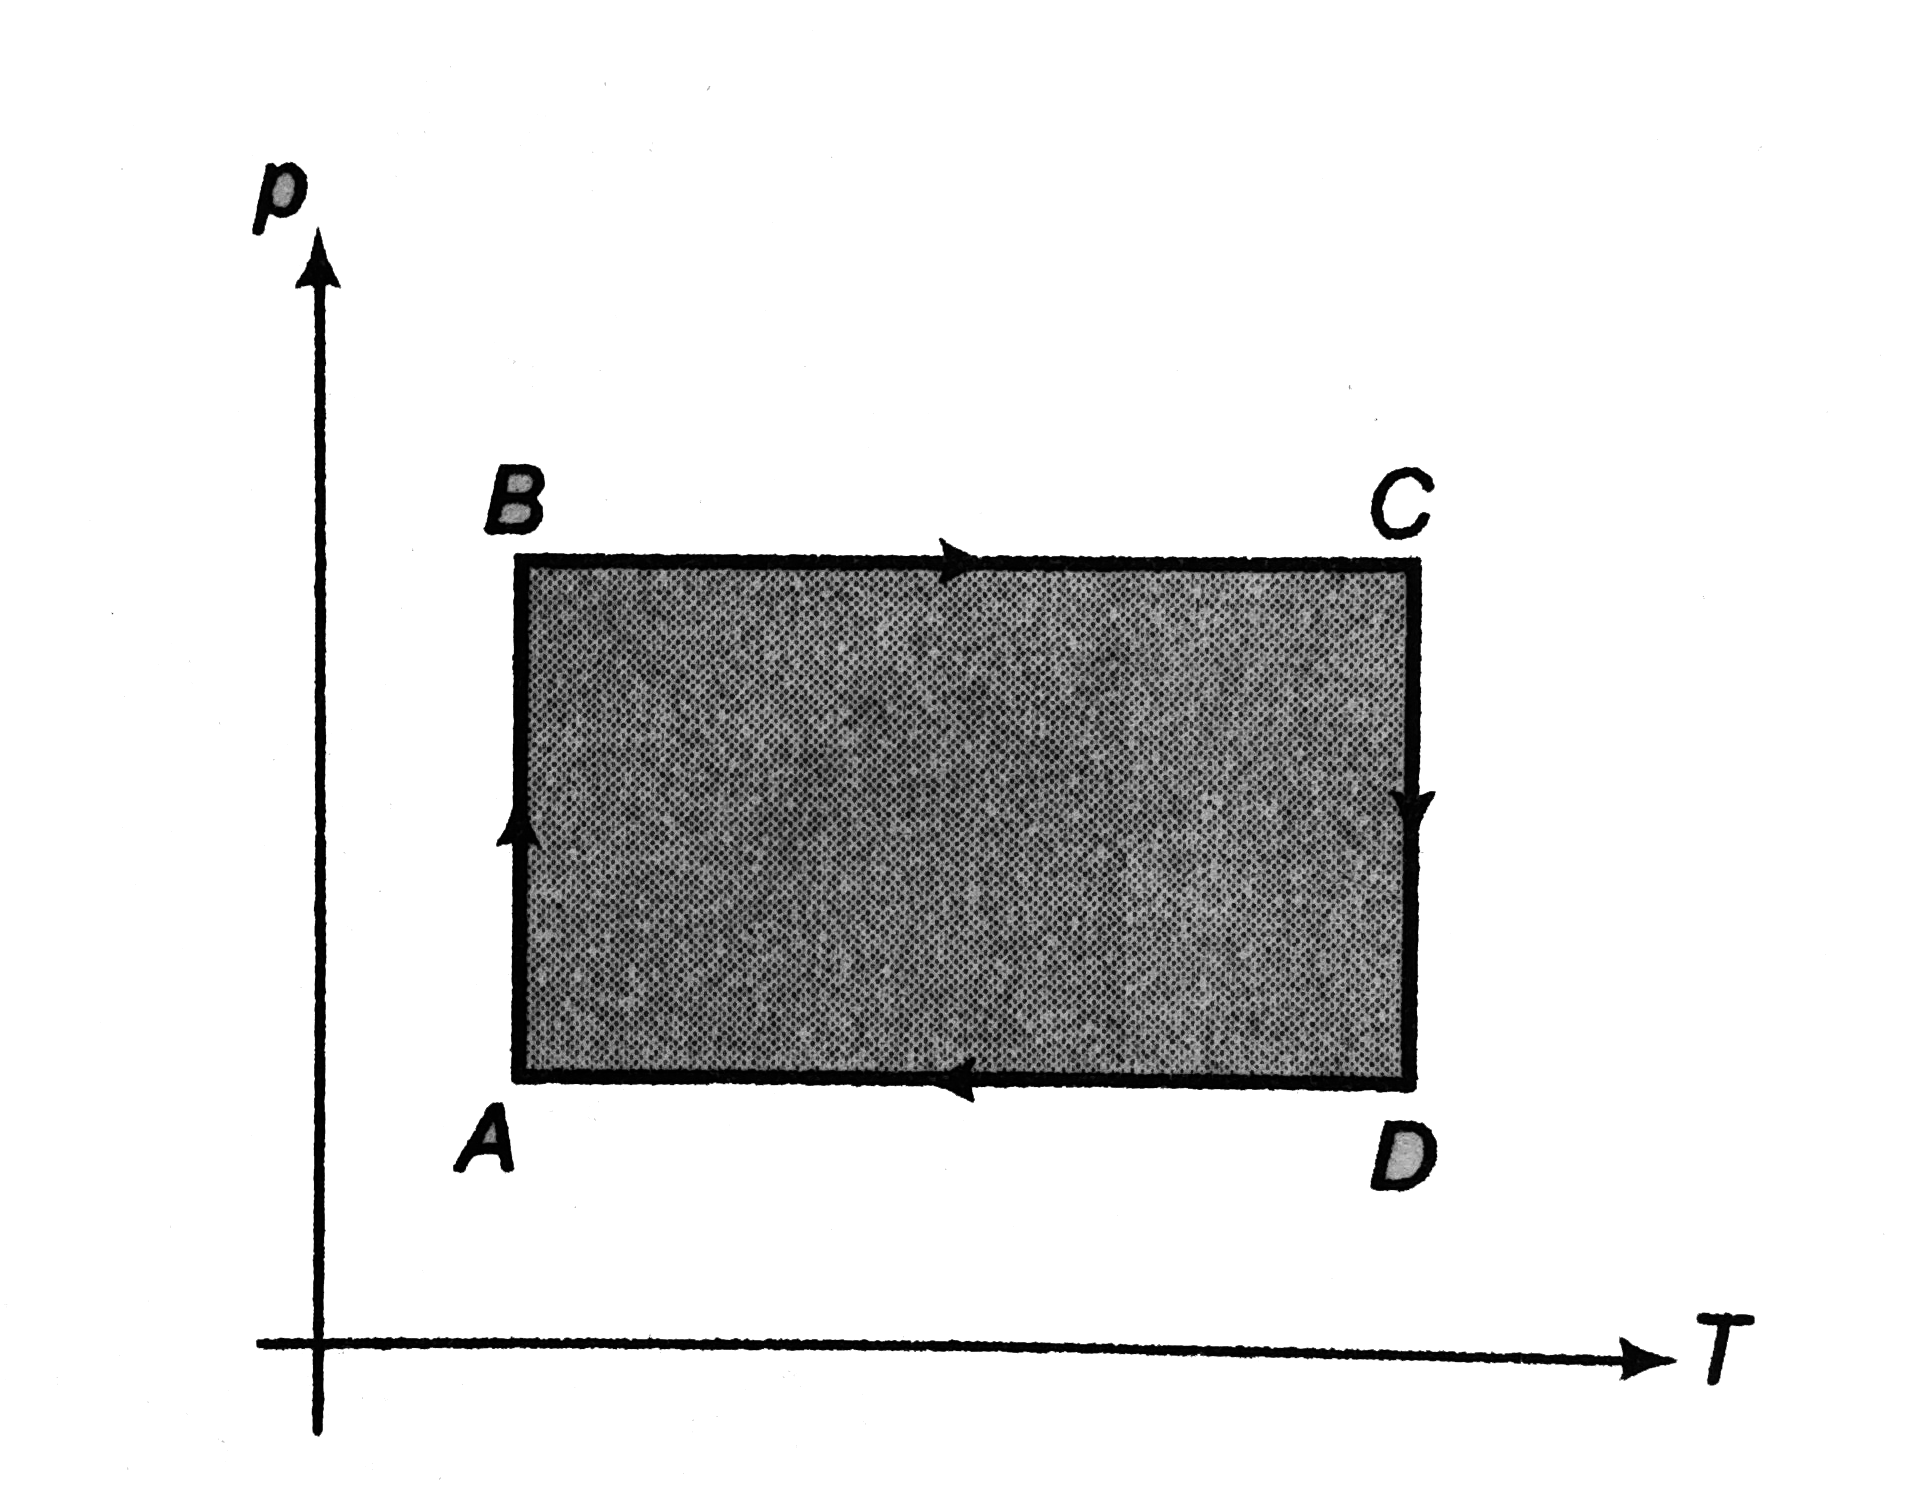 .
.
View SolutionThe given figure shows the pressure-temperature (P-T) diagram for a fixed mass of an ideal gas undergoing cyclic process ABCA. The corresponding pressure-volume (P-V) graph for the given cyclic process will be
_PHY_E06_003.png)
View SolutionStraight line on (p - T) graph for an ideal gas represents isochoric process.
If p∝T,V=constant.
View SolutionA cyclic process ABCA shown in the V-T diagram is performed with a constant mass of an ideal gas. Show the same process on a p-V diagram, In the figure, CA is parallel to the V-axis and BC is parallel to the T-axis.<br><imga≤ocr_imageload∈g=lazysrc=https://d10lpgp6xz60nq.cloudfront.net/physics_imagesHCV_VOL2_C24_S01_010_Q01.pngwh=80%mx-autosty≤=background:white;>
View SolutionA mixture of ideal gas containing 5 moles of monatomic gas and 1 mole of rigid diatomic gas is initially at pressure P0 volume V0 and temperature T0. If the gas mixture is adiabatically compressed to a volume V0/4, then the correct statement(s) is(are) : (Given R is gas constant)
View SolutionOne mole of an ideal monoatomic gas undergoes the process T=T0+4V, where T0 is initial temperature. Find
(i) Heat capacity of gas as function of its volume.
(ii) The amount of heat transferred to gas if its volume increases from V0 to 4V0.
View Solution