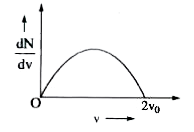
Consider a hypothetical velocity distribution of gas molecules shown in figure. The number of gas molecules dN per unit velocity range dv, is plotted against the velocity v. It is a parabola. The average and the most probable speeds will be

A
v0,v0
B
3v02,v0
C
43v0,v0
D
v0and2v0
Text Solution
The correct Answer is:A
|
Topper's Solved these Questions
- THERMAL PROPERTIES OF MATTERBOOK - AAKASH SERIESCHAPTER - THERMAL PROPERTIES OF MATTEREXERCISE - ADDITIONAL PRACTICE EXERCISE (LEVEL - II) PRACTICE SHEET (ADVANCED) More than One correct answer Type Questions
7 Videos
- THERMAL PROPERTIES OF MATTERBOOK - AAKASH SERIESCHAPTER - THERMAL PROPERTIES OF MATTEREXERCISE - ADDITIONAL PRACTICE EXERCISE (LEVEL - II) PRACTICE SHEET (ADVANCED) Linked Comprehension Type Questions
11 Videos
- THERMAL PROPERTIES OF MATTERBOOK - AAKASH SERIESCHAPTER - THERMAL PROPERTIES OF MATTEREXERCISE - ADDITIONAL PRACTICE EXERCISE (LEVEL - II) PRACTICE SHEET (ADVANCED) Straight Objective Type Questions (Expansion of Liquids :)
6 Videos
- SYSTEM OF PARTICLES AND ROTATIONAL MOTIONBOOK - AAKASH SERIESCHAPTER - SYSTEM OF PARTICLES AND ROTATIONAL MOTIONEXERCISE - PRACTICE EXERCISE
99 Videos
- THERMODYNAMICSBOOK - AAKASH SERIESCHAPTER - THERMODYNAMICSEXERCISE - EXERCISE - 3
33 Videos
Similar Questions
Knowledge Check
A : Average velocity of gas molecules is zero,
R : Due to random motion of gas molecules, velocities of different molecules cancer each other.AIf both Assertion & Reason are true and the reason is the correct explanation of the assertion, then Mark (1)BIf both Assertion & Reason are true but the reason is not the correct explanation of the assertion, then mark (2)CIf Assertion is true statement but Reason is false, then mark (3)DIf both Assertion and Reason are false statements, then mark (4).The average velocity of the molecules in a gas in equilibrium is
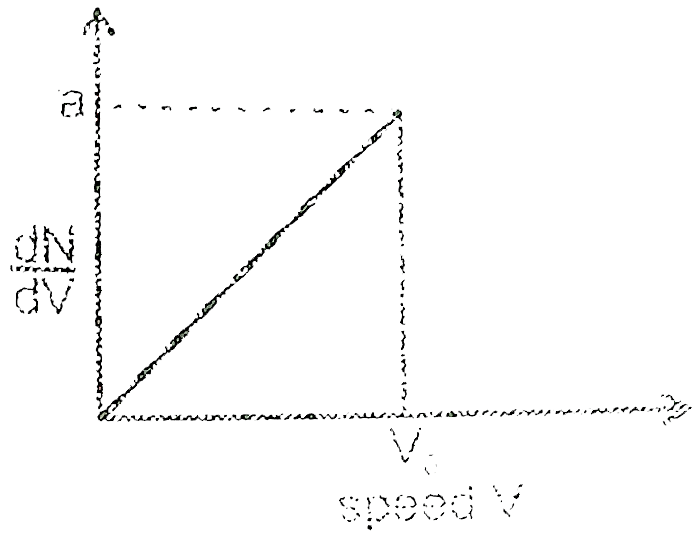
Aproportional to √TBproportional to TCproportional to T2Dequal to zeroGraph shows a hypothetical speed distribution for a sample of N gas particle (for V>V0,dNdV=0)
 AThe value of V0 is 2NBThe ratio Vavg/V0 is equal to 2/3CThe ratio Vrms/V0 is equal to 1/√2DThree fourth of the total particle has a speed between 0.5V0 and V0.
A : Average velocity of gas molecules is zero,
R : Due to random motion of gas molecules, velocities of different molecules cancer each other.
View SolutionThe average velocity of the molecules in a gas in equilibrium is
View SolutionGraph shows a hypothetical speed distribution for a sample of N gas particle (for V>V0,dNdV=0)

View SolutionFrom the conditions of the foregoing problem find the number of molecules reaching a unit area of a wall with the velocities in the interval from v to v+dv per unit time.
View SolutionGraph shows a hypothetical speed distribution for a sample of N gas particle :- (forV>V0,dNdV=0)
_E01_138_Q01.png)
View Solution
