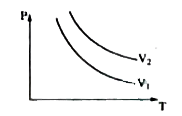
Figure shows the pressure versus temperature curves for a given mass of a gas corresponding to two different volumes then
 Solution in Telugu
The information is insufficient
The correct Answer is:B
Step by step video, text & image solution for Figure shows the pressure versus temperature curves for a given mass of a gas corresponding to two different volumes V_1 and V_2 then by Physics experts to help you in doubts & scoring excellent marks in Class 11 exams.
Updated on:21/07/2023Topper's Solved these Questions
- THERMAL PROPERTIES OF MATTERBOOK - AAKASH SERIESCHAPTER - THERMAL PROPERTIES OF MATTEREXERCISE - ADDITIONAL PRACTICE EXERCISE (LEVEL - II) PRACTICE SHEET (ADVANCED) More than One correct answer Type Questions
7 Videos
- THERMAL PROPERTIES OF MATTERBOOK - AAKASH SERIESCHAPTER - THERMAL PROPERTIES OF MATTEREXERCISE - ADDITIONAL PRACTICE EXERCISE (LEVEL - II) PRACTICE SHEET (ADVANCED) Linked Comprehension Type Questions
11 Videos
- THERMAL PROPERTIES OF MATTERBOOK - AAKASH SERIESCHAPTER - THERMAL PROPERTIES OF MATTEREXERCISE - ADDITIONAL PRACTICE EXERCISE (LEVEL - II) PRACTICE SHEET (ADVANCED) Straight Objective Type Questions (Expansion of Liquids :)
6 Videos
- SYSTEM OF PARTICLES AND ROTATIONAL MOTIONBOOK - AAKASH SERIESCHAPTER - SYSTEM OF PARTICLES AND ROTATIONAL MOTIONEXERCISE - PRACTICE EXERCISE
99 Videos
- THERMODYNAMICSBOOK - AAKASH SERIESCHAPTER - THERMODYNAMICSEXERCISE - EXERCISE - 3
33 Videos
Similar Questions
When we use a clinical thermometer we require longer time to register the temperature of a human body than to shake it down to the initial ambient temperature. This observation can be due to
View SolutionPassage - I:
An instrument known as triple point cell ( at a temperature of 273.16 K and pressure of 4.6mm of mercury) in which triple point is attained for water. It consists of a U-tube containing ice-cold water to evacuate air by means of an exhaust pump and sealed. It is then lowered into a Dewar's flask containing ice-water mixture. The space corresponding to the inner portion of the vessel is filled with a freezing mixture and this space is referred as "thermometric well". As a result, the layer of the water freezes into ice. Thus the space in the U-tube contains ice, water. water-vapor all the three in equilibrium and the corresponding coordinates of pressure and temperature the "triple point of water"
1. Evacuated Cell
2. Inner U-tube
3. Ice-Water Mixture
4. Freezing Mixture
5. Water-frozen into ice
6. Water Vapour
7. Dewar's Tube
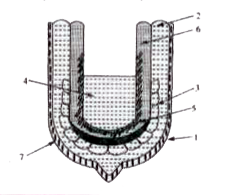
Triple Point cell is an experimental arrangement
View SolutionThe graph of elongation of a rod a substance A with temperature rise is shown in Fig(1). A liquid B contained in a cylindrical vessel made up of substance A, graduated in millilitres at 0°C is heated gradually. The readings of the liquid level in the vessel corresponding to different temperature is shown in Fig(2). The real volume expansivity of liquid is

View SolutionThe centre of mass of two particles with masses 2kg and 6 kg located at (1,1,1), (2,2,1) respectively has the coordinates
View SolutionA bullet of mass 10×10−3 moving with a speed of 20ms−1 hits an ice block (0∘C) of 990g kept at rest on a frictionless floor and gets embedded in it. If ice takes 50% of K.E, the amount of ice melted (in grams) approximately is (J=4.2J/cal) (latent heat of ice=80cal/g)
View SolutionPressure versus temperature graph of an ideal gas as shown in Fig. Corresponding density (rho) versus volume (V) graph will be
View SolutionFigure shows the volume versus temperature graph for the same mass of a gas (assumed ideal) corresponding to two different pressure P_(1) and P_(2) . Then
View SolutionFigure shows the pressure P versus volume V graphs for two different gas sample at a given temperature. M_A and M_B are masses of two samples, n_A and n_B are numbers of moles. Which of the following must be incorrect.
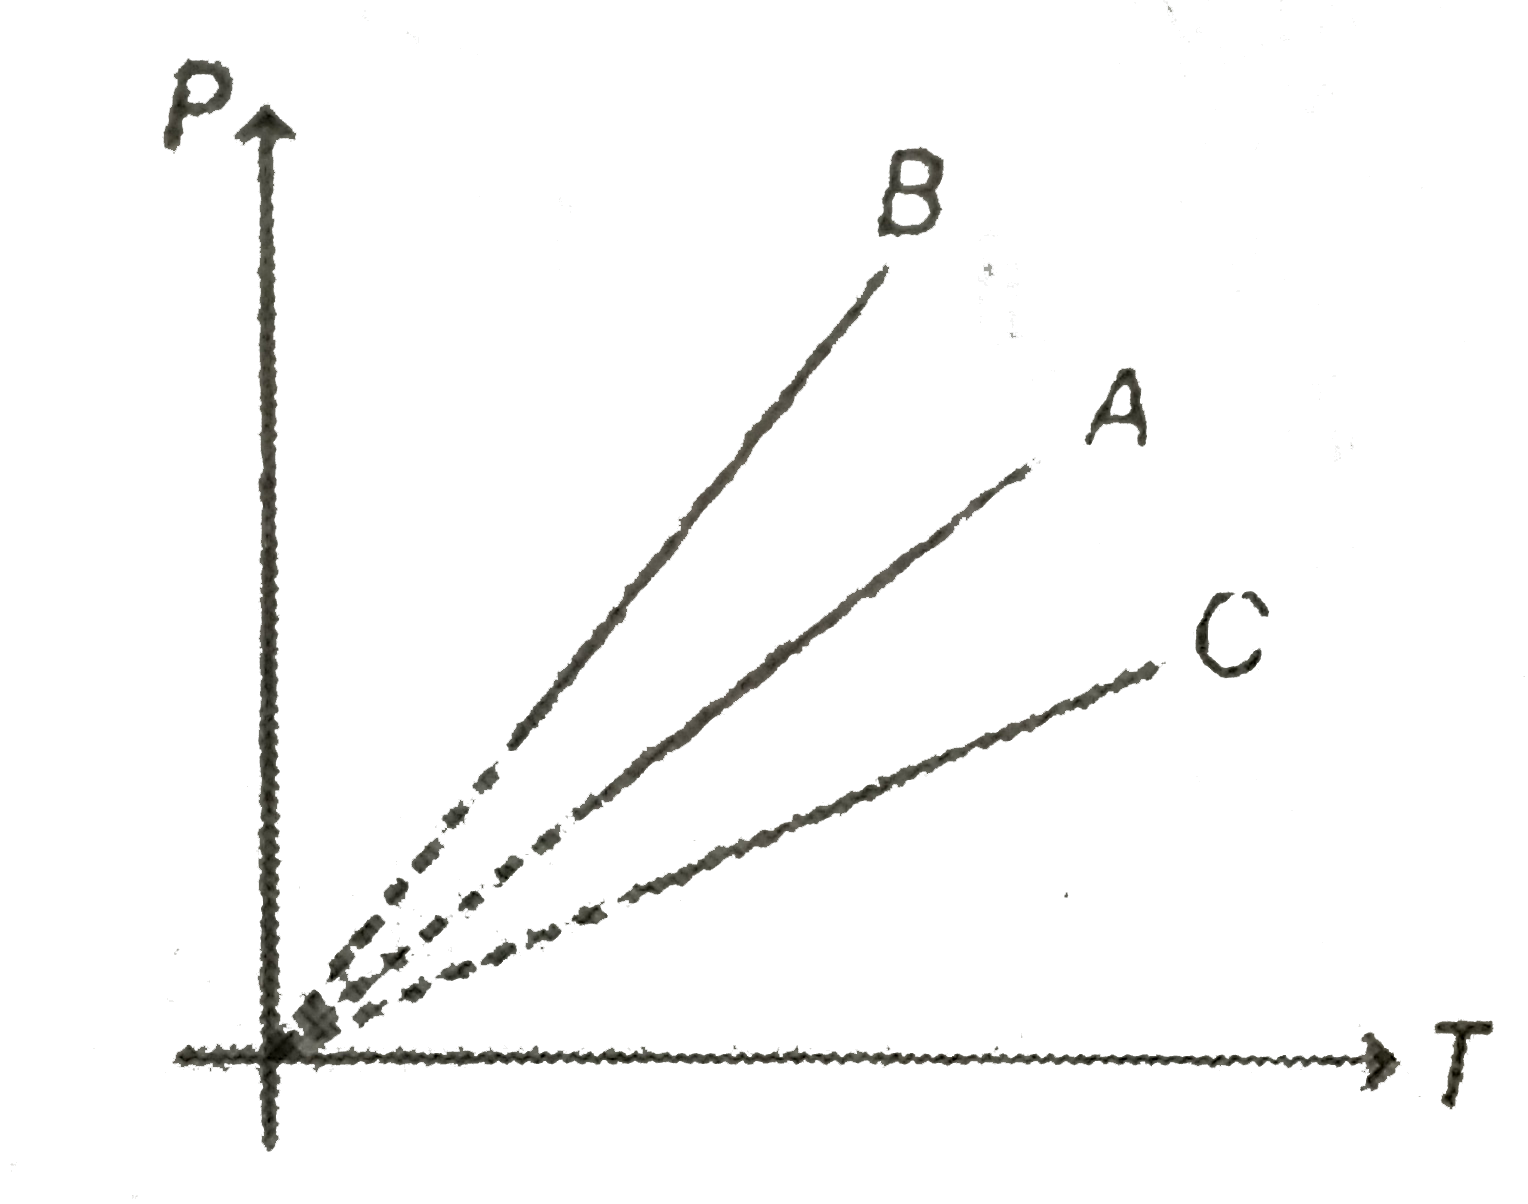
View SolutionPressure versus temperature graph of an ideal gas at constant volume V is shown by the straight line A. Now mass of the has is doubled and the volume is halved, then the corresponding pressure versus temperature graph will be shown by the line
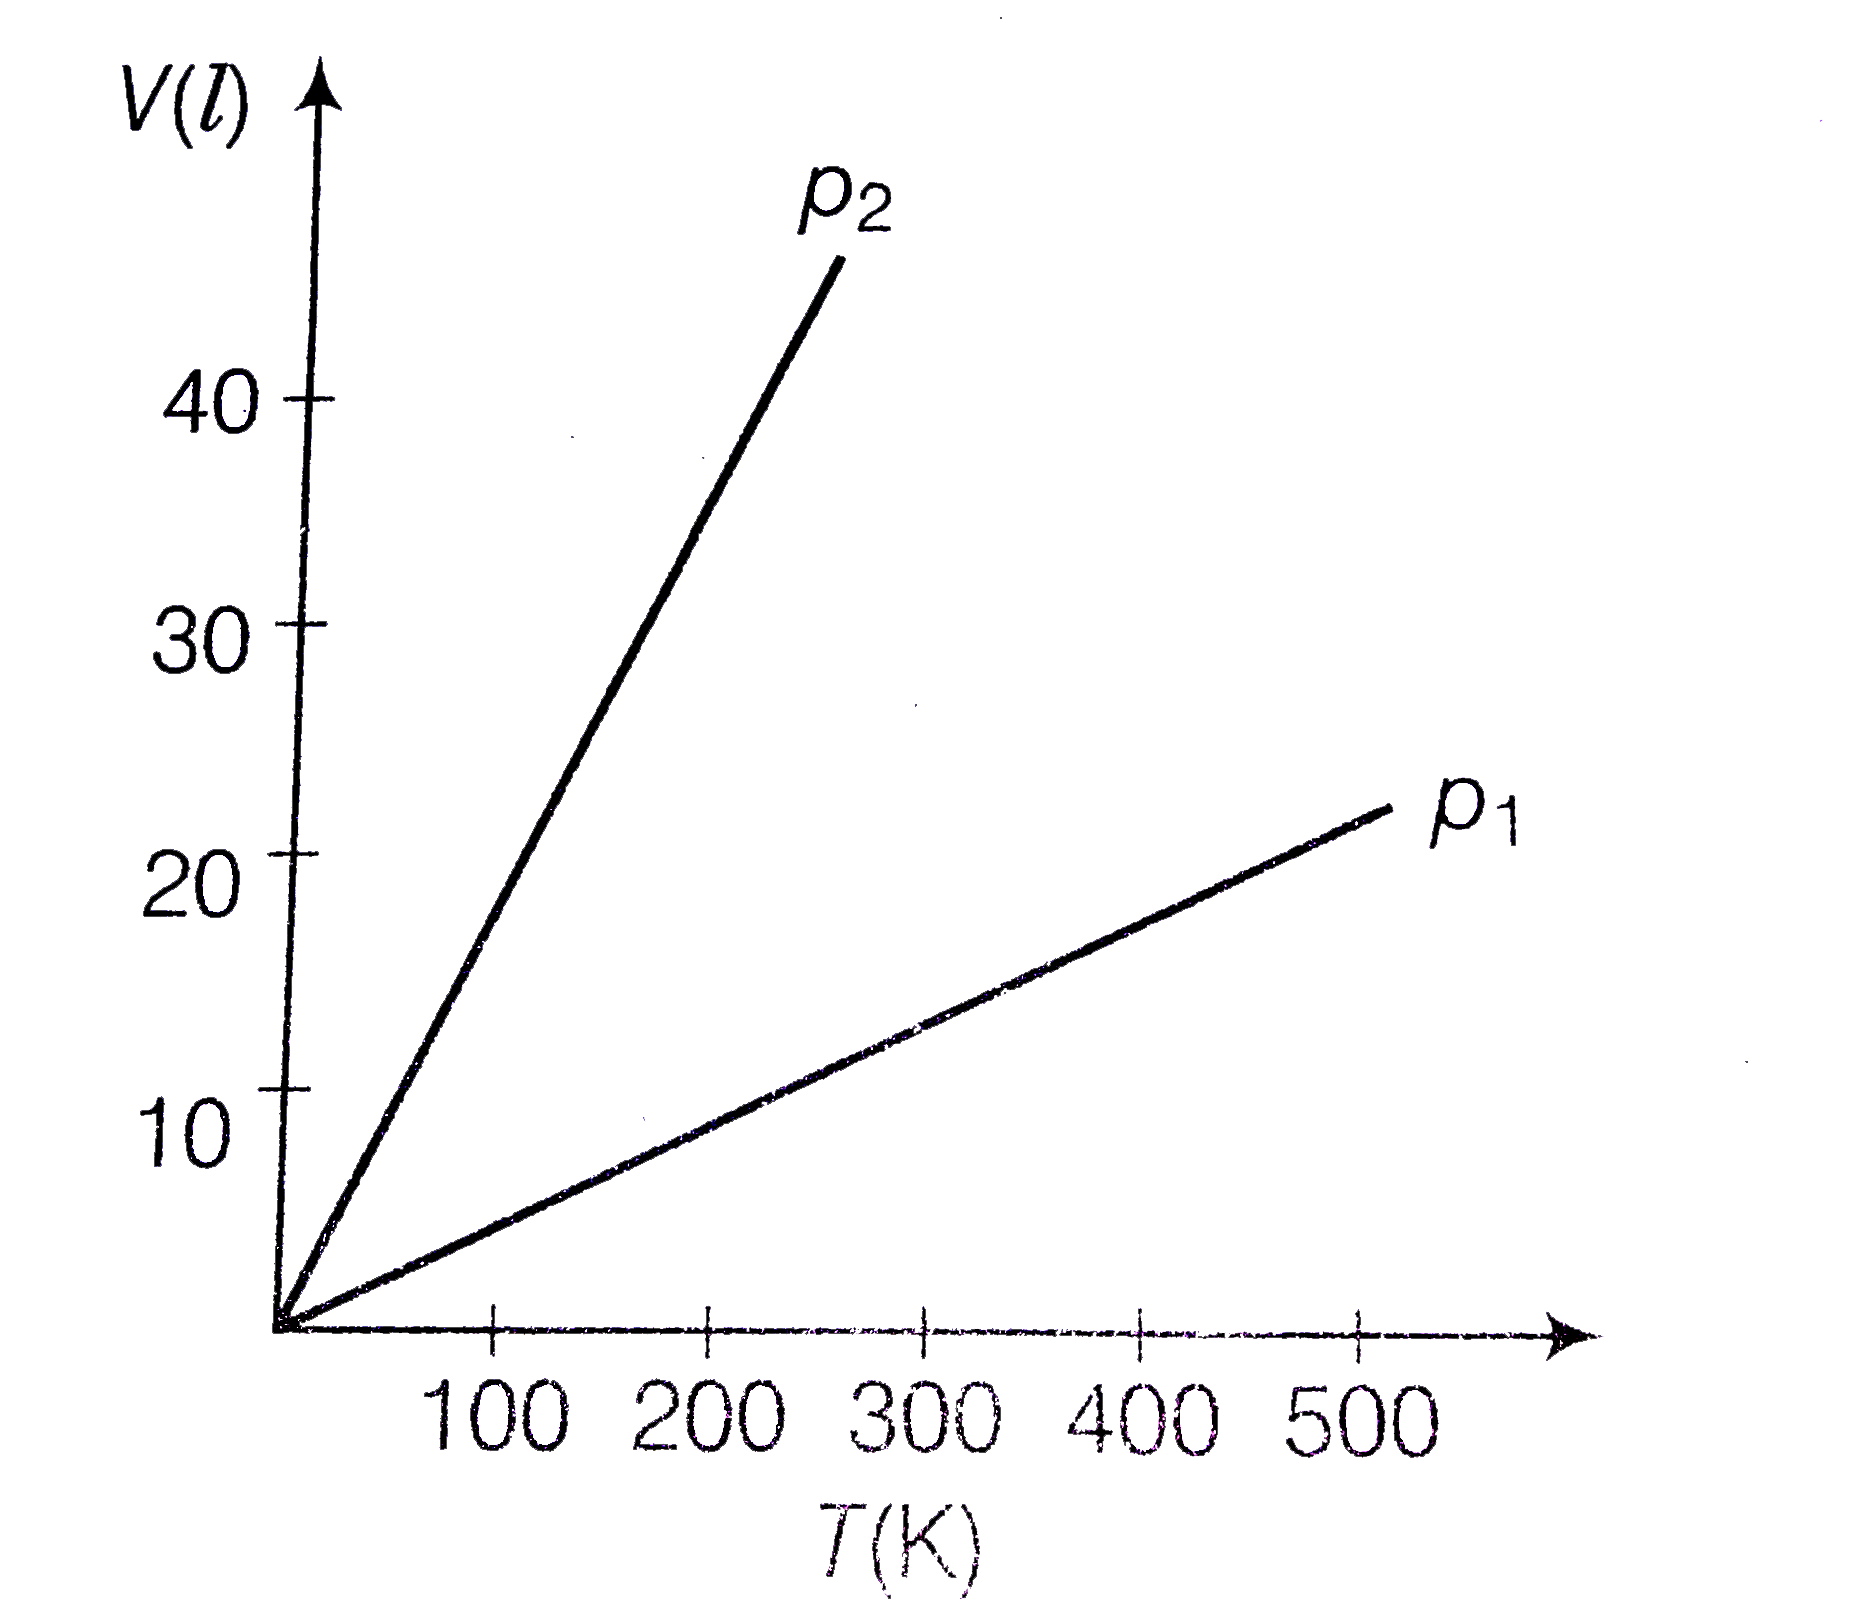
View SolutionVolume versus temperature graphs for a given mass of an ideal gas are shown in figure. At two different values of constant pressure. What can be inferred about relation between P1 and P2 ?
View SolutionFor a given mass of gas the variation of pressure versus temperature is shown in the figure. What is the ratio of volume of the gas at points A and B.
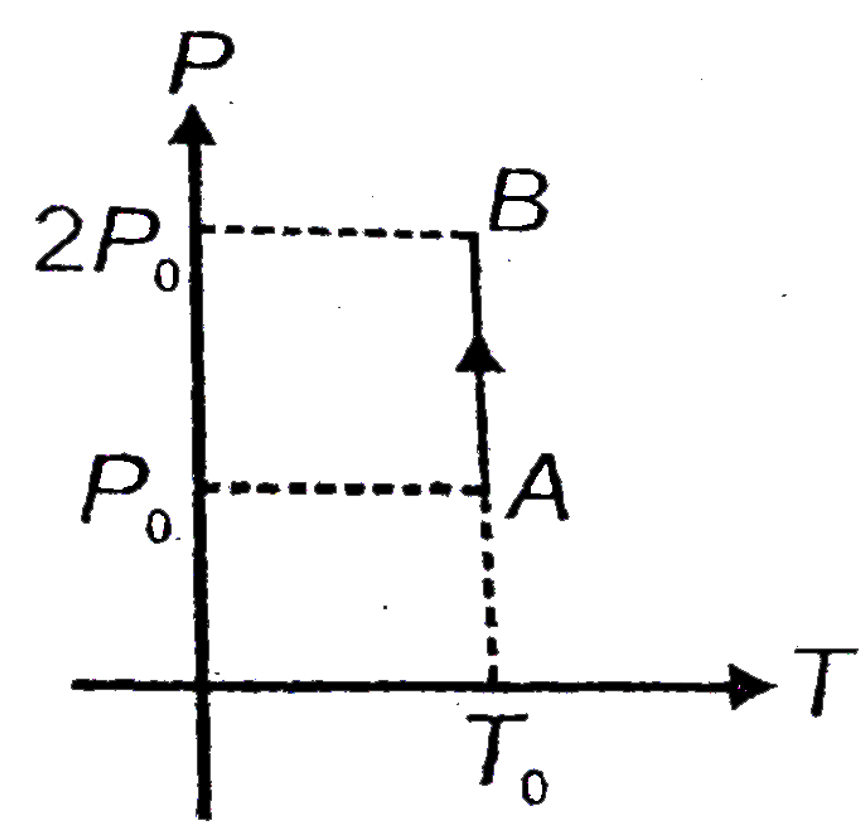 .
.
View SolutionA certain mass of an ideal gas at pressure P1 is adiabatically expanded from an initial volume V1 to a final volume V2. The resulting pressure P2 of the gas is given by:
View SolutionFigure 6.19 shows the p-T graphs for a fixed mass of an ideal gas at volumes V_1 and V_2 .Can it be concluded from the graphs that V_1 is greater than V_2 ?
View SolutionThe pressure P for a gas is plotted against its absolute temperature T for two different volumes V_1 and V_2 where V_1 gt V_2 . If P is plotted on y-axis and T on x-axis, then:
View SolutionFigure shows the volume versus temperature graph for the same mass of a gas (assumed ideal correspond to two different pressure P1andP2. Then
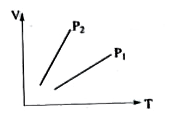
View Solution
