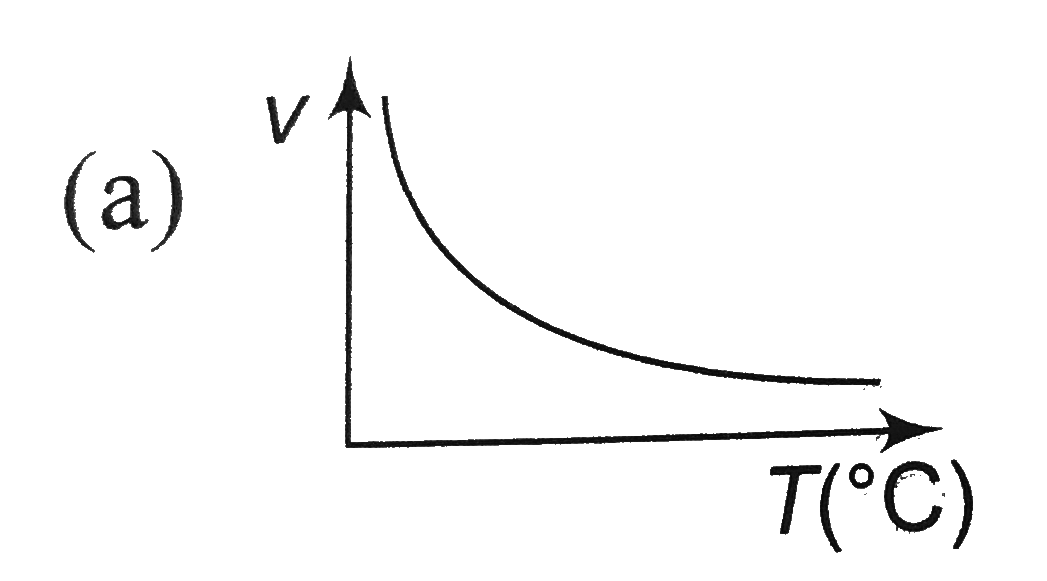
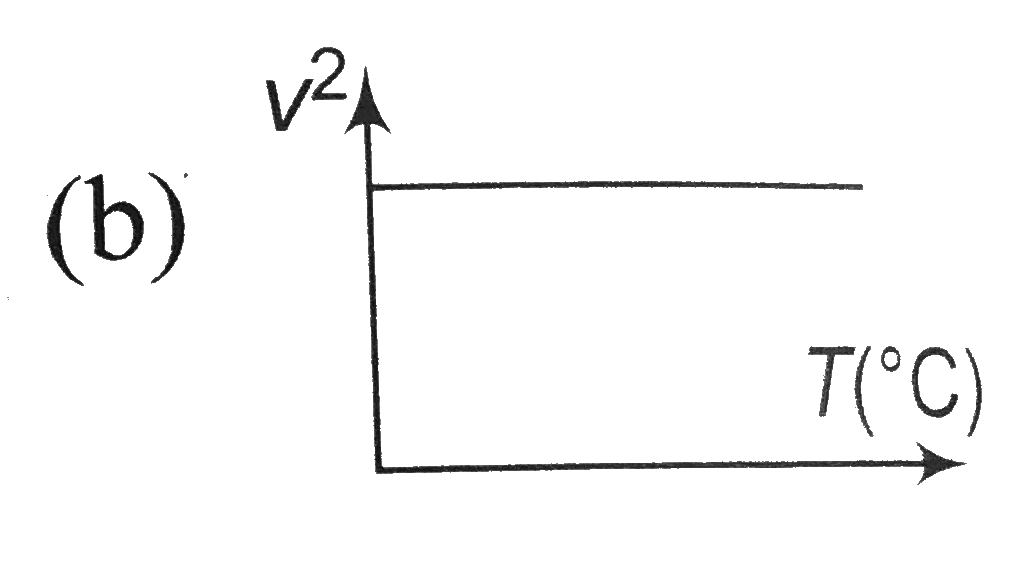
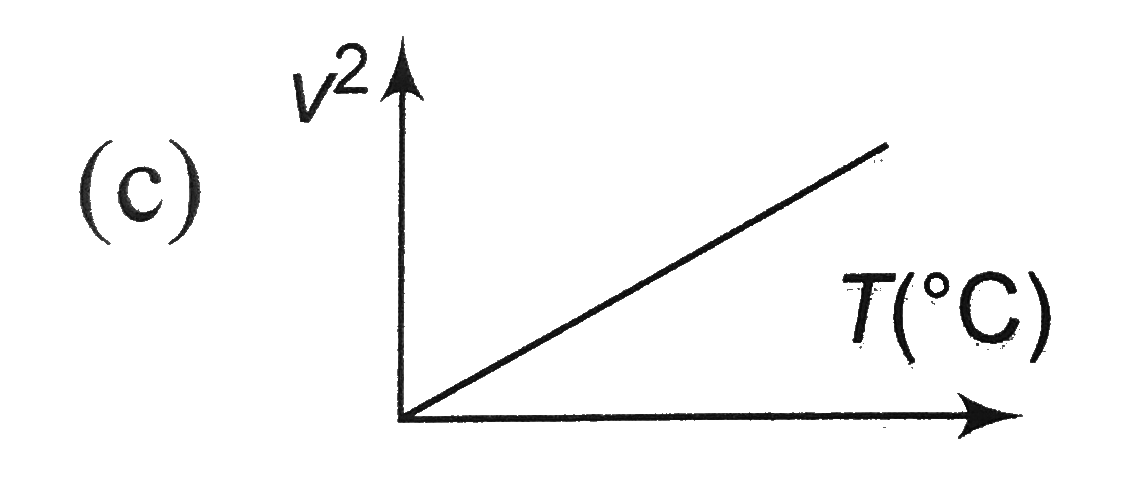
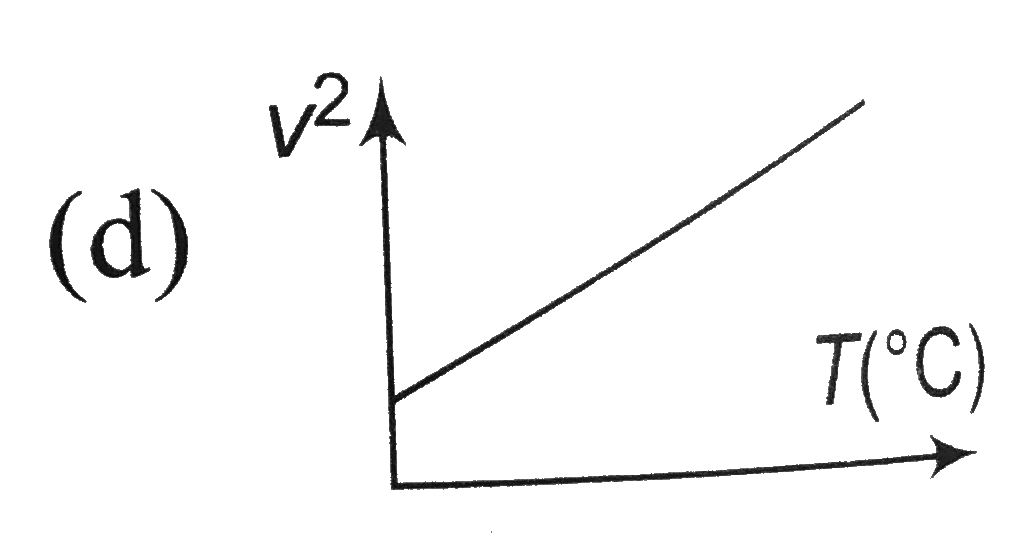
The graph between temperature in ∘C and pressure of a perfect gas is
A
hyperbola
B
a straight line passing though the origin
C
A straight line parallel to pressure axis intercepting temperature axis as −273∘ C
D
a straight line with +ve intercept on axis and intercepting the temperature axis as−273∘ C
Text Solution
The correct Answer is:D
|
Similar Questions
Knowledge Check
Internal pressure of a perfect gas (ideal gas) is:
AZeroBinfiniteCCalculated by PV=nRTDCan not say directallyThe graph between the (velocity)2 and temperature T of a gas is
A B
B C
C D
D
Pressure exerted by a perfect gas equal to
Amean K.E. per unit volumeBhalf of mean K.E. per unit volumeCone-third of mean K.E. per unit volumeDtwo-third of mean K.E. per unit volume
The graph between the (velocity2) and temperature T of a gas is
View SolutionThe graph between pressure P and volume V for a given mass of a gas a fixed temperature T is a ________ .
View SolutionDraw the graph between P and 1/V (reciprocal of volume) for a perfect gas at constant temperature.
View SolutionPlot a graph between internal energy U and Temperature (T) of an ideal gas.
View SolutionA cylinder contains a gas at temperature of 270C and a pressure 1MPa. If the temperature of the gas is lowered to −230C, the change in pressure is
View Solution
