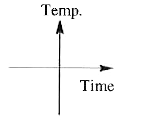
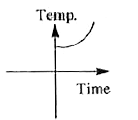
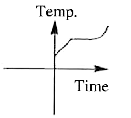
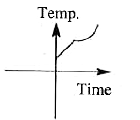
Liquid oxygen at 50 K is heated to 300 K at constant pressure of 1 atm. The rate of heating is constant. Which of the following graphs represent the variation of temperature with time? Solution in Telugu


The correct Answer is:C
Step by step video, text & image solution for Liquid oxygen at 50 K is heated to 300 K at constant pressure of 1 atm. The rate of heating is constant. Which of the following graphs represent the variation of temperature with time? by Physics experts to help you in doubts & scoring excellent marks in Class 11 exams.
Similar Questions
Liquid oxygen at 50K is heated to 300K at constant pressure of 1atm. The rate of heating is constant. Which of the following graphs represents the variation of temperature with time?
01:20View SolutionLiquid oxygen at 50 K is heated to 300 K at constant pressure of 1 atm. The rate of heatingis constant. Which of the following graph represent the variation of temperature with time ?
View SolutionIf heat energy is given to an ideal gas at constant pressure, then select the graph which best represents the variation of VT with temperature (T).
01:59View SolutionIf liquefied oxygen at 1 atmospheric pressure is heated from 50K to 300k by supplying heat at constant rate. The graph of temperature vs time will be
05:20View Solution50 K पर द्रव ऑक्सीजन को 300 K तक एक वायुमण्डलीय स्थिर दाब पर गर्म किया जाता है । यदि गर्म करने की दर स्थिर है तो निम्न में से कौन सा ग्राफ समय के साथ ताप परिवर्तन प्रदर्शित करता है?
04:09View Solutionद्रव ऑक्सीजन को 1 वायुमंडल के नियत डाब पर 50 केल्विन से 300 केल्विन तक गर्म किया गया है। गर्म करने की दर नियत है। निम्न में से कौन-सा ग्राफ समय के सापेक्ष तापमान में परिवर्तन की दर को प्रदर्शित करता है ?
02:50View SolutionLiquid oxygen at 50 K is heated to 300 K at constant pressure of 1 atm . The rate of heating is constant. Which of the following graphs represents the variation of temperature with time?
02:14View Solution

