The correct graph showing variation of potential energy with internuclear distance when two hydrogen atoms approach each other is
A
B
C
D
Text Solution
The correct Answer is:B
|
Topper's Solved these Questions
Similar Questions
Knowledge Check
The potential energy of an electron in the fifth orbit of hydrogen atom is
A0.54eVB−0.54eVC1.08eVD−1.08eVWhich of the following occurs, when two hydrogen atoms bond with each other
APotential energy is loweredBKinetic energy is loweredCElectronic motion ceasesDEnergy is absorbed
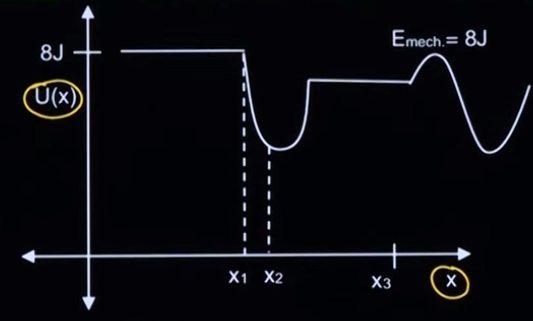
Figure shows variation of potential energy veses displacement graph. find correct statement

View SolutionThe diagram showing the variation of gravitational potential of earth with distance from the centre of earth is
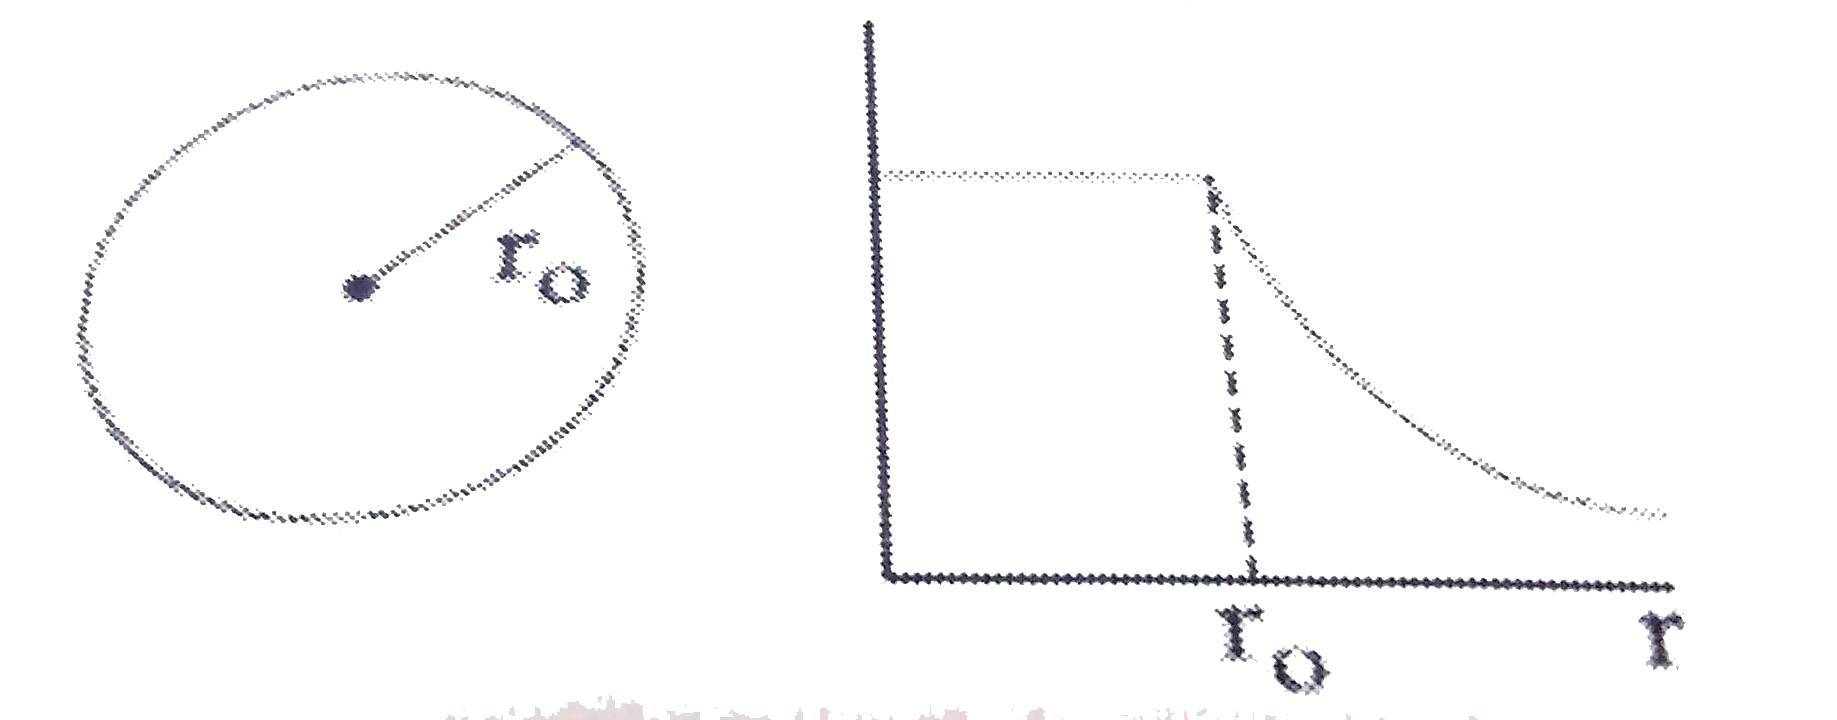
View SolutionThe given graph shows variation (with distance r form center) of :

View SolutionThe given graph shows variation (with distance r form center) of :

View SolutionWhat will happen when two clouds with unlike charges approach each other?
View SolutionThe correct graph representing the variation of total energy (Et), kinetic energy (Ek) and potential energy (U) of a satellite with its distance form the centre of earth is
View Solution
