Figure shows variation of potential energy veses displacement graph. find correct statement 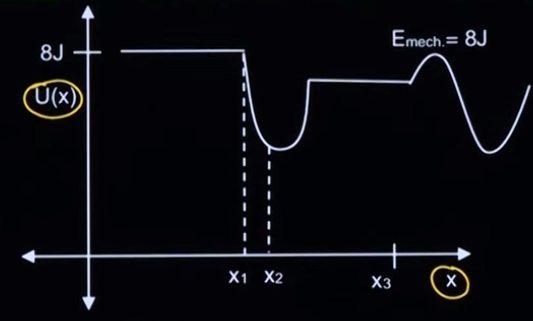
x<x1 KE is least and body has constant speed
x=x2 KE is minimum
x>x2 KE is maximum and velocity is maximum
x>x2 KE is minimum and velocity is minimum
Step by step video & image solution for Figure shows variation of potential energy veses displacement graph. find correct statement by Physics experts to help you in doubts & scoring excellent marks in Class 12 exams.
Updated on:21/07/2023Topper's Solved these Questions
- JEE MAIN 2021BOOK - JEE MAINS PREVIOUS YEARCHAPTER - JEE MAIN 2021EXERCISE - SECTION-A
80 Videos
- JEE MAIN 2021BOOK - JEE MAINS PREVIOUS YEARCHAPTER - JEE MAIN 2021EXERCISE - SECTION-B
40 Videos
- JEE MAINBOOK - JEE MAINS PREVIOUS YEARCHAPTER - JEE MAINEXERCISE - All Questions
473 Videos
- JEE MAIN 2022BOOK - JEE MAINS PREVIOUS YEARCHAPTER - JEE MAIN 2022EXERCISE - Question
492 Videos
Similar Questions
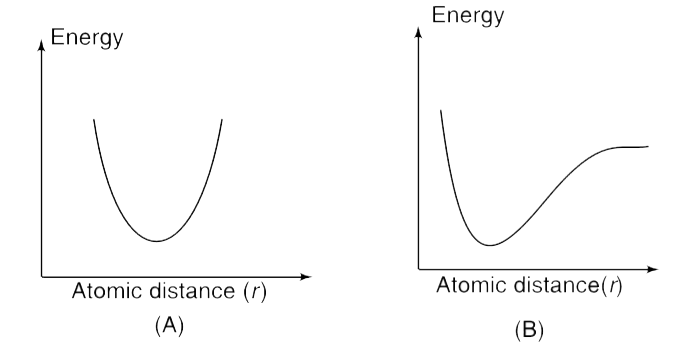
In the given figure graph B shows the variation of potential energy versus atomic separation (r) in a material. Argue qualitatively to show that if the potential energy graph was a symmetrical one as depicted in graph A, there would have been no thermal expansion on heatin
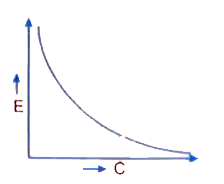
View SolutionThe graph shown here figure, shows the variation of the total energy (E) stored in a capacitor against the value of the capacitance (C) itself. Which of the two - the charge on the capacitor or the potential used to 4 charge it is kept constant for this graph ?
View Solution
Knowledge Check
Figure shows a graph of potential energy.
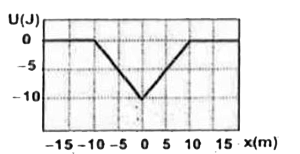
Consider the following graph of position and time , which represents the motion of the certain particle in the given potential. What is the total energy of the particle?
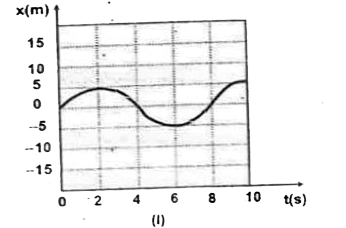 A−5JB0JC5JD10 J
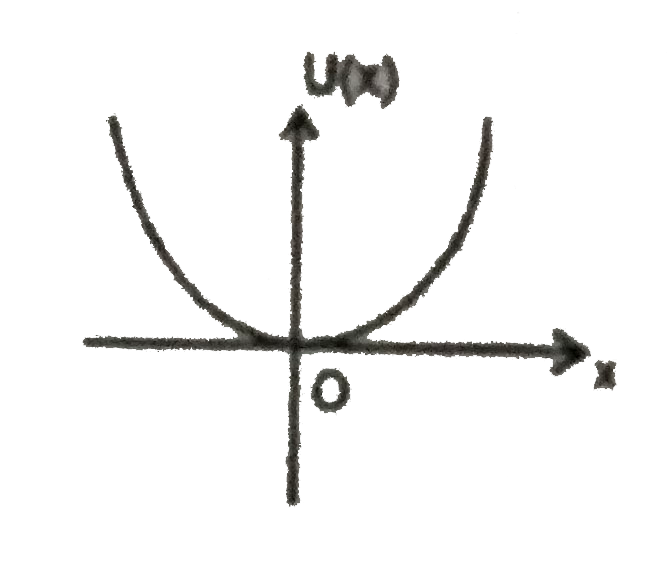
Figure shows a plot of potential energy function U(x)=kx2 where x=displacement and k=constant. Identify the correct conservative force function F(x)
 A
A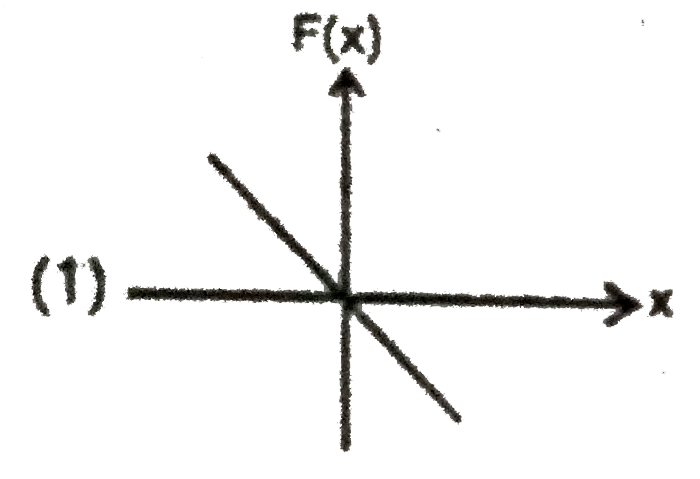 B
B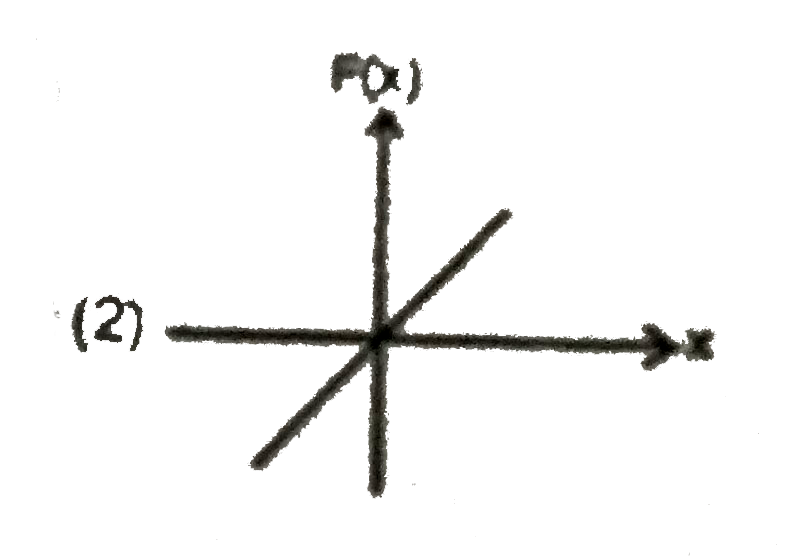 C
C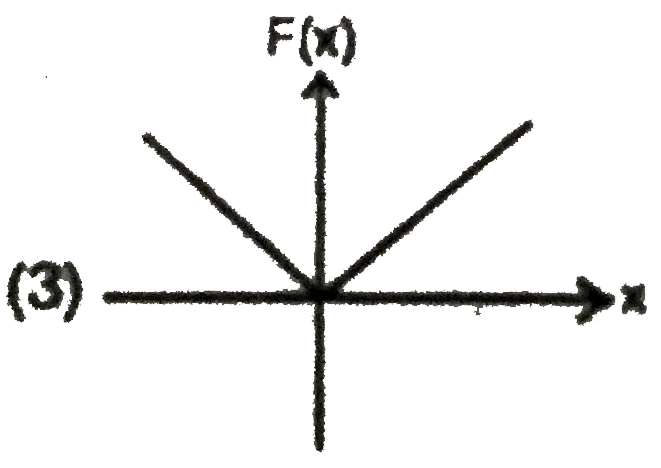 D
D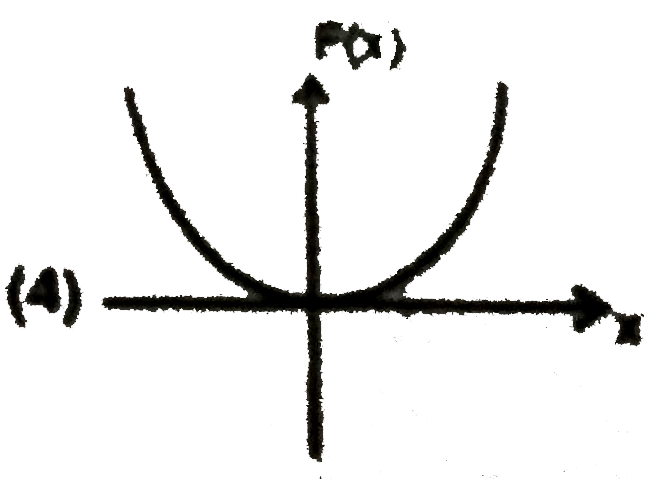
The correct graph showing variation of potential energy with internuclear distance when two hydrogen atoms approach each other is
ABCD
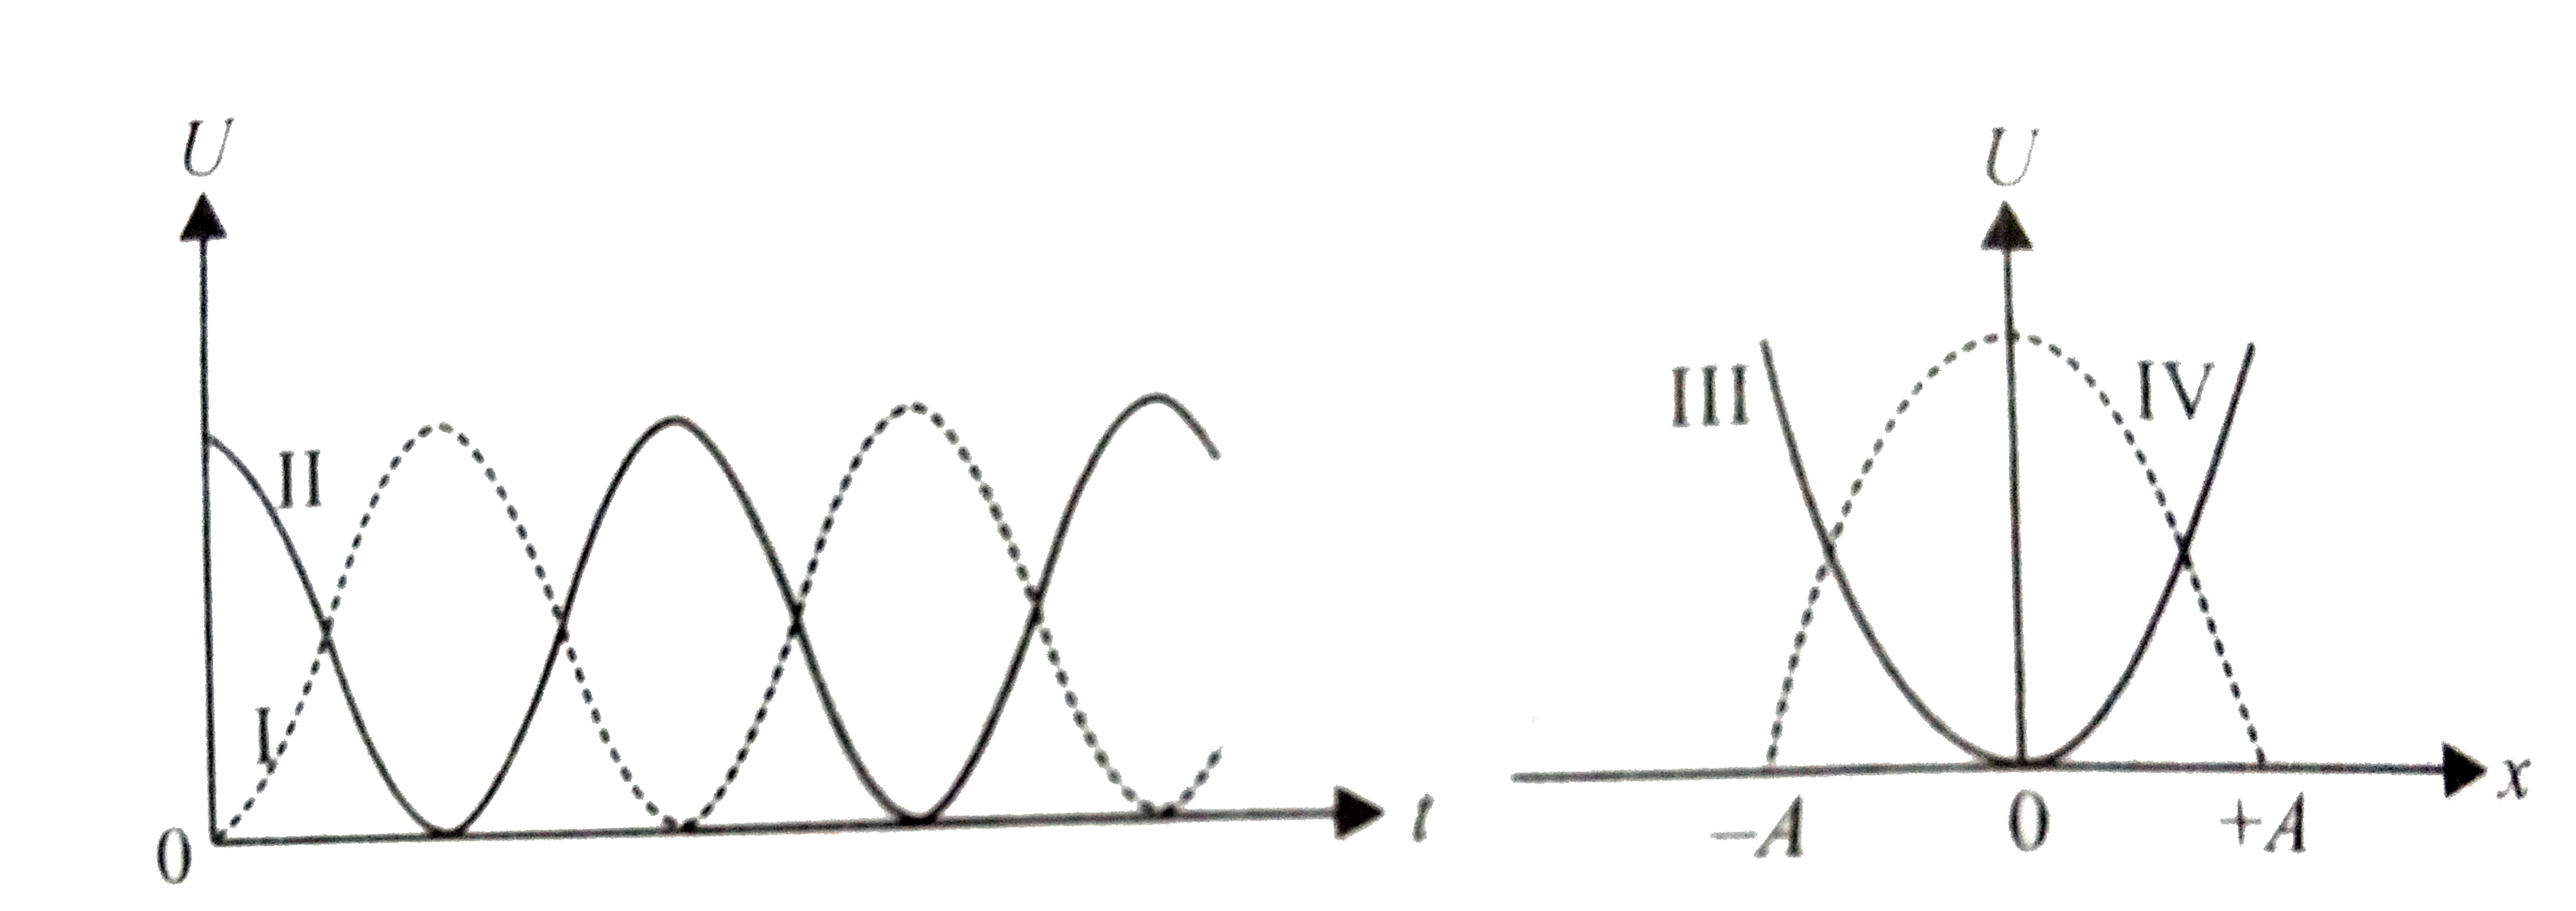
For a particle executing simple harmonic motion, the displacement x is given by x=Acosωt. Identify the graph, which represents the variation of potential energy (U) as a function of time t and displacement x.
View Solution(a) Draw a plot showing the variation of potential energy of a pair of nucleons as a function of their separation . Mark the regions where the nuclear force is :
(i) attractive and (ii) repulsive.
(b) In the nuclear reaction
n+235U→92aXe+54 94Sr+2nb determine the values of a and b .
View SolutionFigure shows a graph of potential energy.
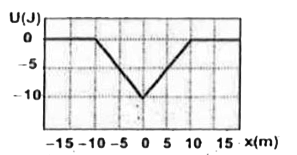
Consider the following graphs of position and time.
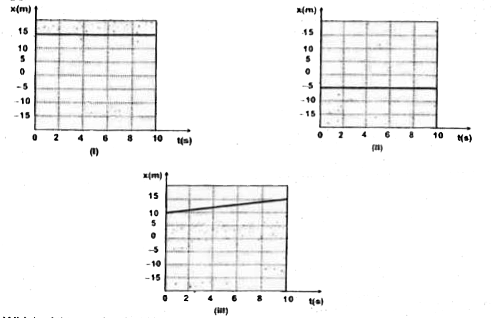
Which of the graphs could be the motion of a particle in the given potential?
View SolutionFigure shows the variation of force and displacement. The value of work done at the end of the displacement 30 m is
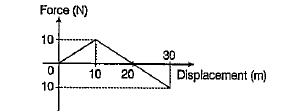
View SolutionIdentify the correct variation of potential energy U as a function of displacement x from mean position (or x2) of a harmonic oscillator (U at mean position =0)
View Solution
