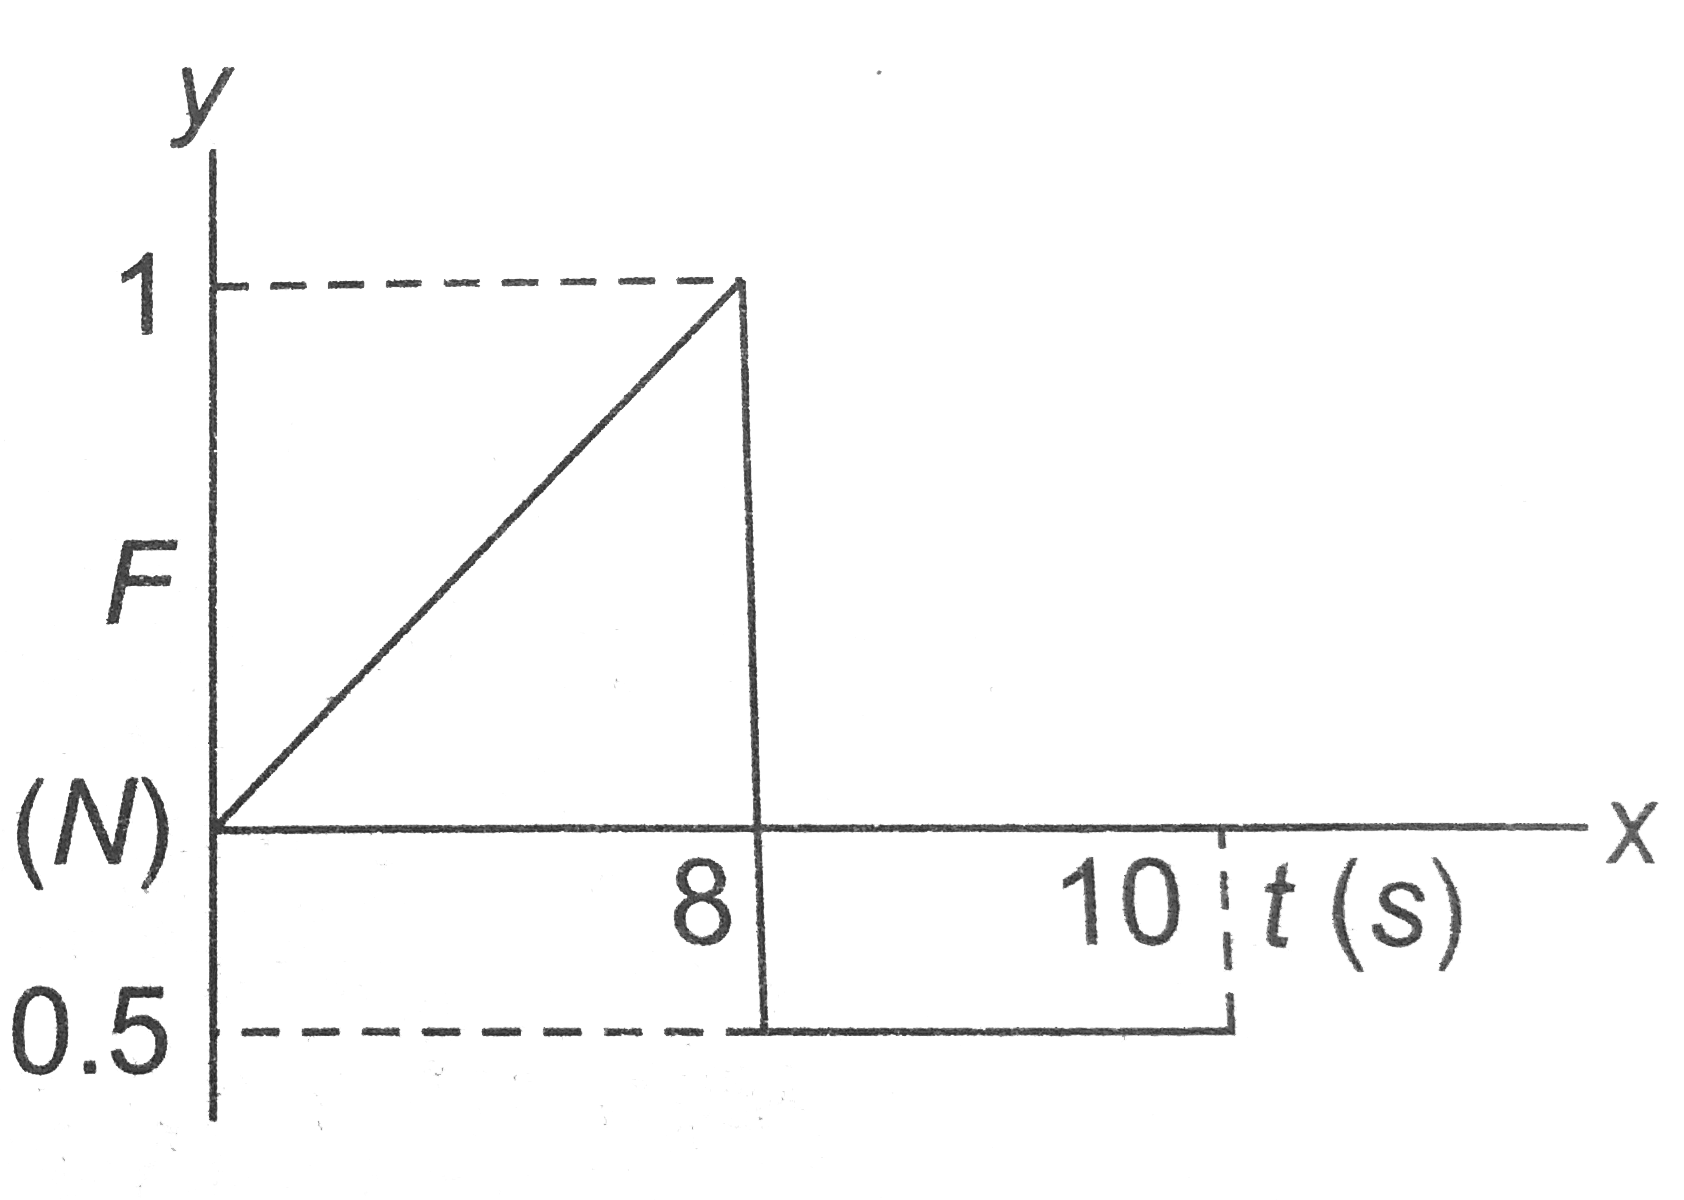
A force time graph for the motion of a body is as shown in figure. Change in linear momentum between 0 and 6s is

A
Zero
B
8 Ns
C
4 Ns
D
2 Ns
Text Solution
The correct Answer is:A
|
Topper's Solved these Questions
- LAWS OF MOTIONBOOK - AAKASH SERIESCHAPTER - LAWS OF MOTIONEXERCISE - PRACTICE EXERCISE
108 Videos
- LAWS OF MOTIONBOOK - AAKASH SERIESCHAPTER - LAWS OF MOTIONEXERCISE - EXERCISE - I
158 Videos
- KINETIC THEORY OF GASESBOOK - AAKASH SERIESCHAPTER - KINETIC THEORY OF GASESEXERCISE - Practice Exercise
15 Videos
- MECHANICAL PROPERTIES OF FLUIDS BOOK - AAKASH SERIESCHAPTER - MECHANICAL PROPERTIES OF FLUIDS EXERCISE - EXERCISE-3
43 Videos
Similar Questions
Knowledge Check
A force-time graph for the motion of a body is shown in figure. Change in linear momentum between 0 and 8 s is:
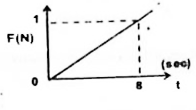 AZeroB4 N-sC8 NsDNone of these
A force time graph for the motion of a body is as shown in Change in linear momentum between 0 and 6s is
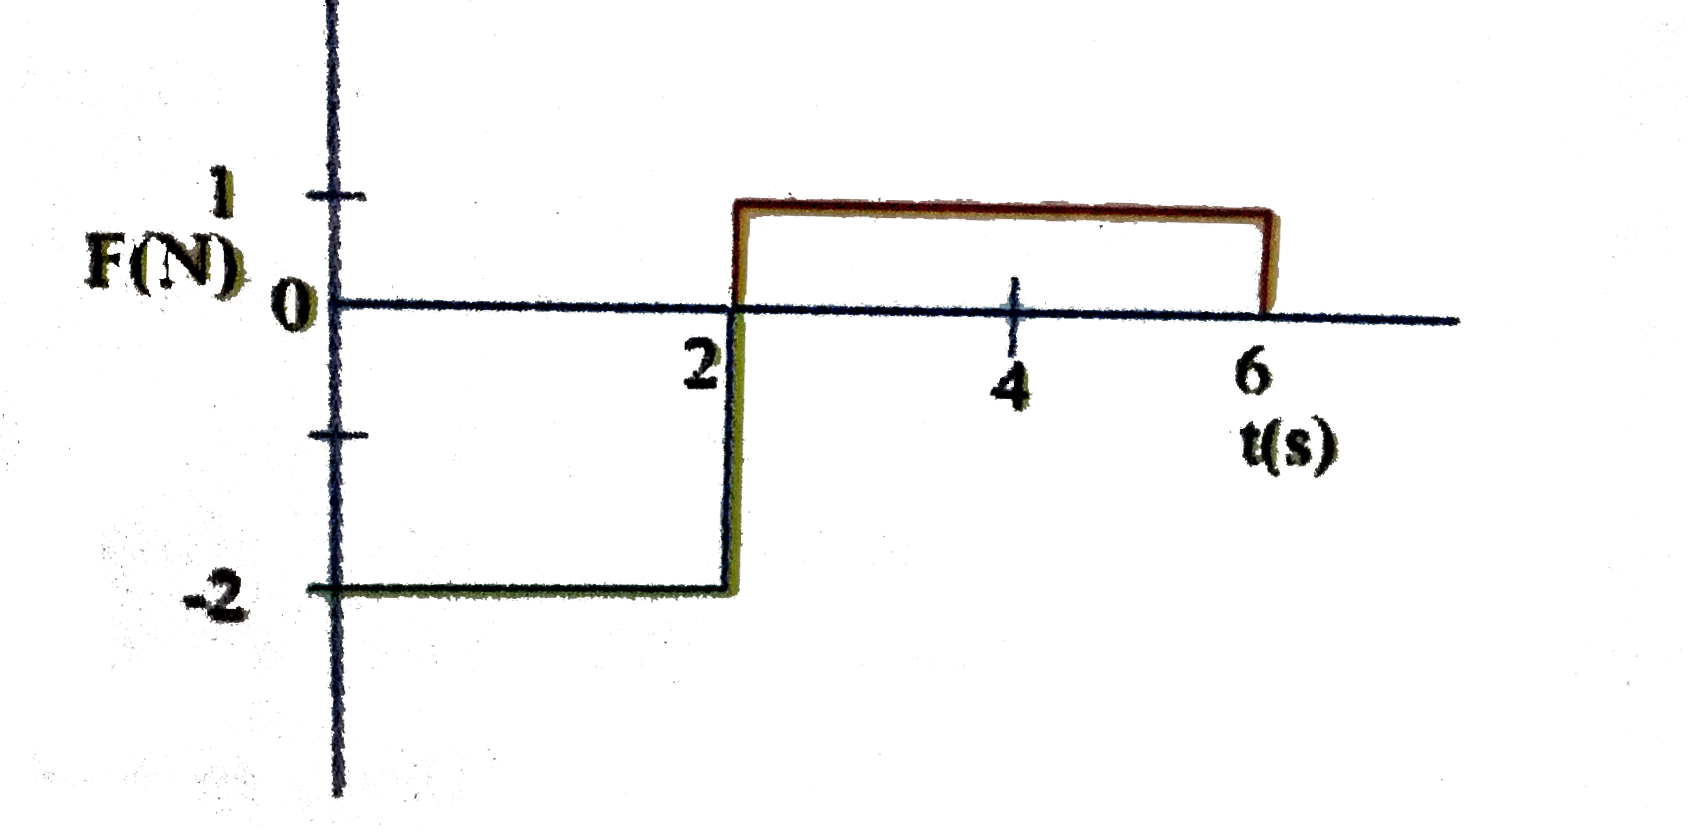 .AzeroB8NsC4NsD2Ns
A force-time graph for the motion of a body is shown in fig. change in linear momentum between 0 and 8 s is:-
 AZeroB4N-sC8NsDNone
A force-time graph for the motion of a body is shown in fig. Change in linear momentum between 0 and 8s is :
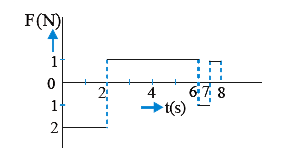
View SolutionA force-time graph for the motion of a body is shown in fig. Change in linear momentum between 0 and 8s is :

View SolutionA force-time graph for the motion of a body is shown in fig. change in linear momentum between 0 and 8 s is:-

View SolutionA force-time graph for a linear motion is shown in figure. The linear momentum gained between 0 and 6 second is
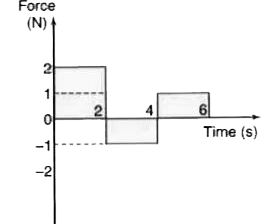
View SolutionA force-time graph for the motion of a body is shown in the figure. The change in the momentum of the body between zero and 10sec is
View Solution

