A force-time graph for the motion of a body is shown in fig. Change in linear momentum between 0 and 8s is :
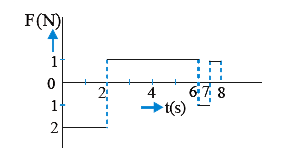
zero
4 Ns
8 Ns
None
The correct Answer is:A
Step by step video & image solution for A force-time graph for the motion of a body is shown in fig. Change in linear momentum between 0 and 8s is : by Physics experts to help you in doubts & scoring excellent marks in Class 12 exams.
Updated on:21/07/2023Topper's Solved these Questions
- LAWS OF MOTION BOOK - VMC MODULES ENGLISHCHAPTER - LAWS OF MOTION EXERCISE - ENABLE
50 Videos
- LAWS OF MOTION BOOK - VMC MODULES ENGLISHCHAPTER - LAWS OF MOTION EXERCISE - EFFICIENT
50 Videos
- KINEMATICS OF A PARTICLE BOOK - VMC MODULES ENGLISHCHAPTER - KINEMATICS OF A PARTICLE EXERCISE - JEE Advanced (archive)
14 Videos
- LIQUIDSBOOK - VMC MODULES ENGLISHCHAPTER - LIQUIDSEXERCISE - JEE ADVANCED (LEVEL -2)
55 Videos
Similar Questions
A force-time graph for the motion of a body is shown in fig. change in linear momentum between 0 and 8 s is:-

View SolutionA force-time graph for the motion of a body is shown in figure. Change in linear momentum between 0 and 8 s is:
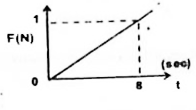
View SolutionA force lime graph for the motion of a body is as shown in figure. Change in linear momentum between 0 and 6s is:

View SolutionForce-time graph of a particle of mass 6 kg is shown in figure, then change in linear momentum during t = 0 to t = 10 s is
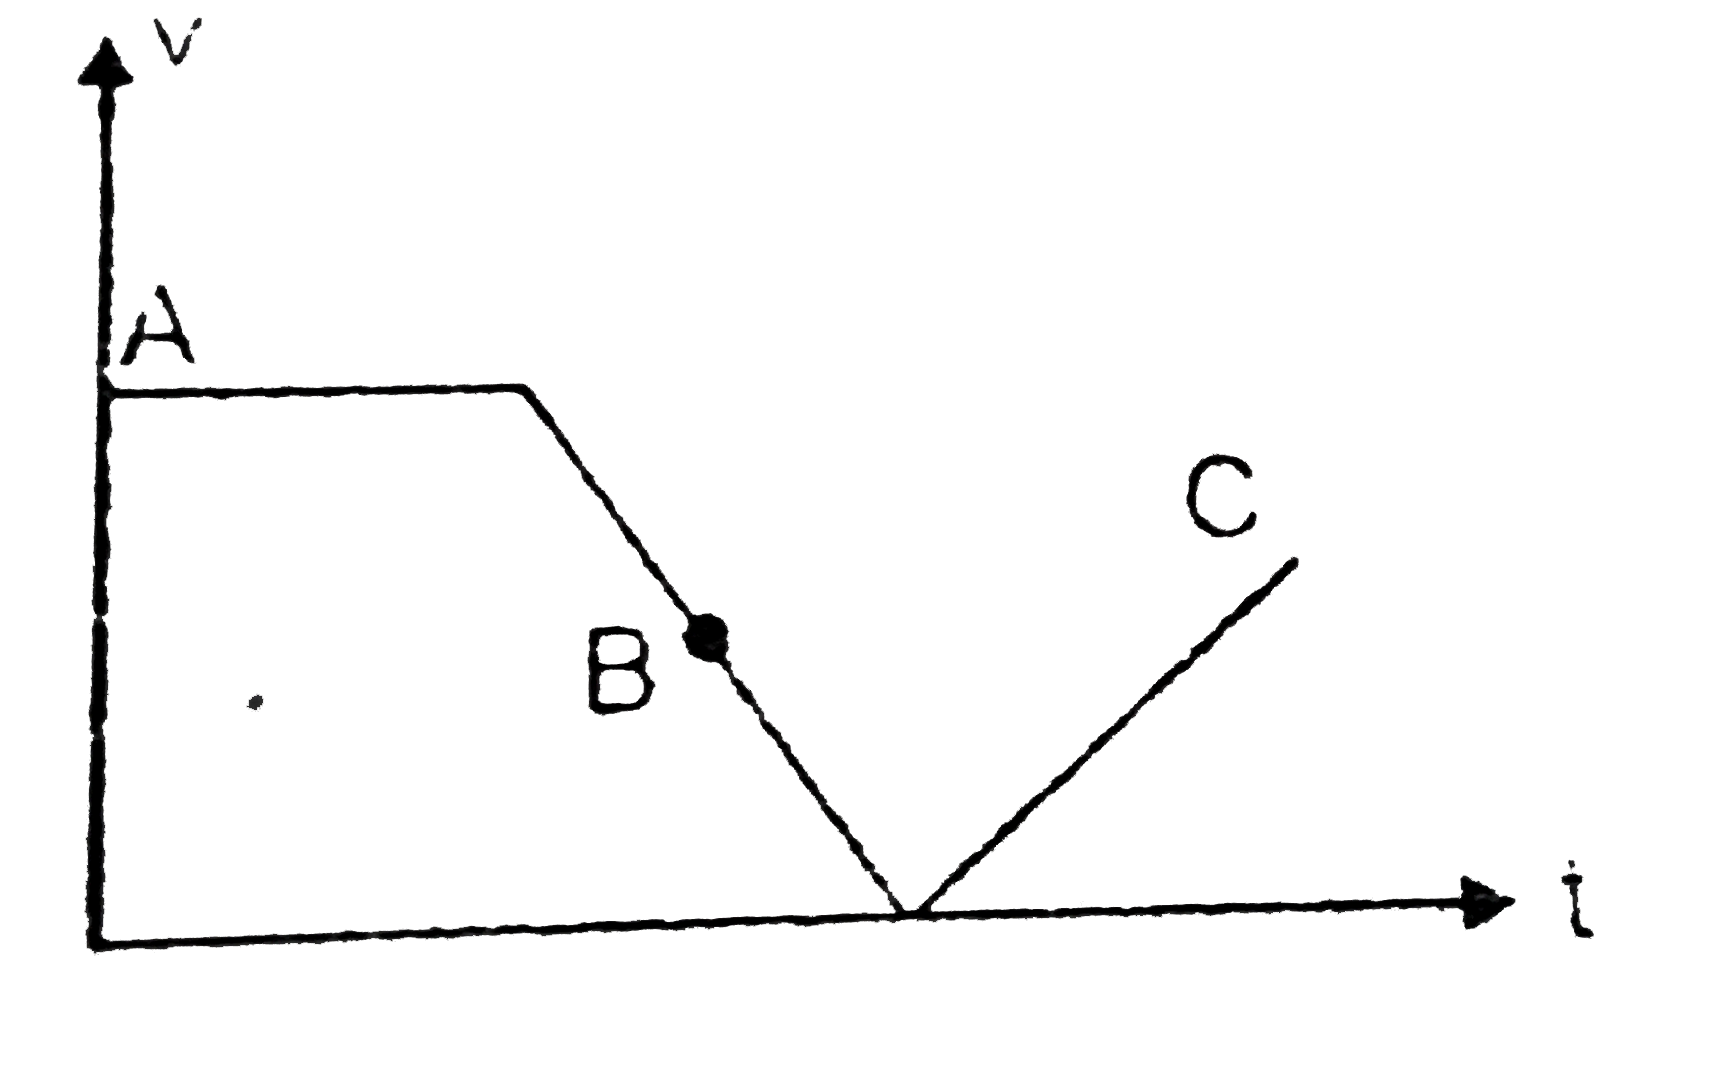
View SolutionVelocity-time graph for the motion of a certain body is shown in Fig. Explain the nature of this motion. Find the initial velocity and acceleration and write the equation for the variation of displacement with time. What happens to the moving body at point B? How does the body move after this moment ?
View SolutionThe velocity time graph of a body is shown in fig. it indicates that :
View Solutions-t graph of a particle in motion is shown in Fig. Calculate
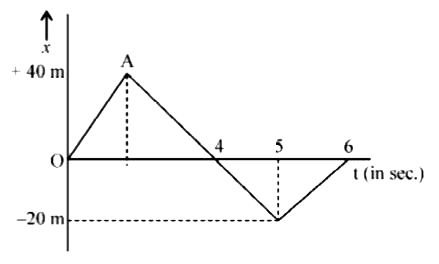
Displacement
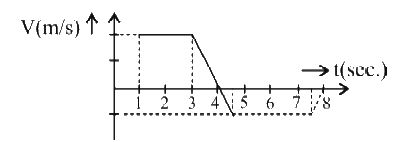
View SolutionThe velocity-time graph of a linear motion is shown in figure. The displacement from the origin after 8 sec is :
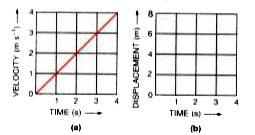
View SolutionFig. 2.41 (a) shows the velocity-time graph for the motion of a body. Use it to find the displacement of the body at t = 1 s, 2 s, 3 s and 4 s, then draw the displacement-time graph for it on Fig. 2.41 (b).
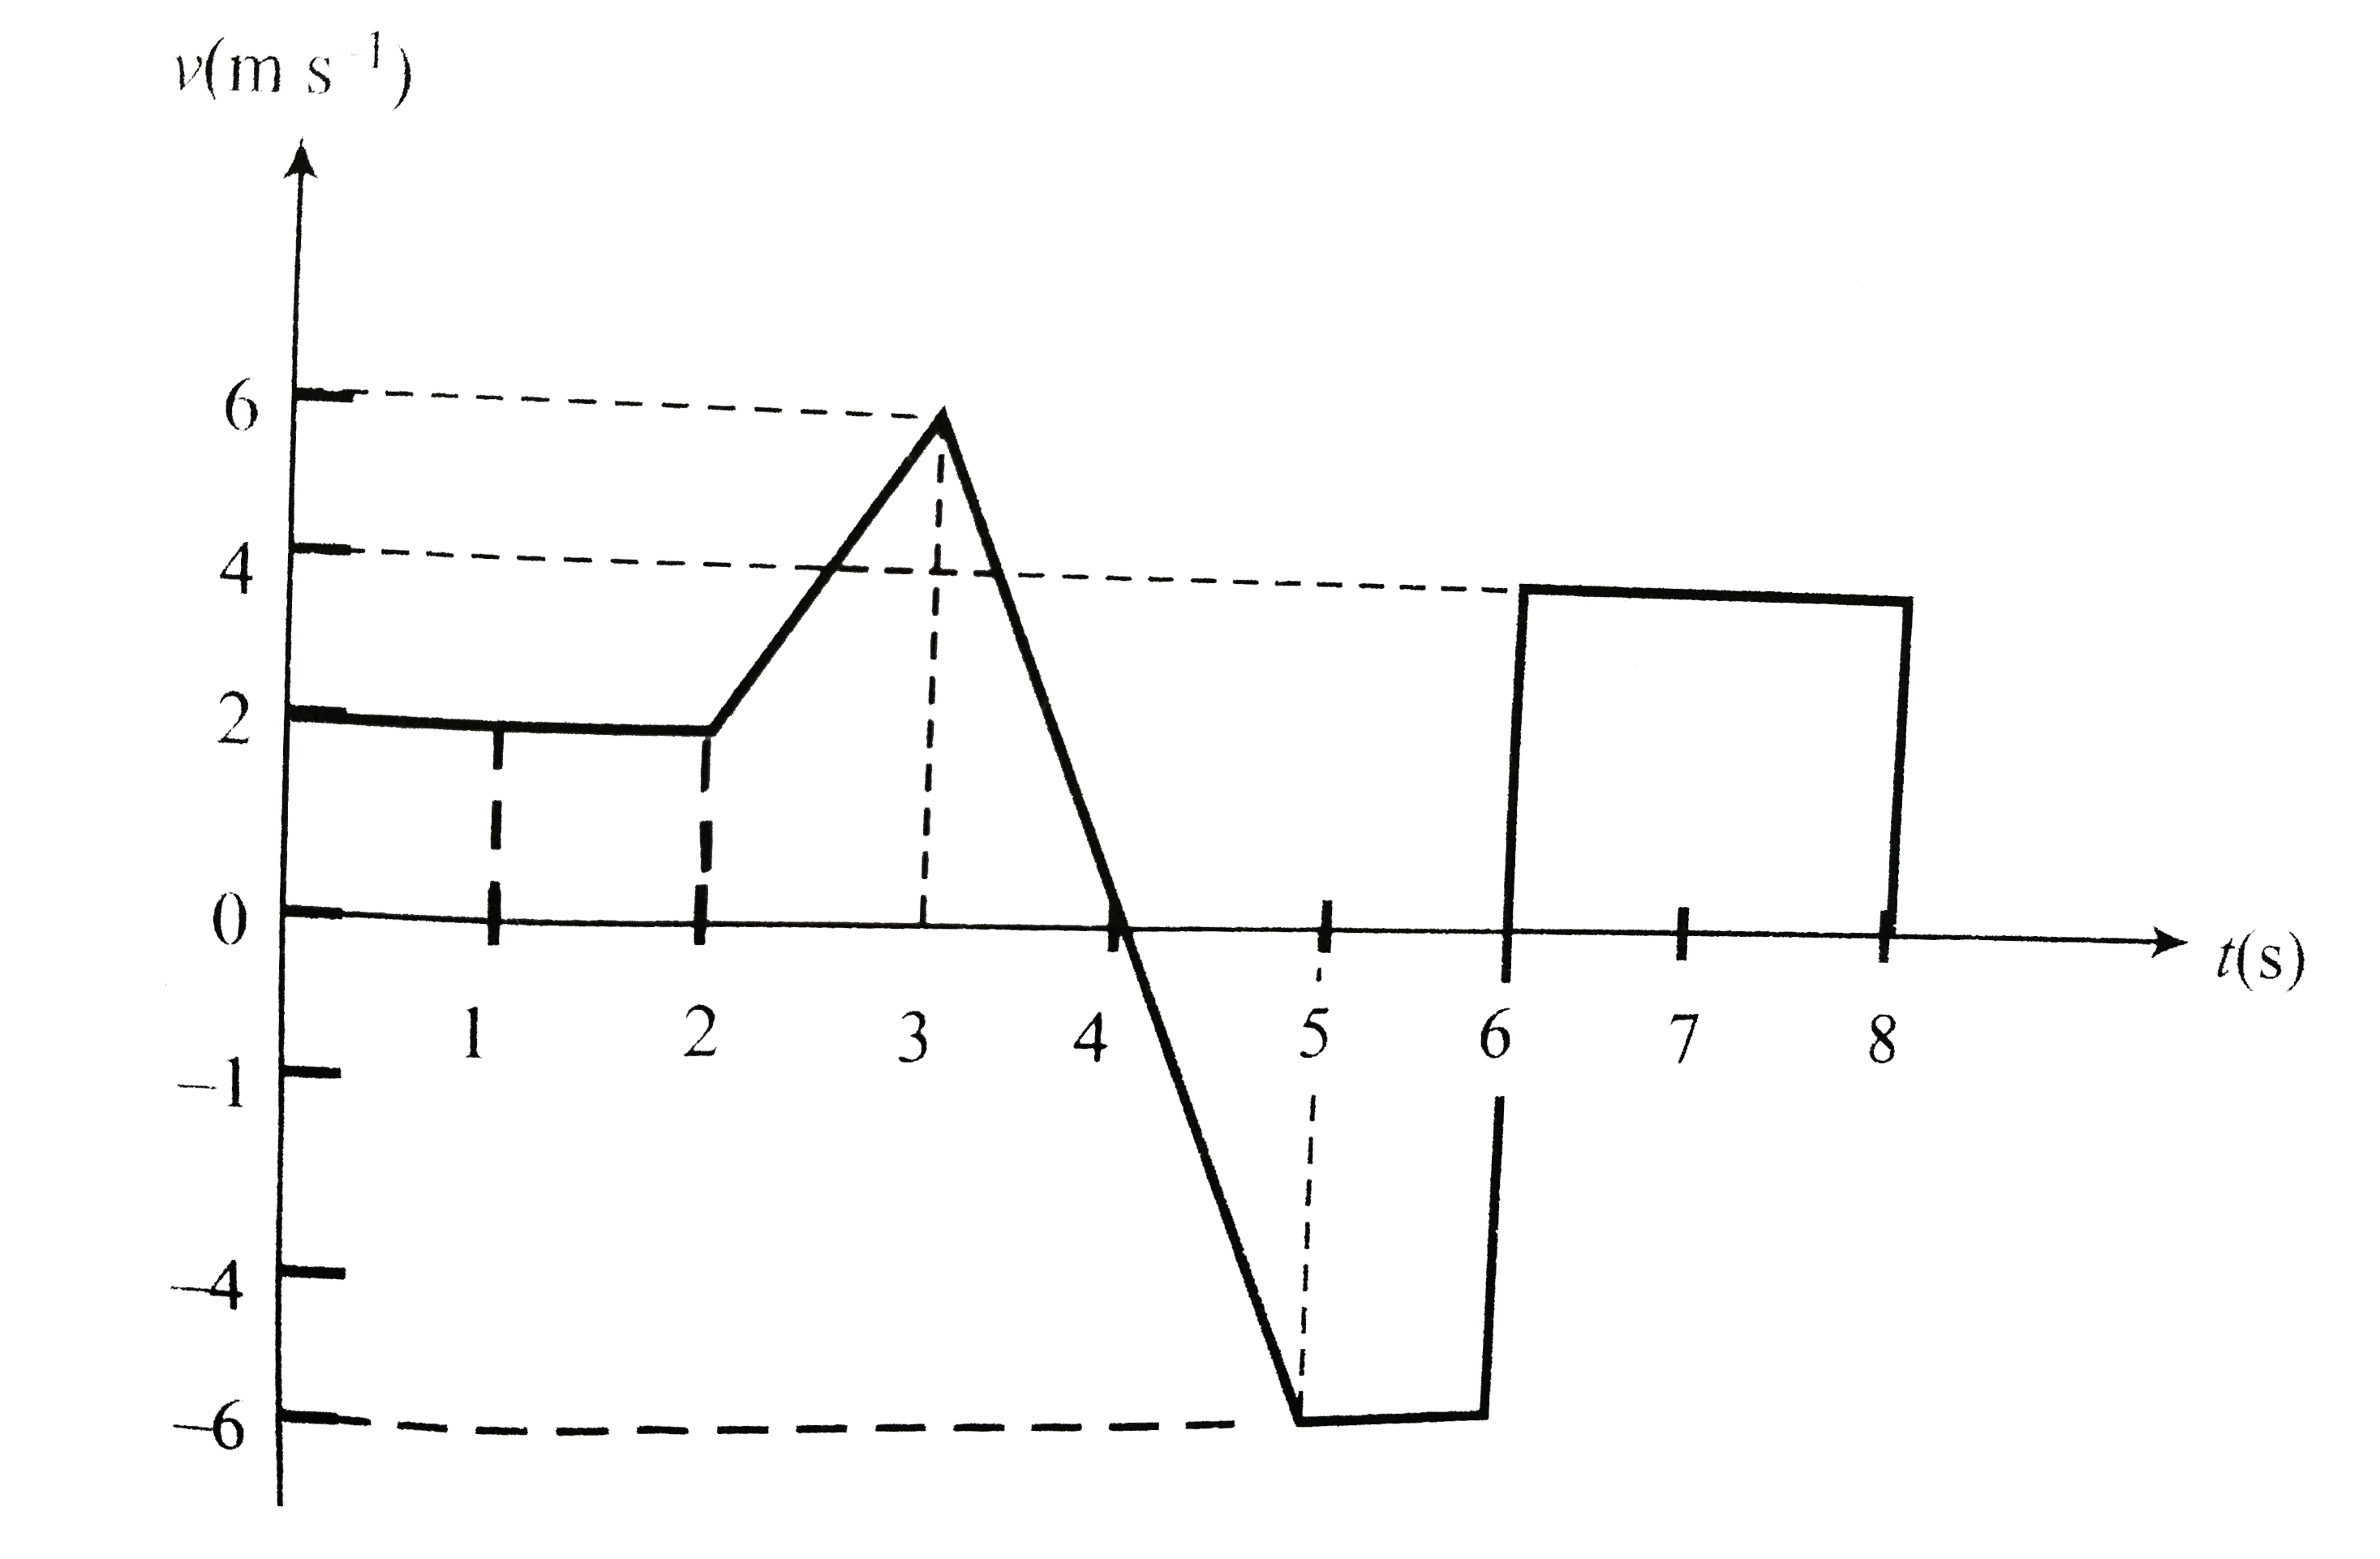
View SolutionThe velocity-time graph of a body is shown in .
The displacement of the body in 8s is.
 .
.
View Solution
