Suppose the two photographs, shown in fig.13.1 and fig 13.2, had been taken at an interval of 10 seconds. If a distance of 100 metres is shown by 1 cm in these photographs, calculate the speed of the blue car.Solution in Punjabi
Step by step video & image solution for Suppose the two photographs, shown in fig.13.1 and fig 13.2, had been taken at an interval of 10 seconds. If a distance of 100 metres is shown by 1 cm in these photographs, calculate the speed of the blue car. by Physics experts to help you in doubts & scoring excellent marks in Class 7 exams.
Updated on:21/07/2023Topper's Solved these Questions
Similar Questions
Fill in the blanks: An image that cannot be obtained on a screen is called ___________.
View SolutionFill the missing word in the blank spaces in the following statements :Wind is ________air.
View SolutionThe velocity time graph of a body represented as shown in Fig. Calculate the distance by the body in 5 second.

View Solutions-t graph of a particle in motion is shown in Fig. Calculate
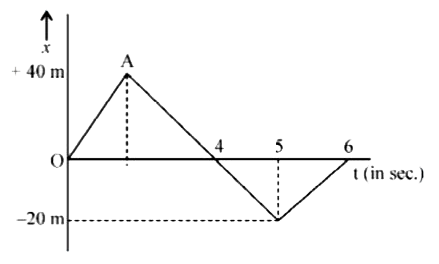
Average speed
View SolutionThe speed-time graph for a car is shown is Fig.
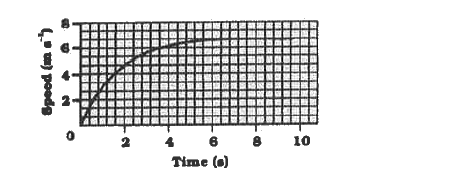
Find how far does the car travel in the first 4 seconds. Shade the area on the graph that represents the distance travelled by the car during the period.
View SolutionThe speed-time graph for a car is shown is Fig.
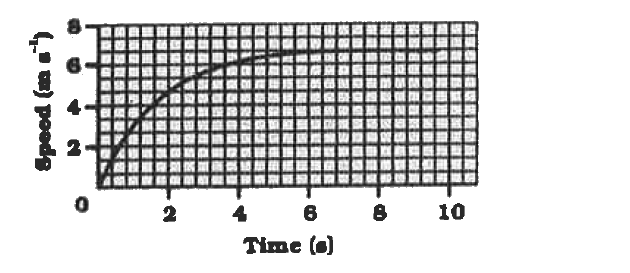
Which part of the graph represents uniform motion of the car?
View SolutionThe speed time graph for a car is shown in fig 8.12
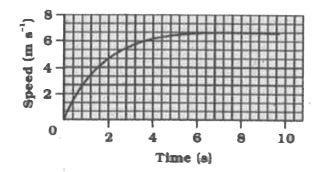
Find out how far the car travels in the first 4 seconds. Shade the area on the graph that represents the distance travelled by the car during the period.
View SolutionThe speed time graph for a car is shown in fig 8.12
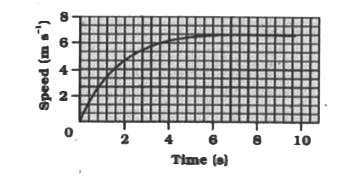
Which part of the graph represents uniform motion of the car?
View SolutionThe distance measured between two points on a map is 2 cm. The corresponding distance on an aerial photograph is 10 cm. Calculate the scale of the photograph when the scale of the map is 1: 50,000. Ans.
View SolutionThe speed-time graph for a car is shown in Fig.8.12. Find how far does the car travel in the first 4 seconds. Shade the area on the graph that represents the distance travelled by the car during the period.

View SolutionThe variation in the speed of a car during it's two hours journey is shown in the fig. The magnitude of maximum acceleration of the car occupies in the interval of
View SolutionIn Fig.(i), a lens of focal length 10 cm is shown. It is cut into two parts and placed as shown in Fig.(ii). An object AB of light 1 cm is placed at a distance of 7.5 cm. The height of the image will be
View Solutions-t graph of a particle in motion is shown in Fig. Calculate

Average speed
View Solutionमान लीजिए चित्र 13.3 तथा चित्र 13.4 में दर्शाए गए फोटोग्राफ 10 सेकंड के अंतराल पर खींचे गए। यदि इन फोटोग्राफों में 100 मीटर की दूरी को 1 cm द्वारा दर्शाया गया है, तो रेखांकित नीली कार की चाल परिकलित कीजिए।
View SolutionThe arrangement to store two magnets is shown by figures (a), (b), (c) and (d) in Fig. 13.2. Which one of them is the correct arrangement
View Solution
