A particle is projected up from a point at an angle 'θ' with the horizontal direction. Which of the following graph represents the variation kinetic energy (K) with time (t)
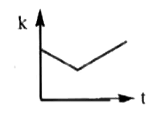
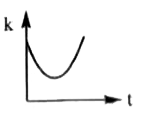
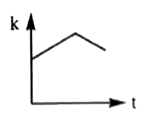
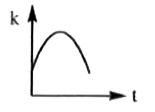
The correct Answer is:B
Similar Questions
A body moves from rest with a constant acceleration. Which one of the following graphs represents the variation of its kinetic energy K with the distance travelled x?
View SolutionA body moves from rest with a constant acceleration. Which one of the following graphs represents the variation of its kinetic energy K with the distance travelled x?
View Solution
Knowledge Check
A body moves from rest with a constant acceleration. Which one of the following graphs represents the variation of its kinetic energy K with the distance travelled x?
A B
B C
C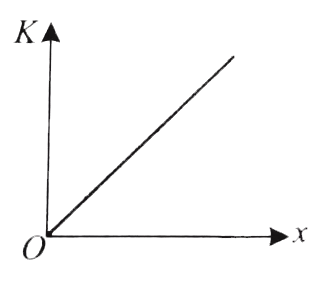 D
D
A body moves from rest with a constant acceleration. Which one of the following graphs represents the variation of its kinetic energy K with the distance travelled x?
A B
B C
C D
D
Which of the following graphs represents the variation of activity (A) of a radioactive substance with time (t).
A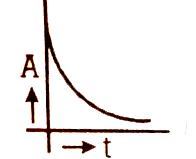 B
B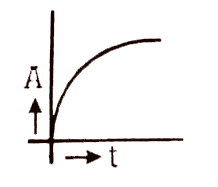 C
C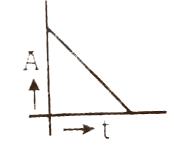 D
D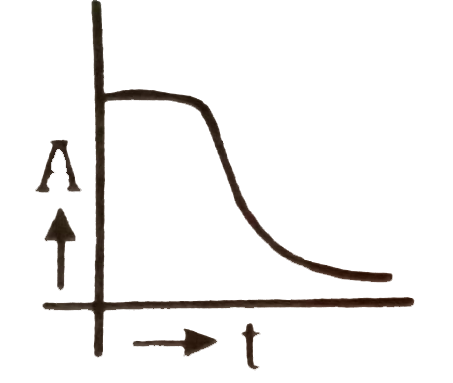
A particle is projected from a point of an angle with the horizontal. At any instant t, if p is the linear momentum and E the kinetic energy, then which of the following graph is/are correct?
View SolutionA projectile is projected with a velocity u at an angle θ with the horizontal. For a fixed θ, which of the graphs shown in the following figure shows the variation of range R versus u?
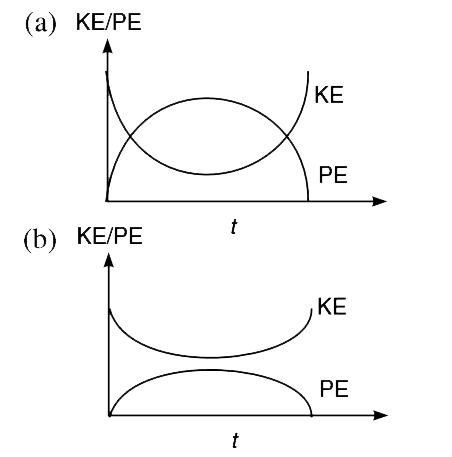
View SolutionA particle is projected at an angle θ=30∘ with the horizontal. Two students A and B have drawn the variation of kinetic energy and gravitational potential energy of the particle as a function of time taking the point of projection as the reference level for the gravitational potential energy. Who is wrong and why?
View SolutionA particle is projected from a point of an angle with the horizontal. At any instant t, if p is the linear momentum and E the kinetic energy, then which of the following graph is/are correct?
View SolutionA projectile is projected with a velocity u at an angle θ with the horizontal. For a fixed θ, which of the graphs shown in the following figure shows the variation of range R versus u?
View Solution
