The x-t plot of a car is shown in the figure. The average velocity is zero in the time interval between 0 and t then t=_____sec.
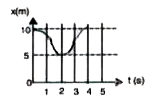
2
4
1
3
The correct Answer is:B
Topper's Solved these Questions
- BOOK - AAKASH SERIESCHAPTER - KINEMATICSEXERCISE - PRACTICE SHEET (EXERCISE-III) (Graphs) (LEVEL-II) (Straight Objective Type Questions)4videos
KINEMATICS
- BOOK - AAKASH SERIESCHAPTER - KINEMATICSEXERCISE - PRACTICE SHEET (EXERCISE-IV) (LEVEL-II) (2D motion Objective Type Questions) (Straight Objective Type Questions)2videos
KINEMATICS
- BOOK - AAKASH SERIESCHAPTER - KINEMATICSEXERCISE - PRACTICE SHEET (EXERCISE-II) ( Vertical Motion ) ( LEVEL-II) ( Integer Type Questions)1videos
KINEMATICS
- BOOK - AAKASH SERIESCHAPTER - HORIZONTAL CIRCULAR MOTIONEXERCISE - ADDITIONAL PRACTICE EXERCISE (PRACTICE SHEET (ADVANCED) Integer Type Questions)3videos
HORIZONTAL CIRCULAR MOTION
- BOOK - AAKASH SERIESCHAPTER - KINETIC THEORY OF GASESEXERCISE - Practice Exercise15videos
KINETIC THEORY OF GASES
Similar Questions
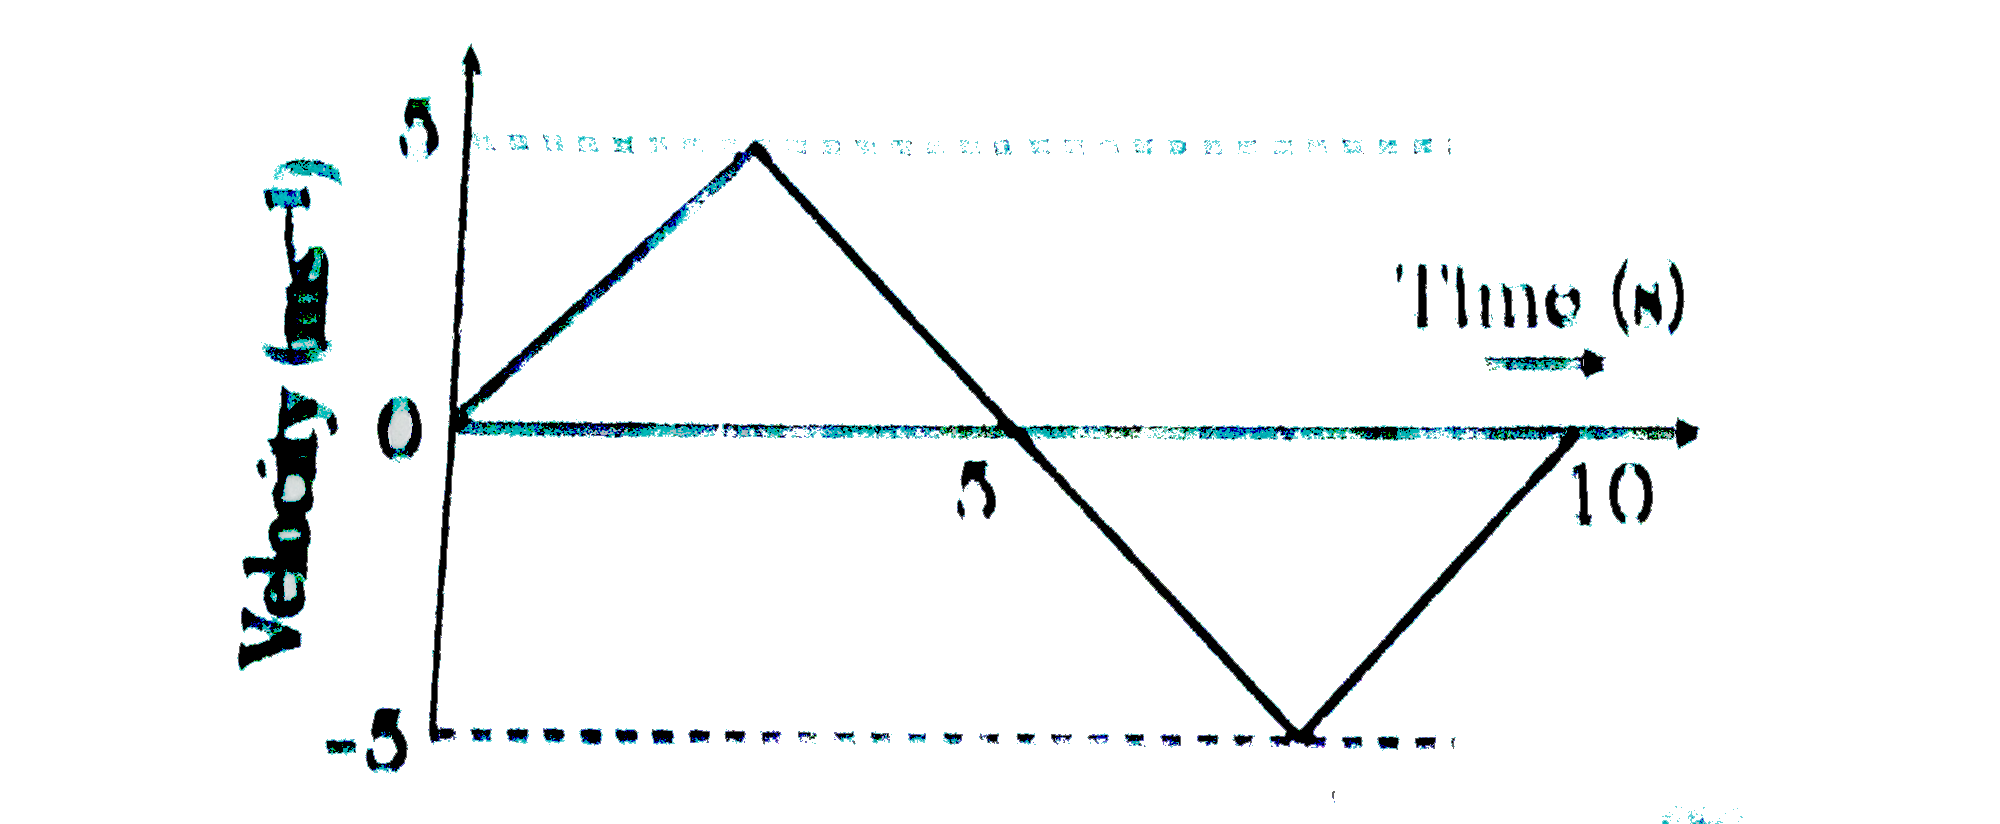
The v-t plot of a moving object ios shown in the figure. The average velocity of the object during the first 10 s is
 View Solution
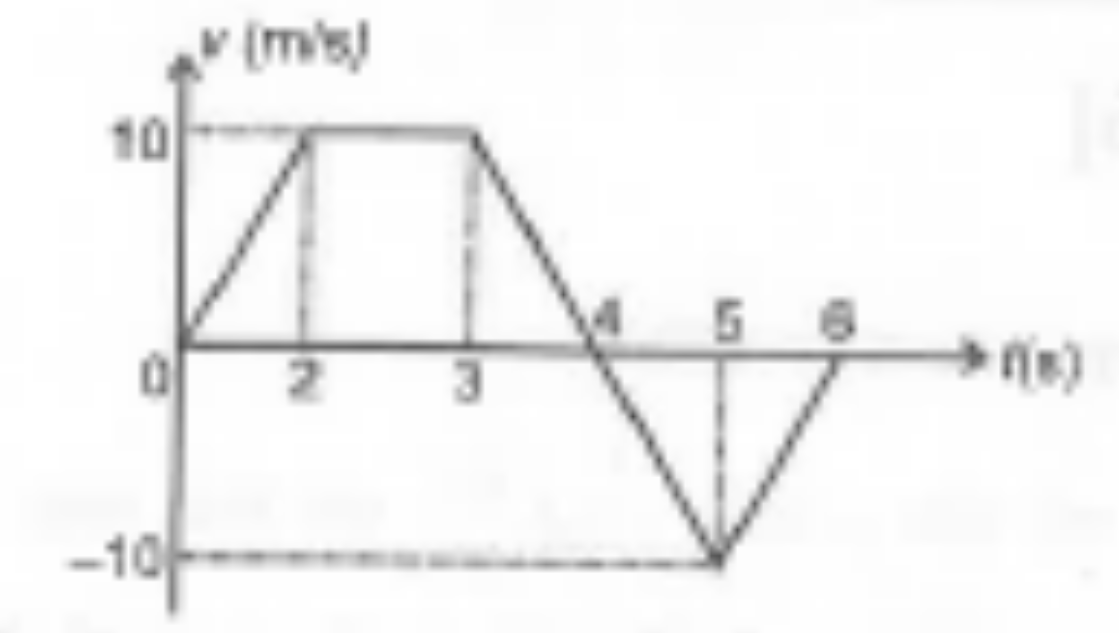
The velocity (v)-time (t) graph of a partide moving along a straight line is as shown in the figure. The displacement of the particle from t = 0 to t = 4 is
 View Solution
Knowledge Check
- Question 1 - Select One
The v-t plot of a moving object ios shown in the figure. The average velocity of the object during the first 10 s is
 AzeroB2.5ms−1C5ms−1D2ms−1
 - Question 2 - Select One
Veolocity-time graph of a particle undergoing rectilinear motioin is plotted upto t=t4 as shown in the figure. Average acceleration of the particle is zero in the time internal between
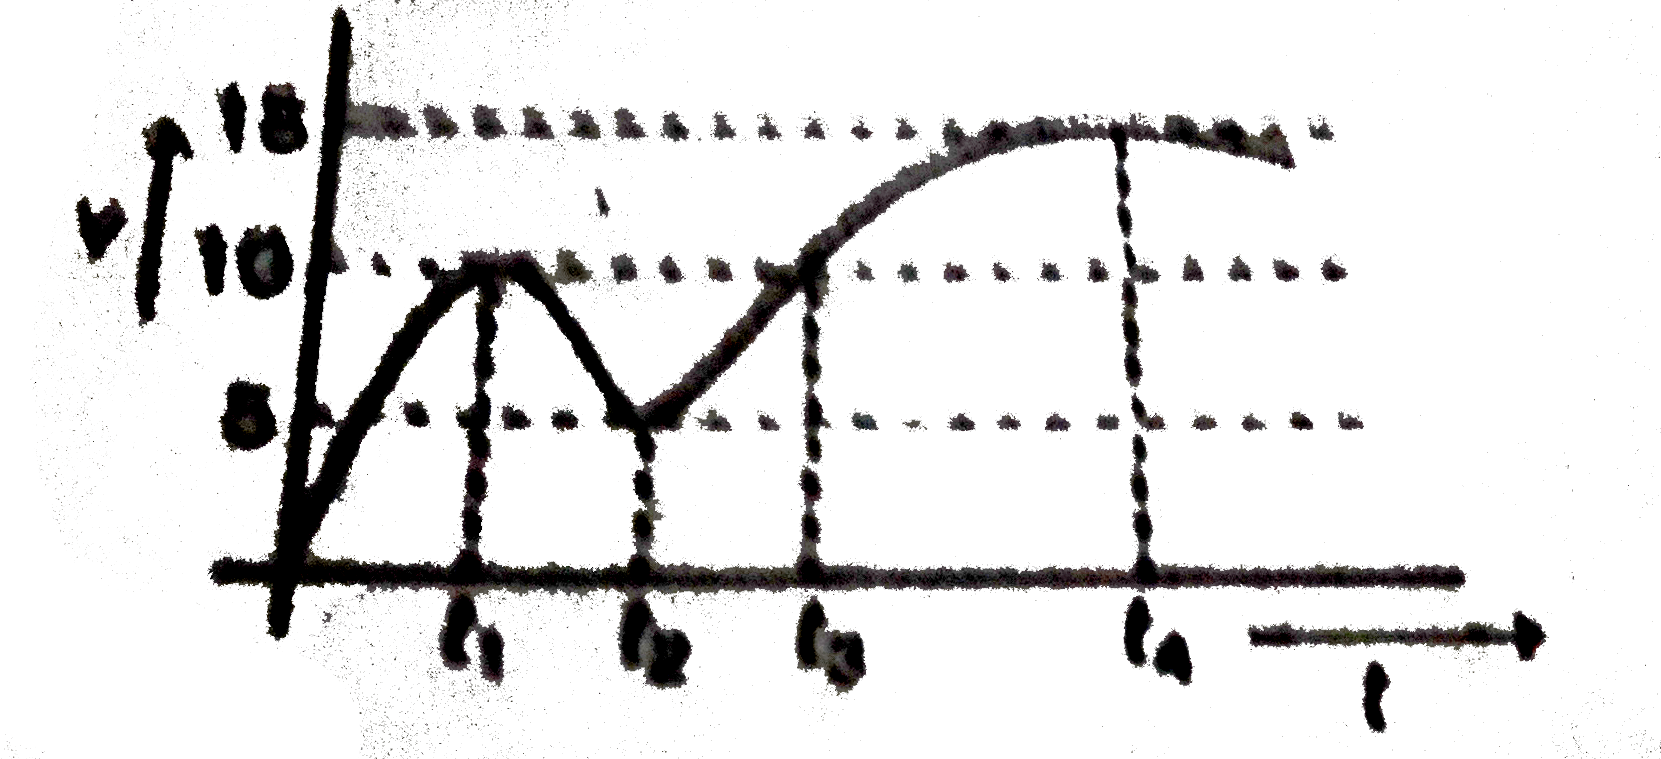 A0 and t1Bt1 and t2Ct1 and t3Dt2 and t4
 - Question 3 - Select One
The velocity-time plot is shown in figure. Find the average speed in time interval t=0 to t=40s during the period.
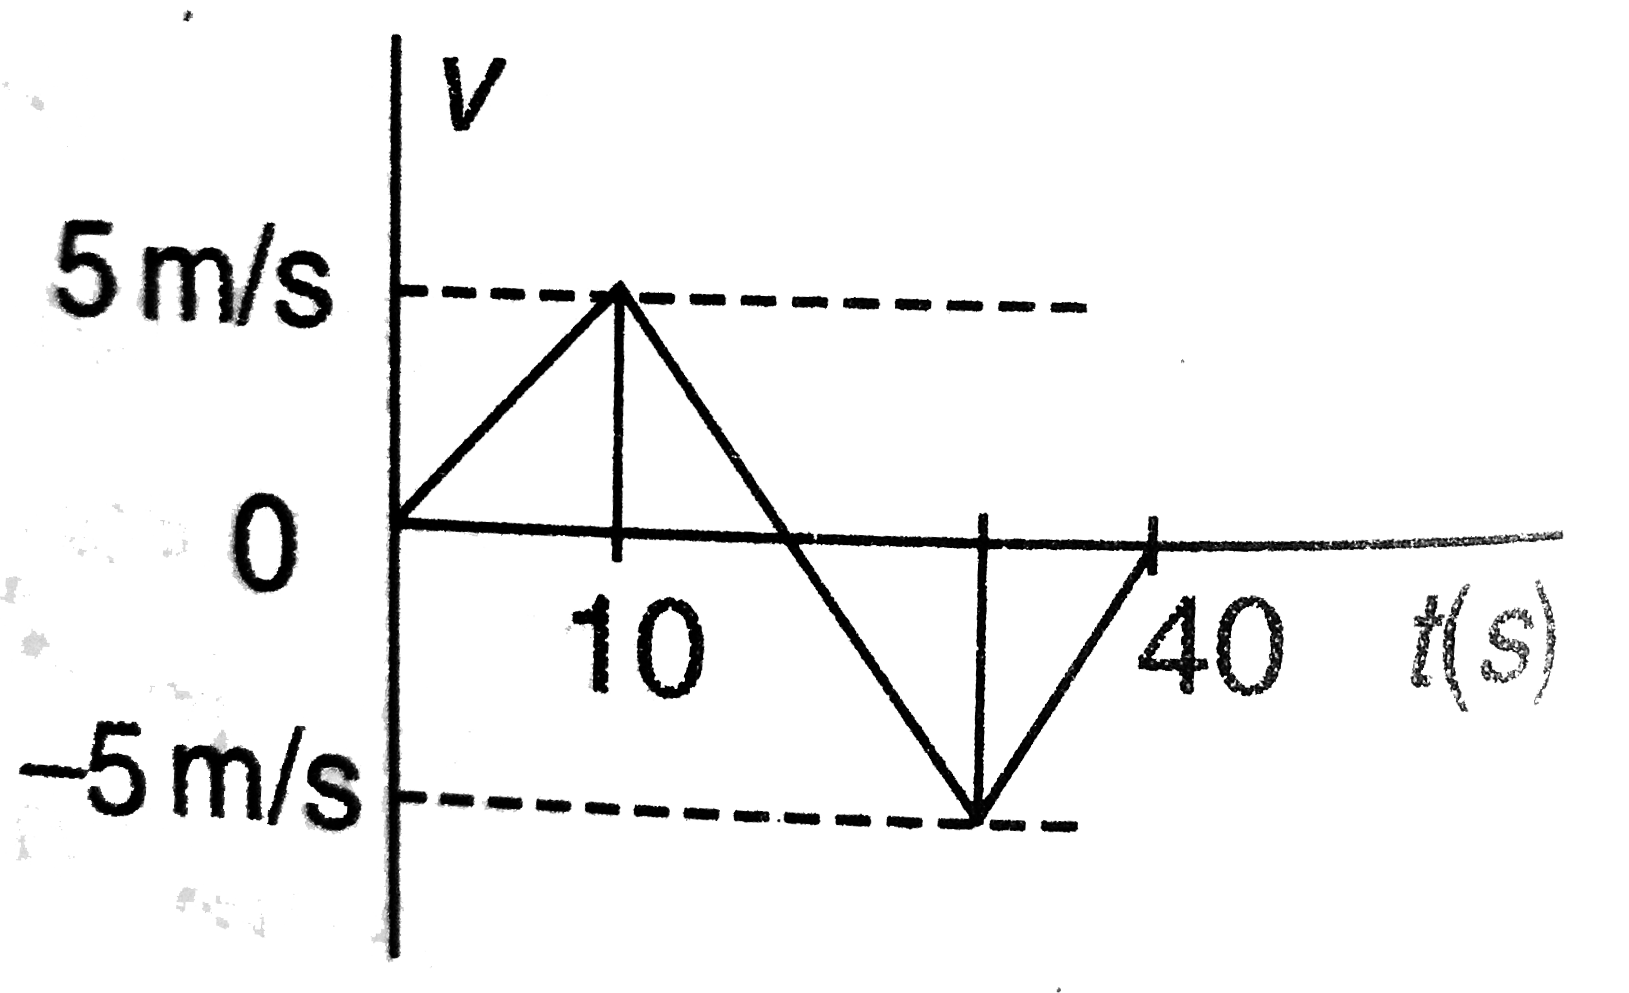 AzeroB2.5m/sC5m/sDnone
The velocity (v) - time (t) graph for a particle moving along x -axis is shown in the figure.The average velocity in the time interval t=0 to t=8s is
1)4.5ms
2) 2.5ms
3) 5ms
4)2msView SolutionThe v-t graph for a particle moving along x-axis is shown in the figure, find
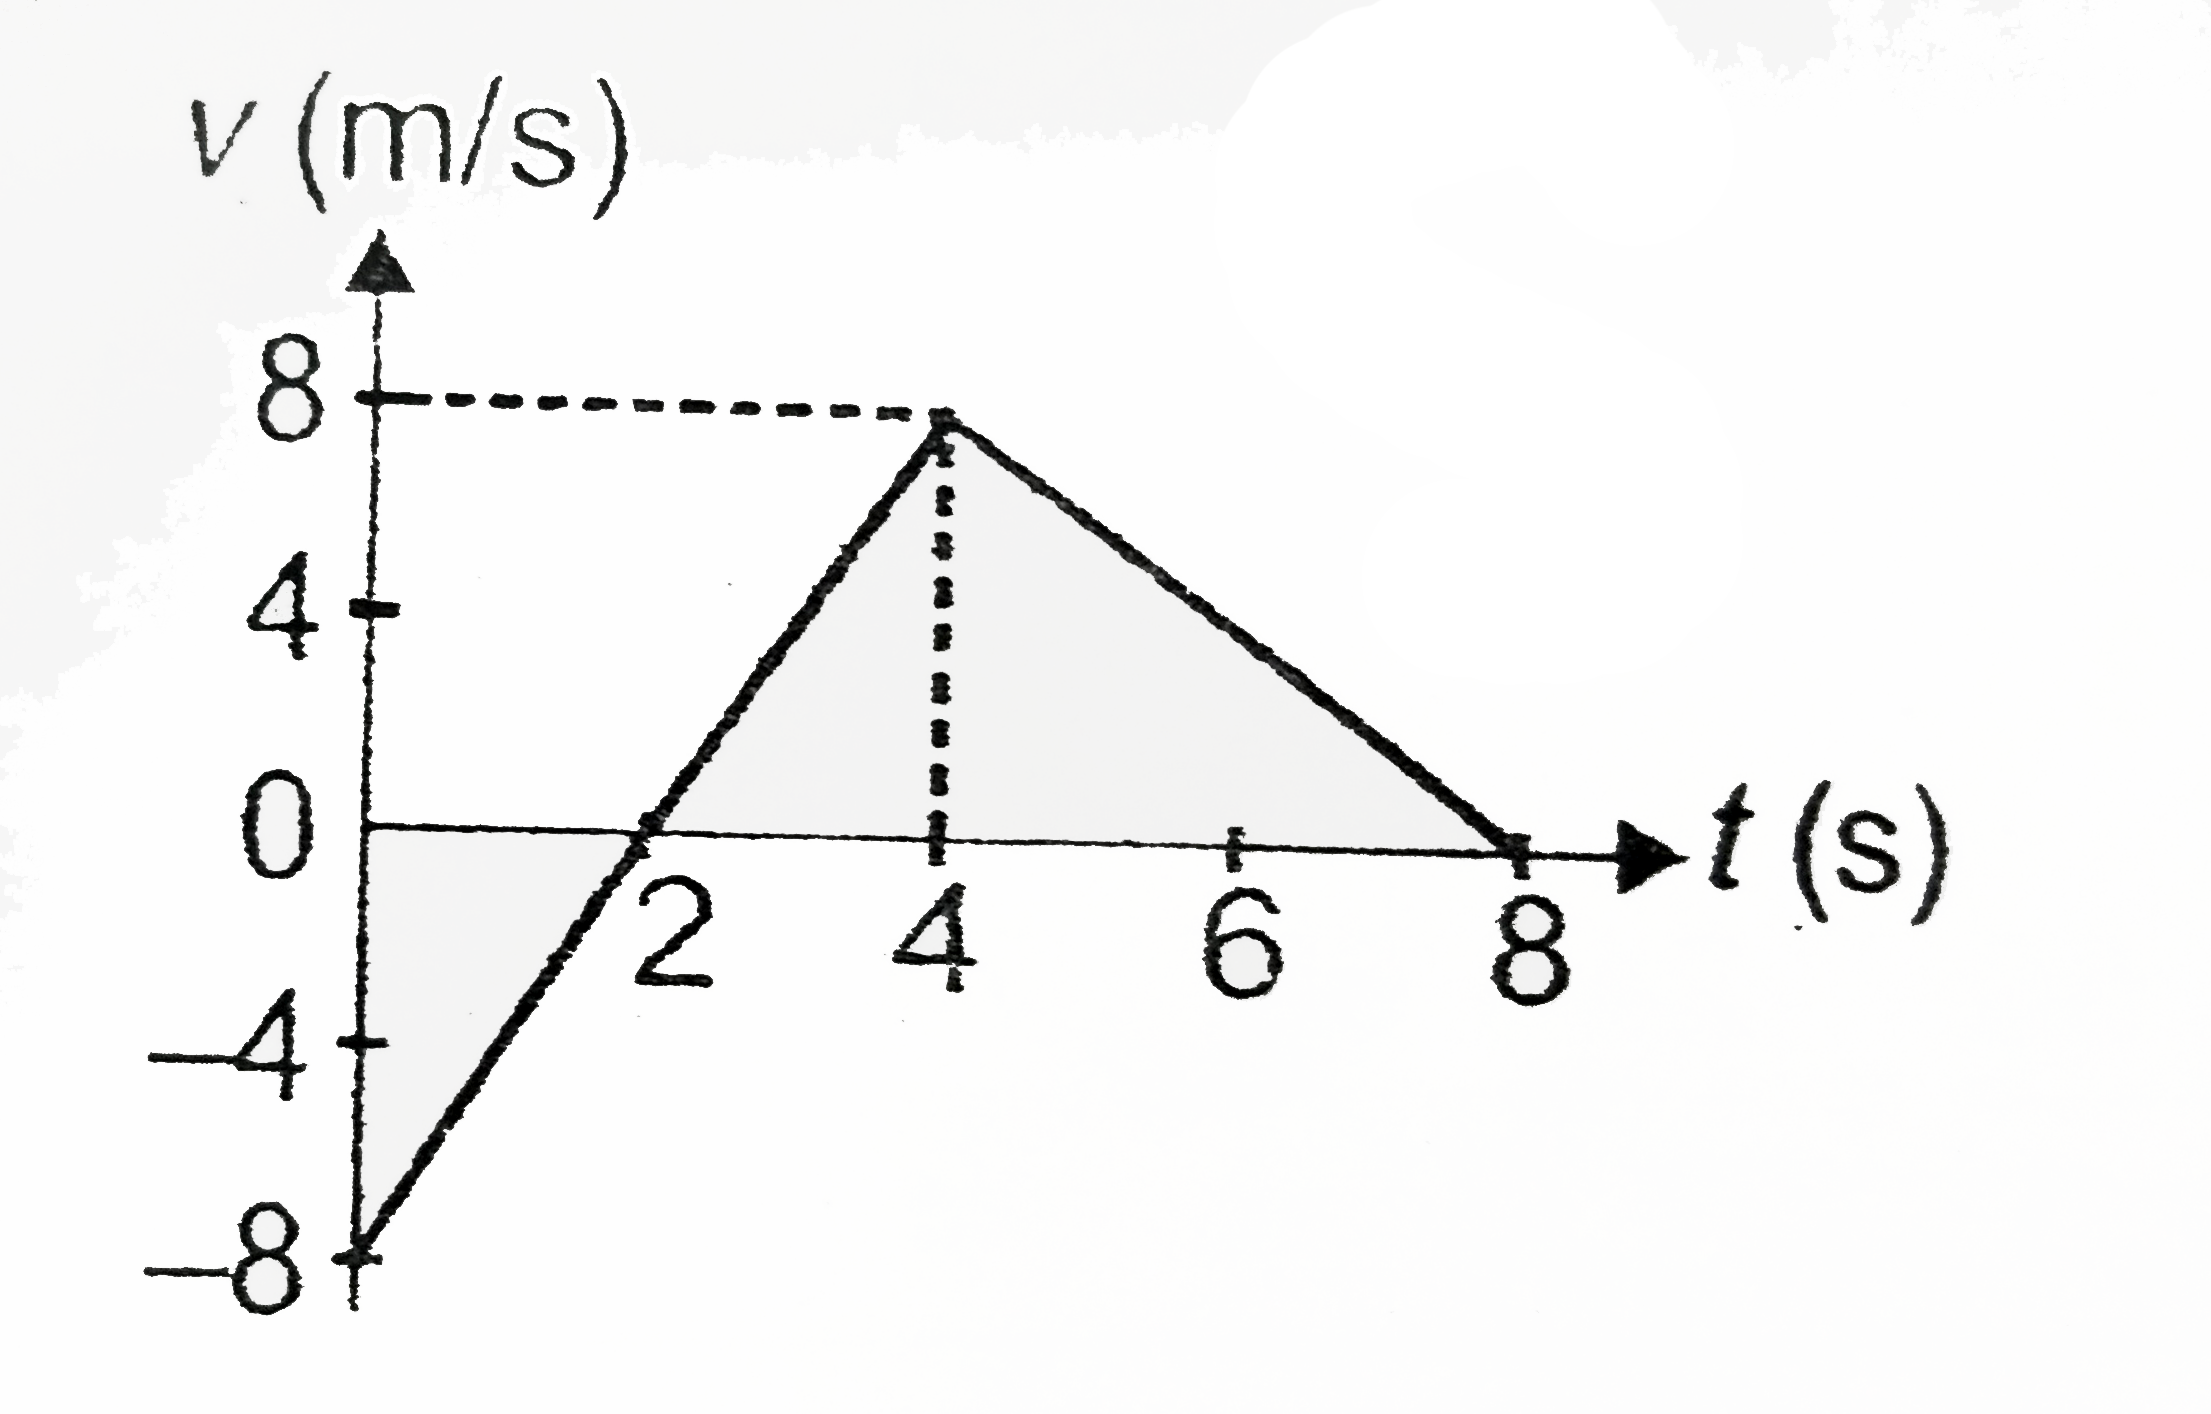
(a) Average velocity in the interval 0 to 8 s.
(b) Average speed in the interval 0 to 8 s.
(c) Average acceleration in the interval 0 to 4 s.
(d) Instantaneous acceleration at t = 2.5 s.View SolutionThe v-t graph for a particle moving along x-axis is shown in the figure, find

(a) Average velocity in the interval 0 to 8 s.
(b) Average speed in the interval 0 to 8 s.
(c) Average acceleration in the interval 0 to 4 s.
(d) Instantaneous acceleration at t = 2.5 s.View SolutionVeolocity-time graph of a particle undergoing rectilinear motioin is plotted upto t=t4 as shown in the figure. Average acceleration of the particle is zero in the time internal between
 View Solution
Veolocity-time graph of a particle undergoing rectilinear motioin is plotted upto t=t4 as shown in the figure. Average acceleration of the particle is zero in the time internal between
 View Solution

