Veolocity-time graph of a particle undergoing rectilinear motioin is plotted upto t=t4 as shown in the figure. Average acceleration of the particle is zero in the time internal between
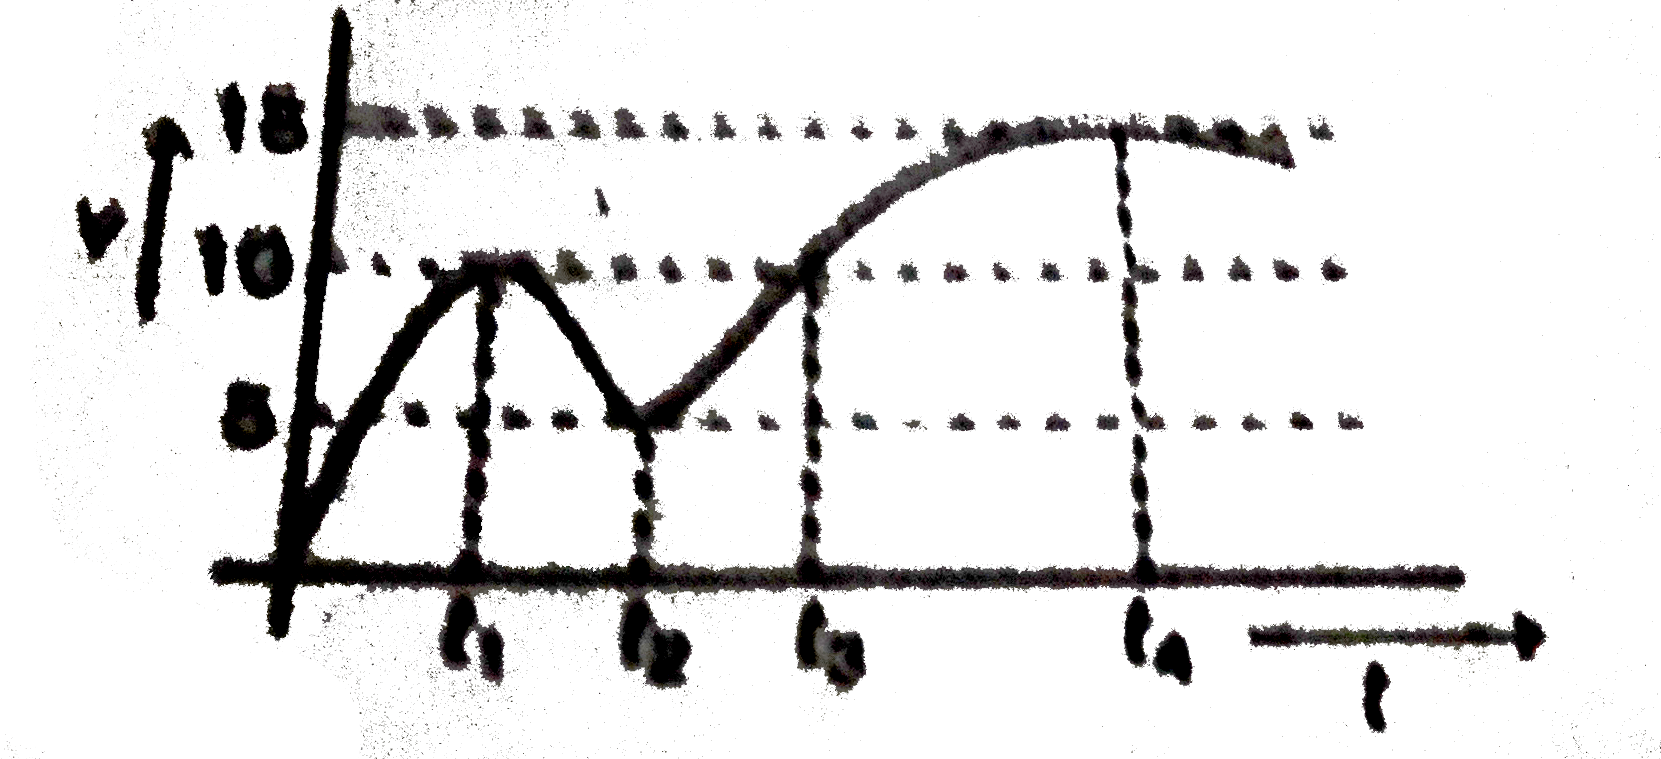
0 and t1
t1 and t2
t1 and t3
t3 and t4
The correct Answer is:A
Step by step video & image solution for Veolocity-time graph of a particle undergoing rectilinear motioin is plotted upto t=t_(4) as shown in the figure. Average acceleration of the particle is zero in the time internal between by Physics experts to help you in doubts & scoring excellent marks in Class 11 exams.
Updated on:21/07/2023Topper's Solved these Questions
- KINEMATICS 1BOOK - DC PANDEY ENGLISHCHAPTER - KINEMATICS 1EXERCISE - MCQ_TYPE
27 Videos
- KINEMATICS 1BOOK - DC PANDEY ENGLISHCHAPTER - KINEMATICS 1EXERCISE - COMPREHENSION_TYPE
19 Videos
- KINEMATICSBOOK - DC PANDEY ENGLISHCHAPTER - KINEMATICSEXERCISE - INTEGER_TYPE
10 Videos
- LAWS OF MOTIONBOOK - DC PANDEY ENGLISHCHAPTER - LAWS OF MOTIONEXERCISE - Medical entrances gallery
39 Videos
Similar Questions
velocity-time graph of a particle moving in a straight line is as shown in figure. At time t=0, velocity of the particle is zero. Find
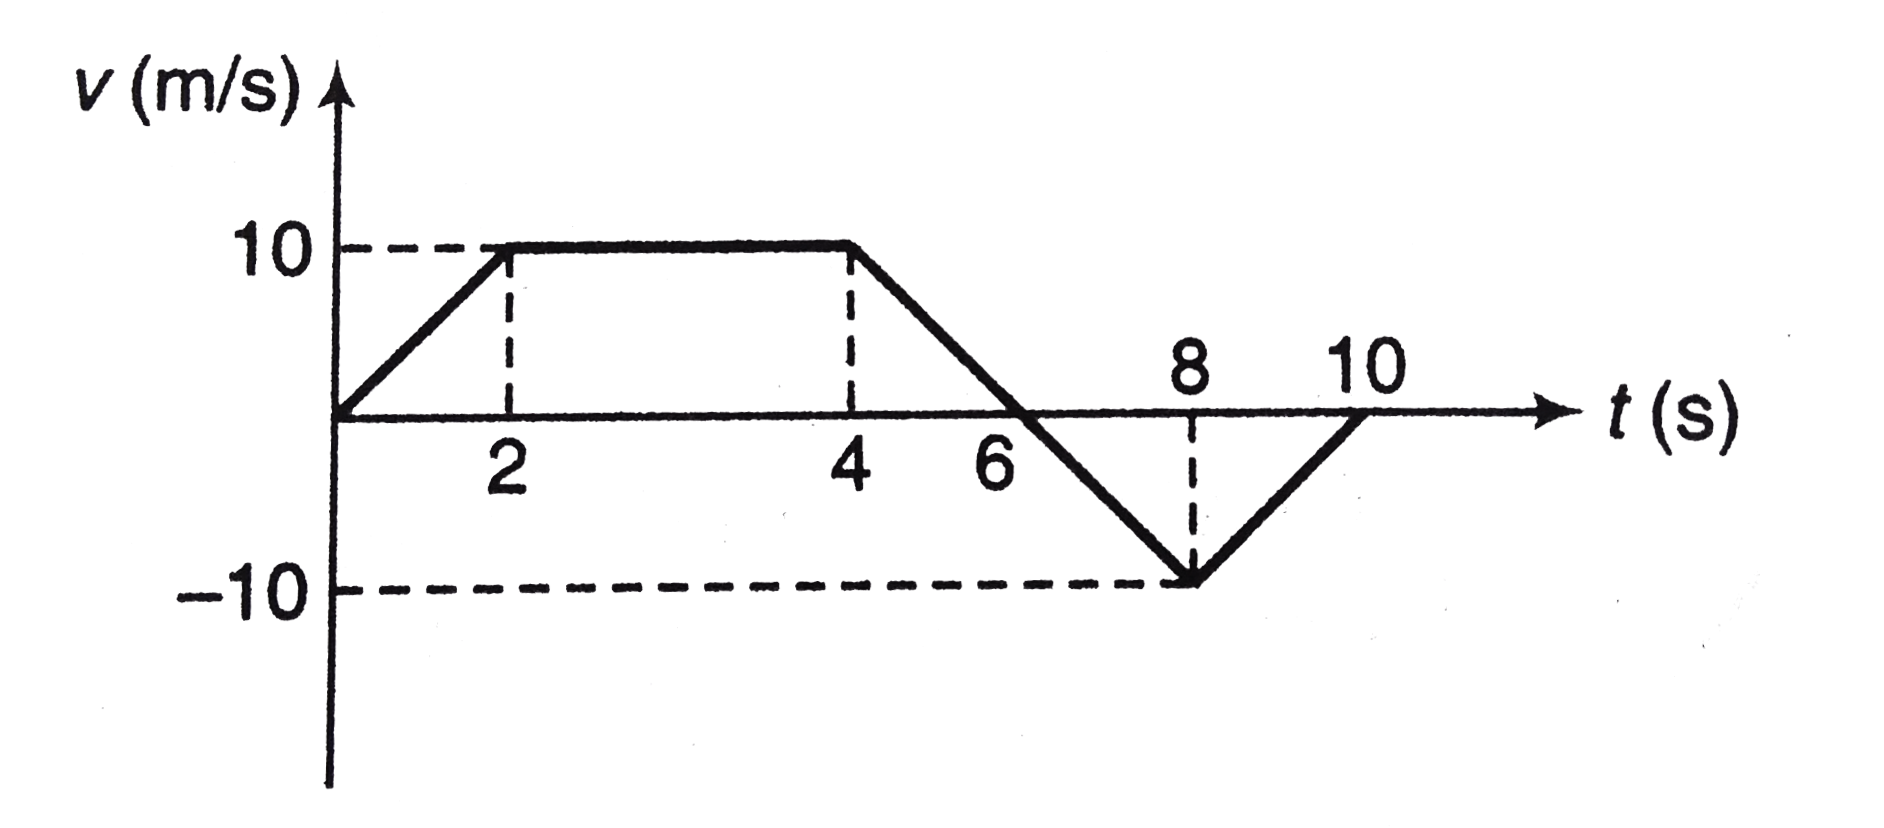
(a) average acceleration in a time interval from t=6s to t=12s,
(b) velocity of the particle at t=14s.
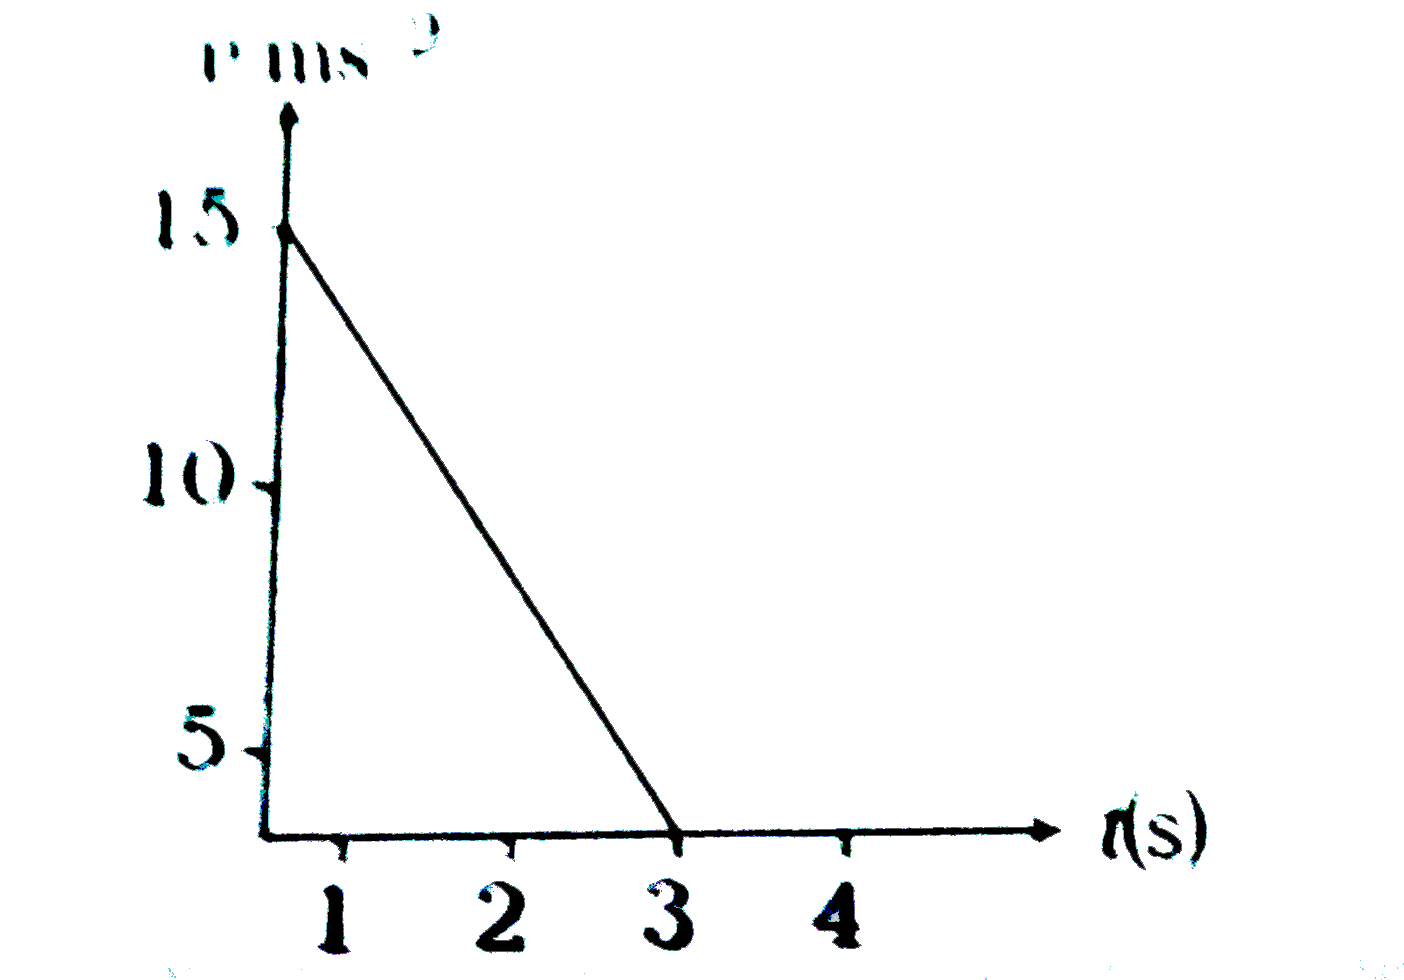
View SolutionThe velocity - time graph is shown in the figure, for a particle. The acceleration of particle is
View Solution
Knowledge Check
The velocity-time graph of a particle in one-dimensional motion is shown in the figure. Which of the following formulae is correct for describing the motion of the particle over the time interval t1 to t2?
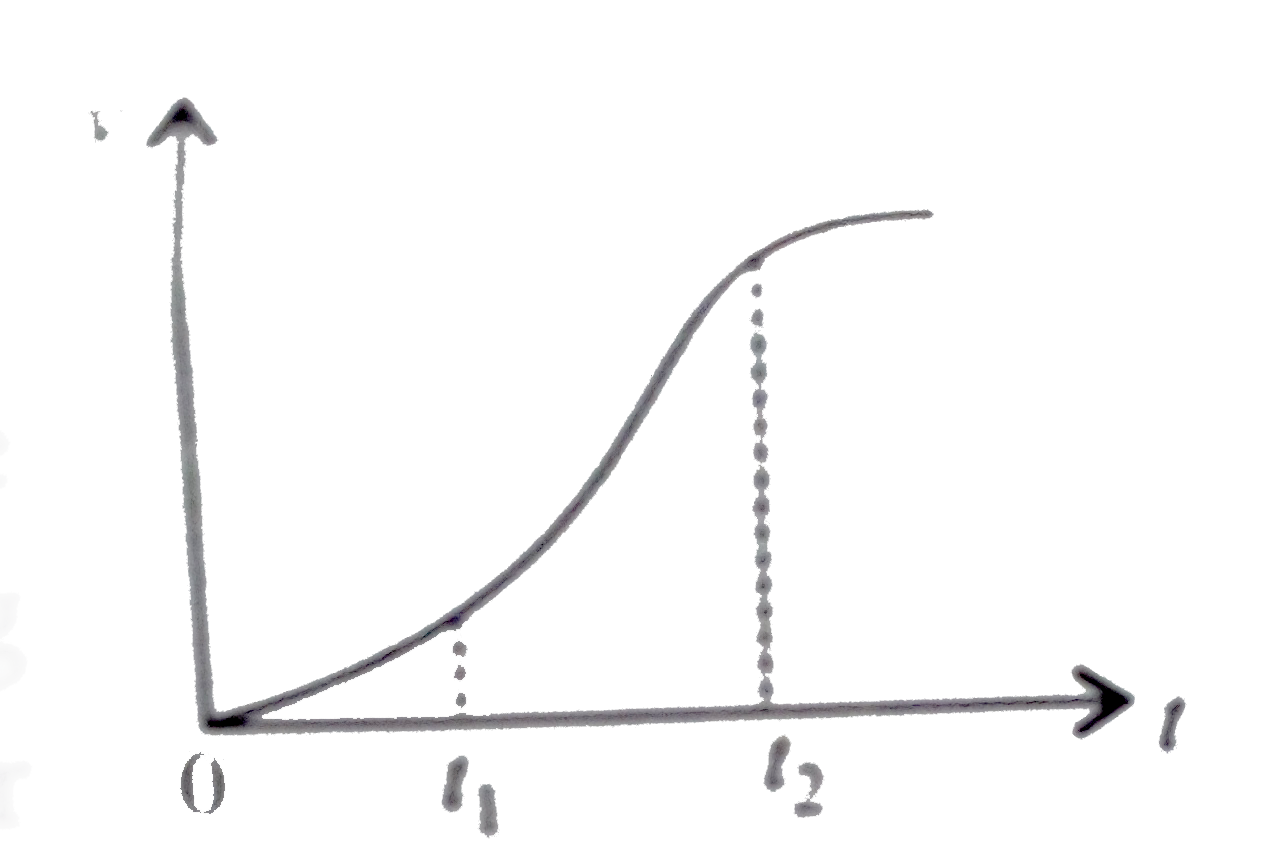 Ax(t2)=x(t1)+v(t1)(t2−t1)+(12)a(t2−t1)2Bv(t2)=v(t1)+a(t2−t1)Cvaverage=x(t2)+x(t1)t2−t1Daaverage=v(t2)−v(t1)t2−t1
The velocity − time graph of a particle is as shown in figure

View SolutionThe x−t graph of a particle undergoing simple harmonic motion is shown in figure. Acceleration of particle at t=4/3s is

View SolutionThe x−t graph of a particle undergoing simple harmonic motion is shown in figure. Acceleration of particle at t=4/3s is

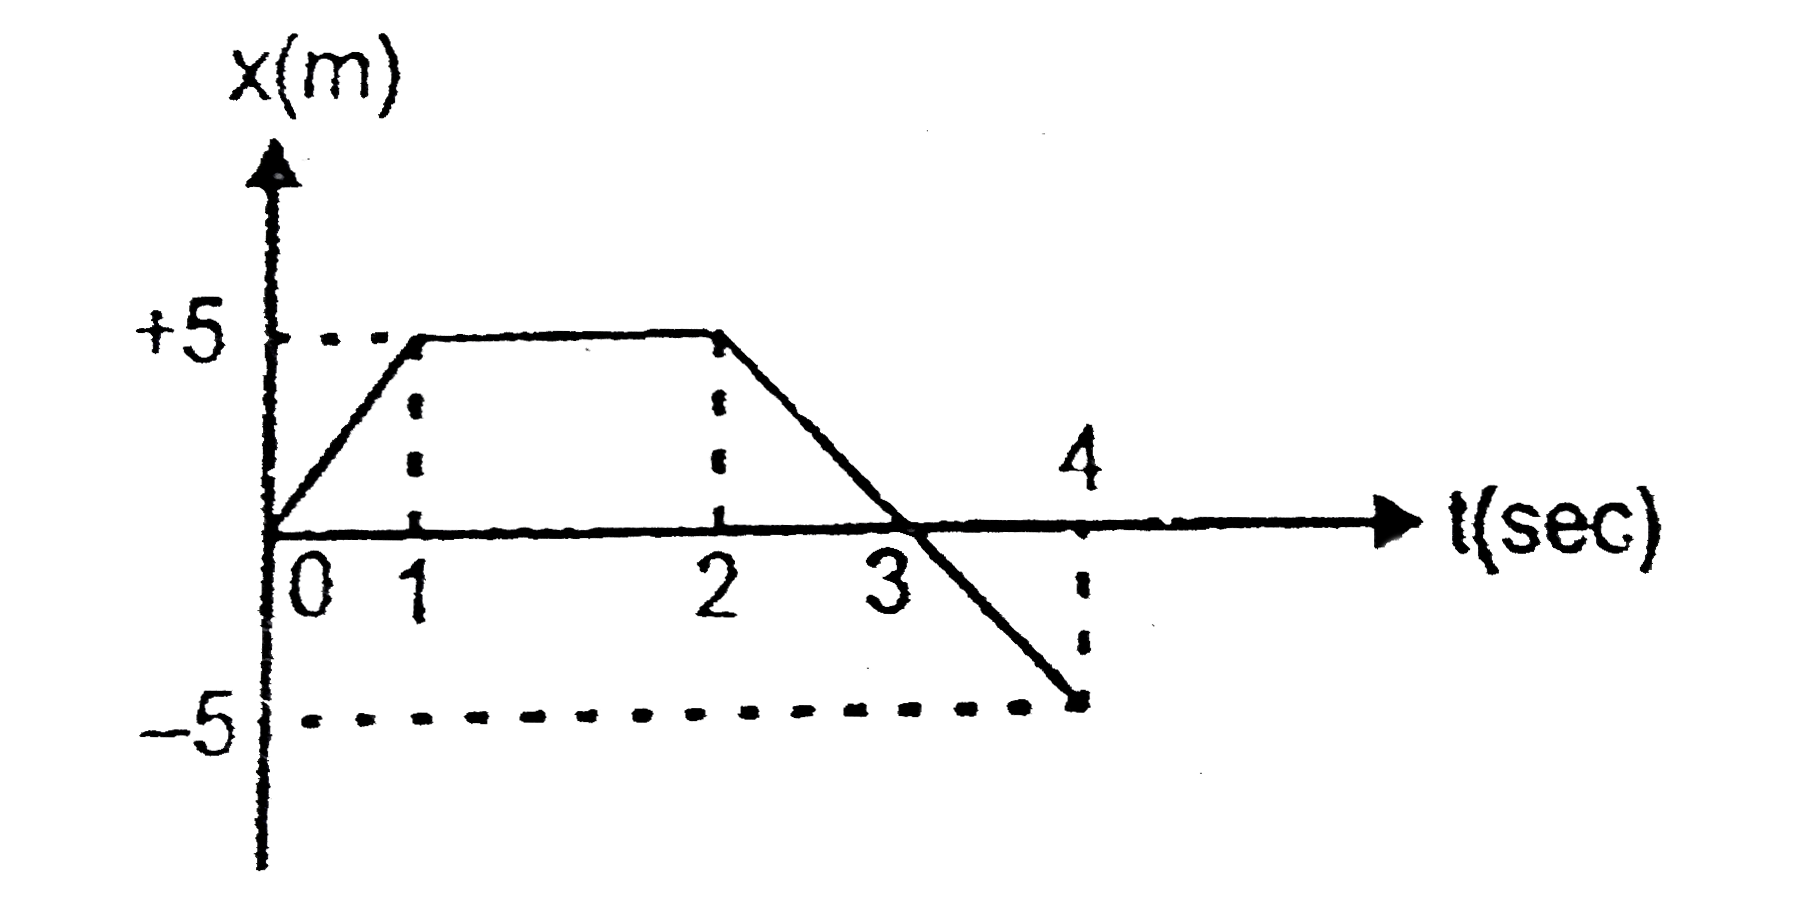
View SolutionPosition-time graph for a particle moving along x− direction is as shown in the figure. Average speed of the particle from t=0 to t=4 is :
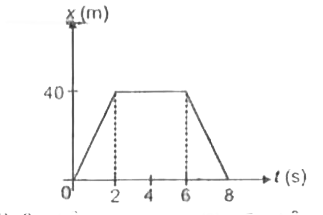
View SolutionThe position (x) of a particle moving along x - axis veries with time (t) as shown in figure. The average acceleration of particle in time interval t = 0 to t = 8 s is
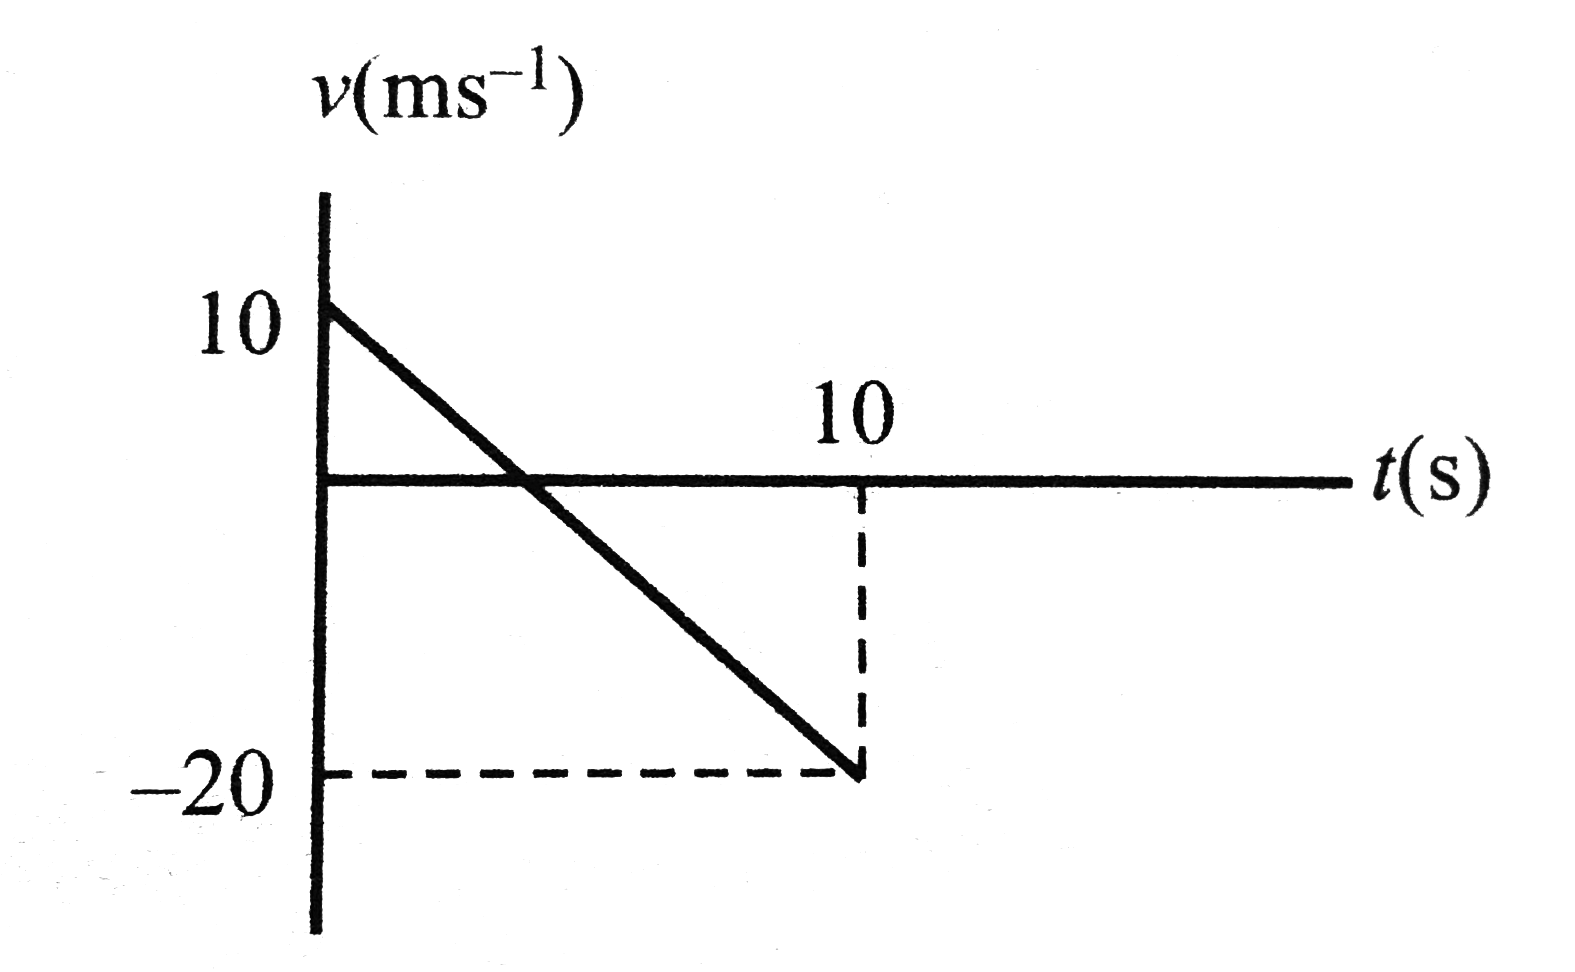
View SolutionThe velocity-time graph of a particle moving in a straight line is shown in figure. The mass of the particle is 2kg. Work done by all the forces acting on the particle in time interval between t=0 to t=10s is
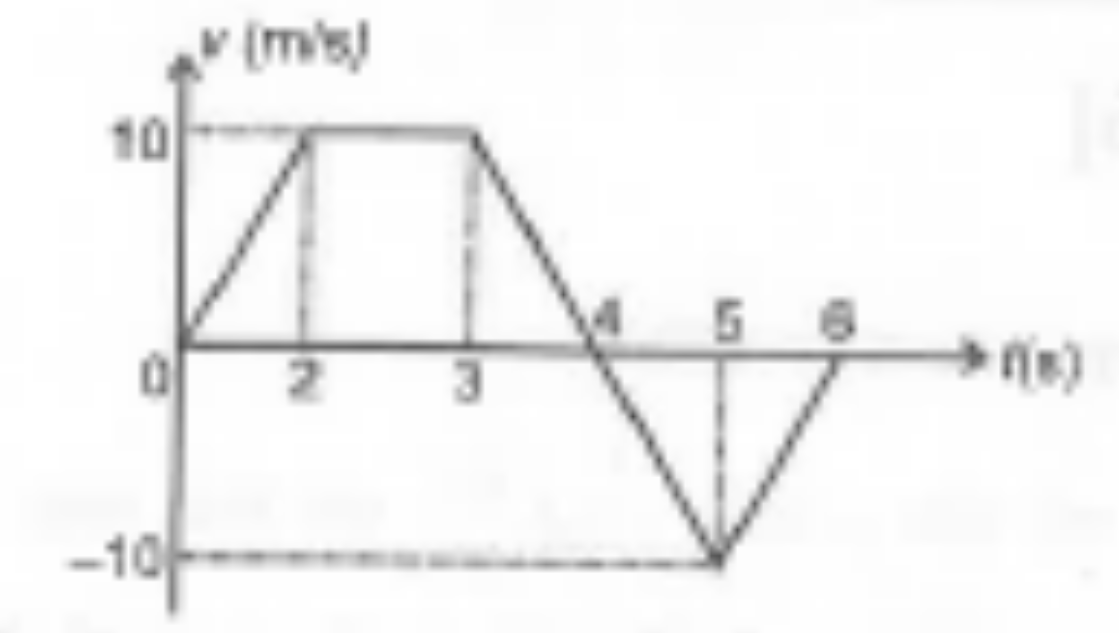
View SolutionThe velocity (v)-time (t) graph of a partide moving along a straight line is as shown in the figure. The displacement of the particle from t = 0 to t = 4 is
View Solution
