The accompanying diagram is of growth rate of tadpole and the digits appearing along the curves represent number of individuals sharing the habitat. From the diagram one can inter that.

growth rate is independent of population density
growth rate declines rapidly with increasing population density
growth rate increases with increasing population density
tadpoles are of large size when their number is larger
The correct Answer is:B
Step by step video & image solution for The accompanying diagram is of growth rate of tadpole and the digits appearing along the curves represent number of individuals sharing the habitat. From the diagram one can inter that. by Biology experts to help you in doubts & scoring excellent marks in Class 12 exams.
Updated on:21/07/2023Topper's Solved these Questions
- NEURAL CONTROL AND COORDINATIONBOOK - TRUEMEN BIOLOGY ENGLISHCHAPTER - NEURAL CONTROL AND COORDINATIONEXERCISE - MCQ
246 Videos
- PLANT GROWTH AND DEVELOPMENT AND PLANT MOVEMENTS BOOK - TRUEMEN BIOLOGY ENGLISHCHAPTER - PLANT GROWTH AND DEVELOPMENT AND PLANT MOVEMENTS EXERCISE - MULTIPLE CHOICE QUESTIONS
158 Videos
Similar Questions
Define a taxon. What is meant by taxonomic hierarchy ? Give a flow diagram from the lowest to highest category for a plant and an animal. What happens to the number of individuals and number of shared characters as we go up the taxonomical hierarchy?
View Solution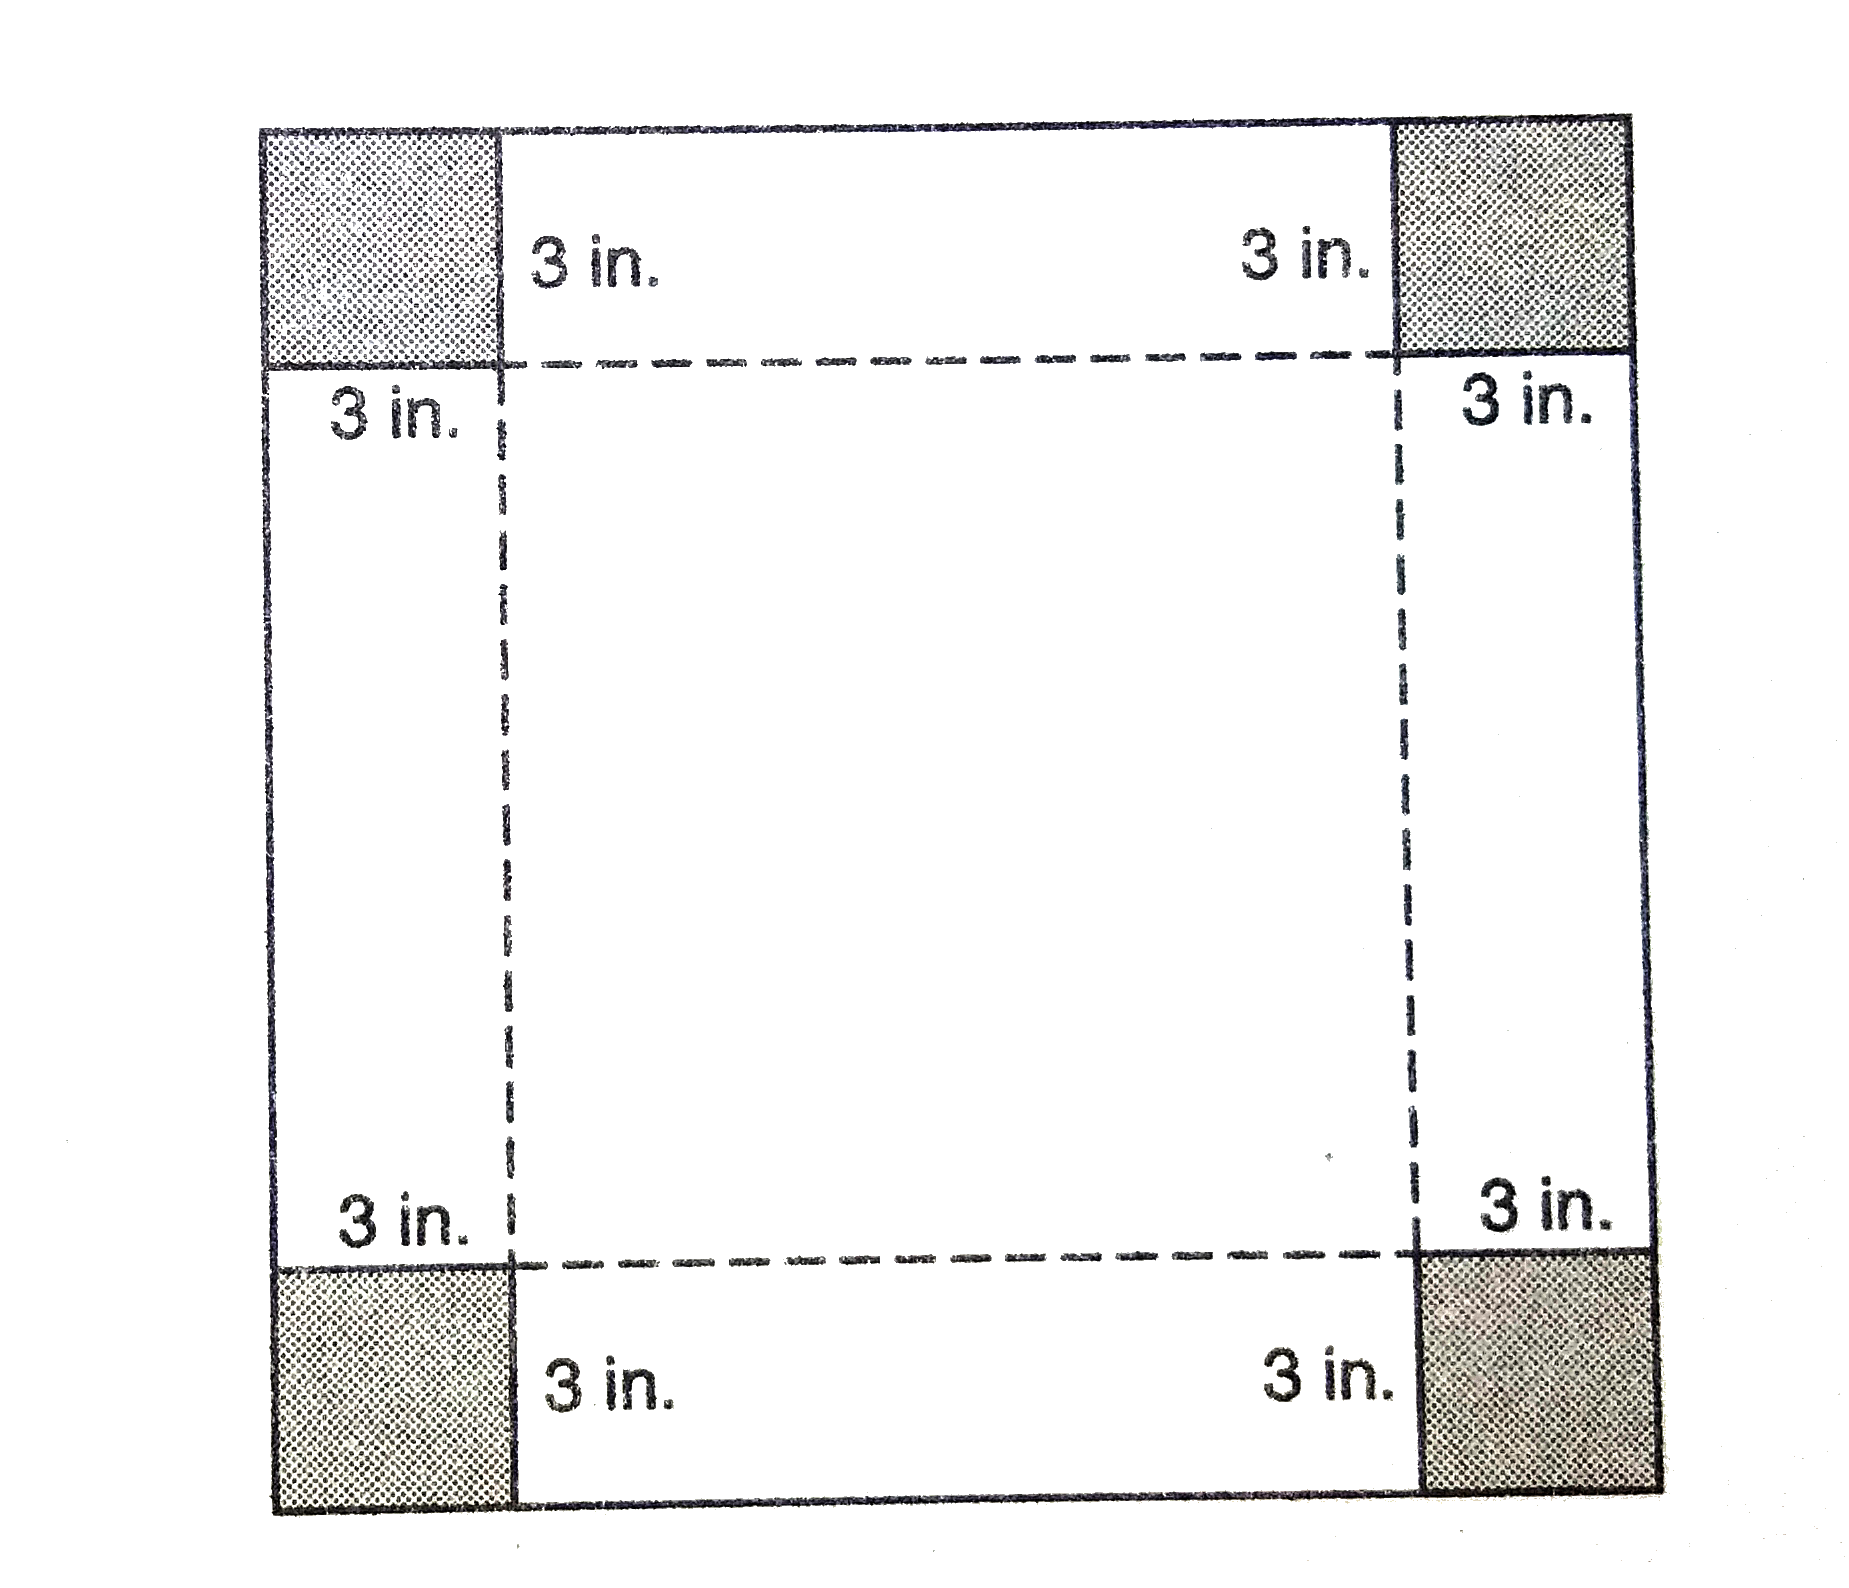
A box is constructed by cutting 3-inche square from the corner of a square sheet of cardboard, as shown in the accompanying diagram, and then folding the sides up. If the volume of the box is 75 inches, find the number of square inches in the area of the original sheet of cardboard?
View Solution
Knowledge Check
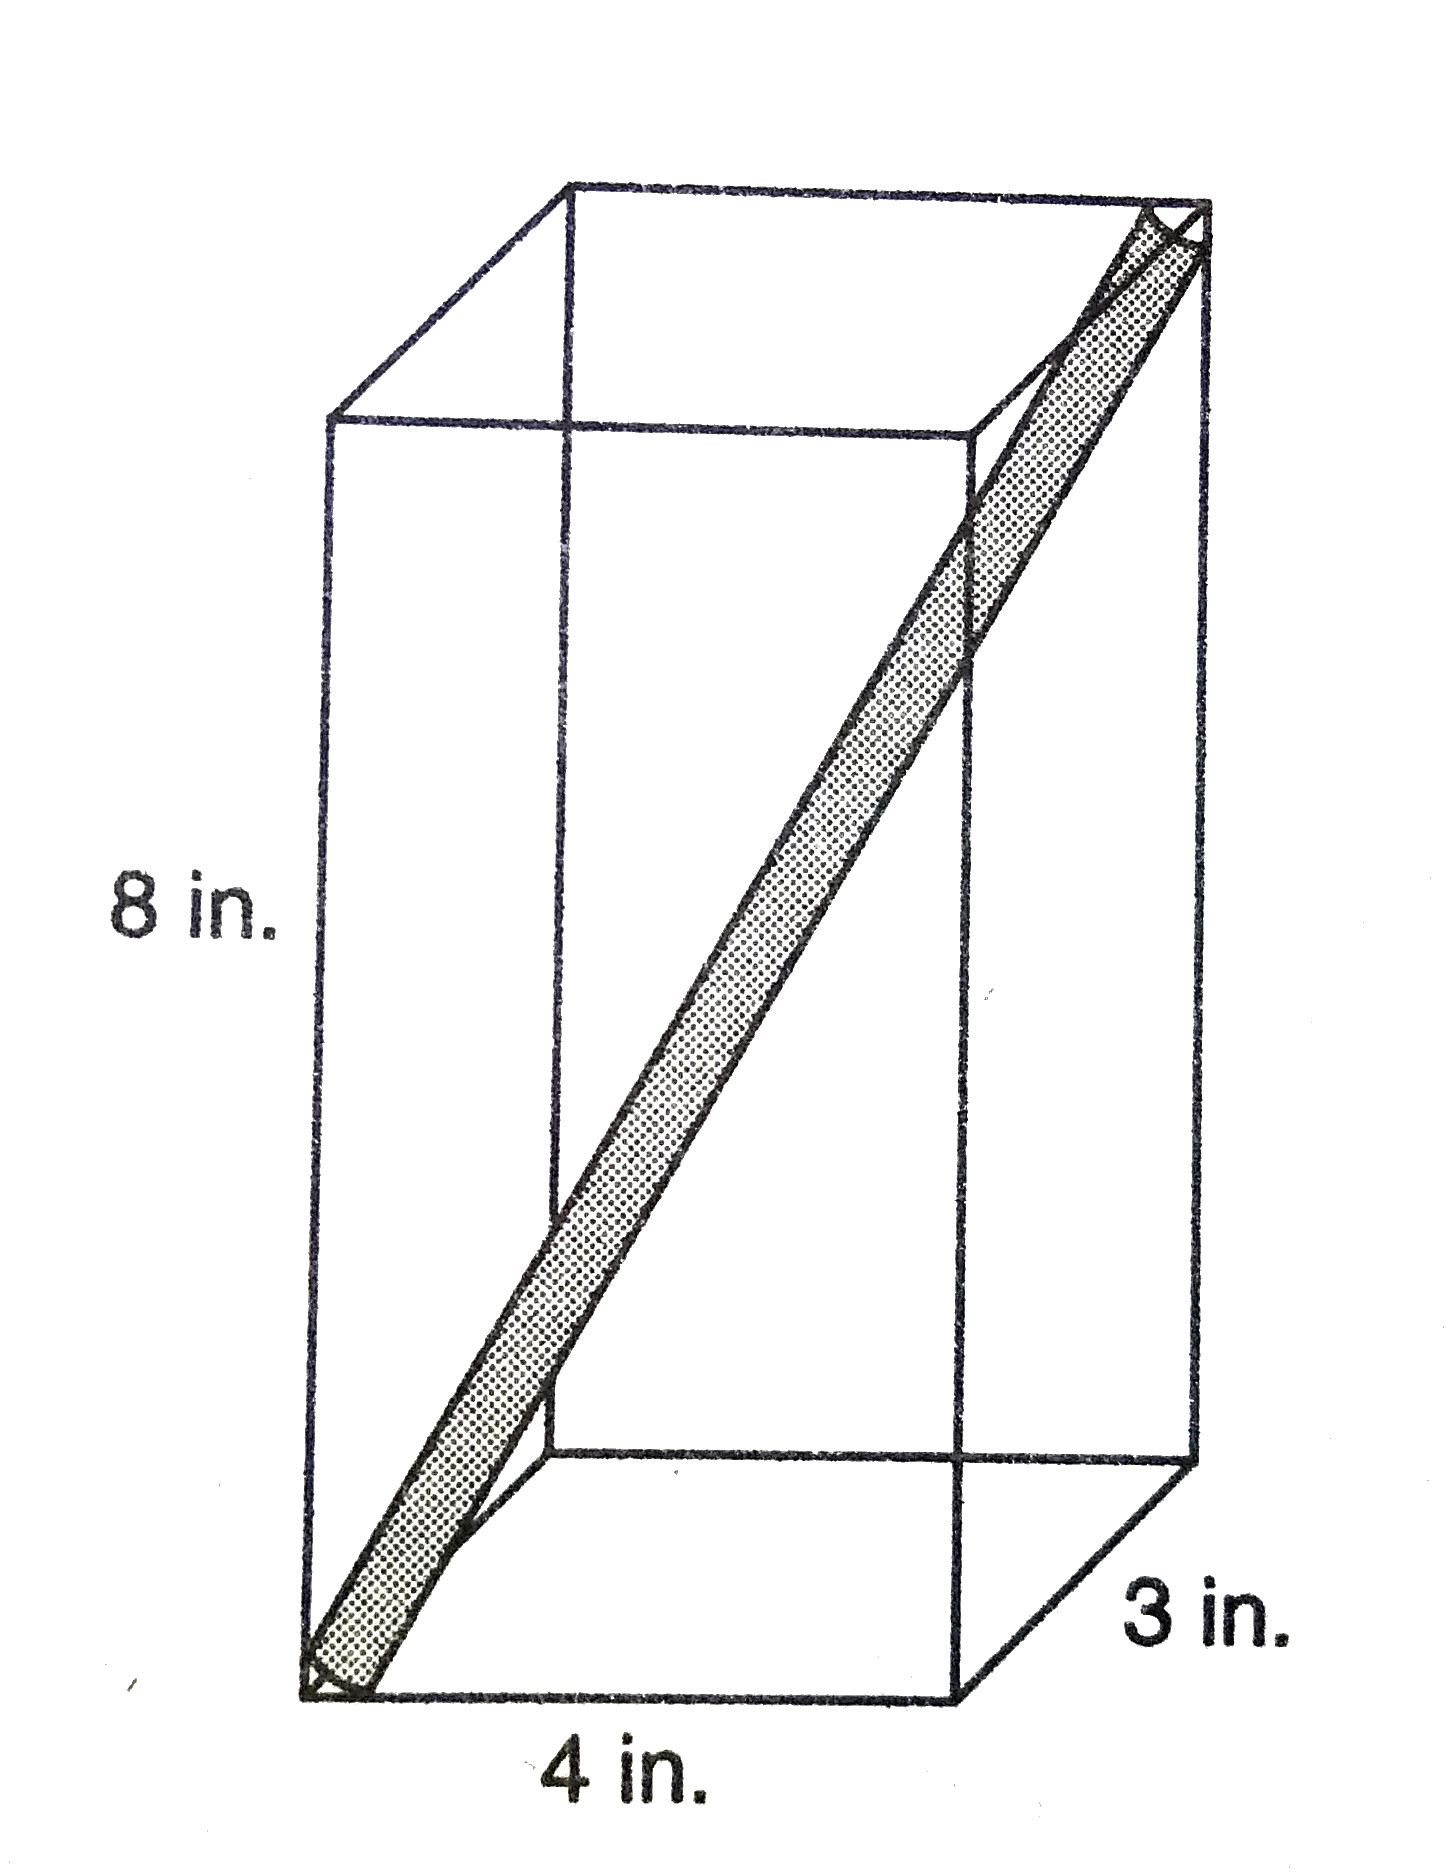
A cylindrical tube with ngligible thichness is placed into a rectangular box that is 3 inches by 4 inches by 8 inches, as shown in the accompanying diagram. If the tubes fits exactly into the box diagonally from the bottom left corner to the top right back corner, what is the best approximately of the number of inches in the length of the cube?A3.9B5.5C7.8D9.4Read the following statements and select the correct ones.
(i) Increase in mass and increase in number of individuals are twin characteristics of growth.
(ii) Metabolic reactions can be demonstrated outside the body in isolated cell-free systems.
(iii) 'Response to stimuli' is a defining property of living organisms.A(i) and (ii)B(ii) and (iii)C(i) and (iii)D(i), (ii) and (iii)
The diagram given belwo represents a system in the human body. Study the diagram and answer the following question:
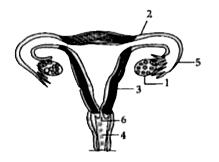
Mention the number and the name of the part involved in fertilization and implantation from the above diagram.
View SolutionPhase space diagrams are useful tools in analysing all kond of dynamical problems. Theya re especially useful in studying the changes in motion as initial position and momentum are changed. Here we consider some simple dynamical system in one-dimelnsion. for such systeam, phase space is a plane in which position is plotted along horizontal axis and momentum is plotted along vertical axis. The phase space diagram is x(t) vs. p(t) curve in this plane. The arrow on the curve indicates the time flow. for example, the phase space diagram for a particle moving with constant velocity is a straight line as shown in the figure. We use the sign convention in which position or momentum. upwards (or to right) is positive and downwards (or to left) is negative.
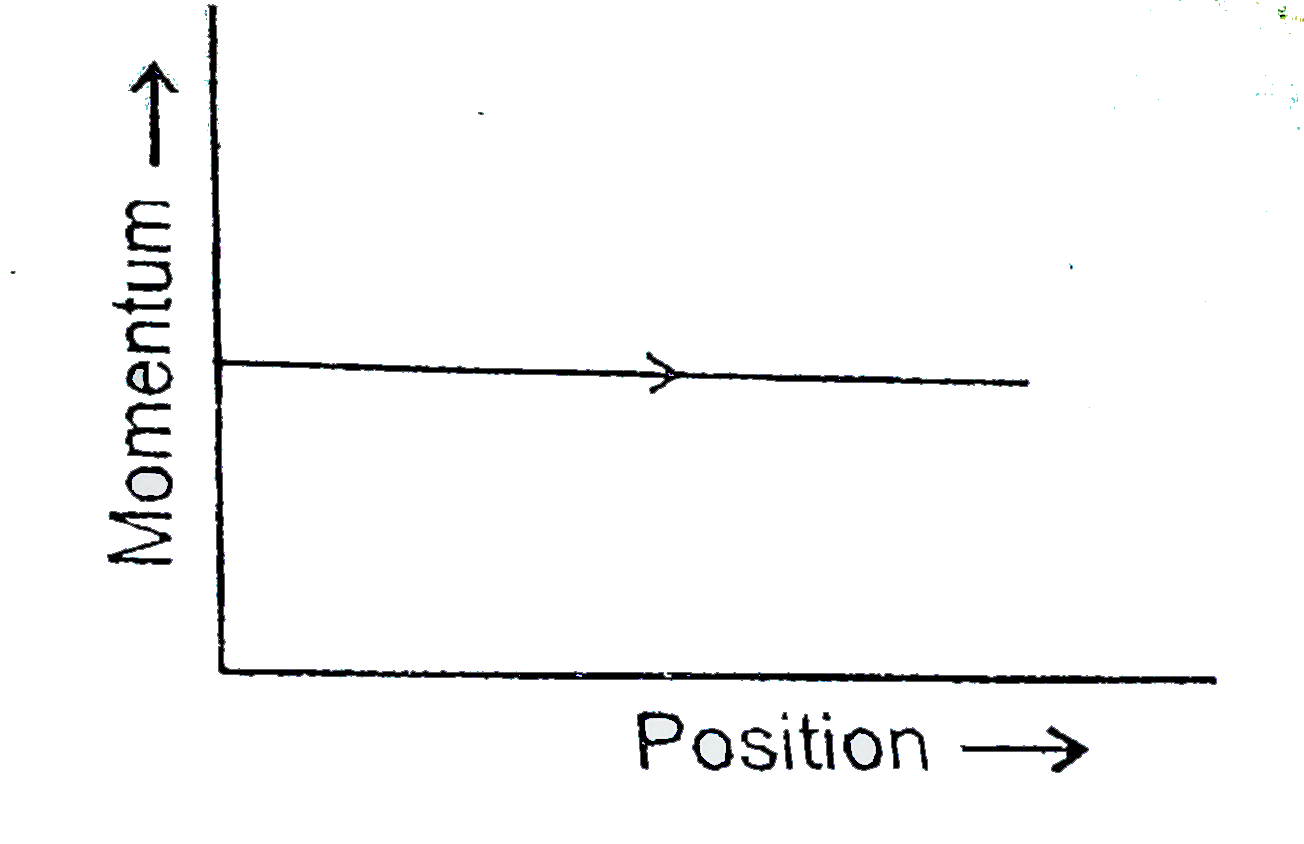
The phase space diagram for simple harmonic motion is a circle cen-tered at the origin.In the figure, the two circles represent the same oscillator but for different initial conditions, and E1 for E2 are the total mechanical energies respectively. Then
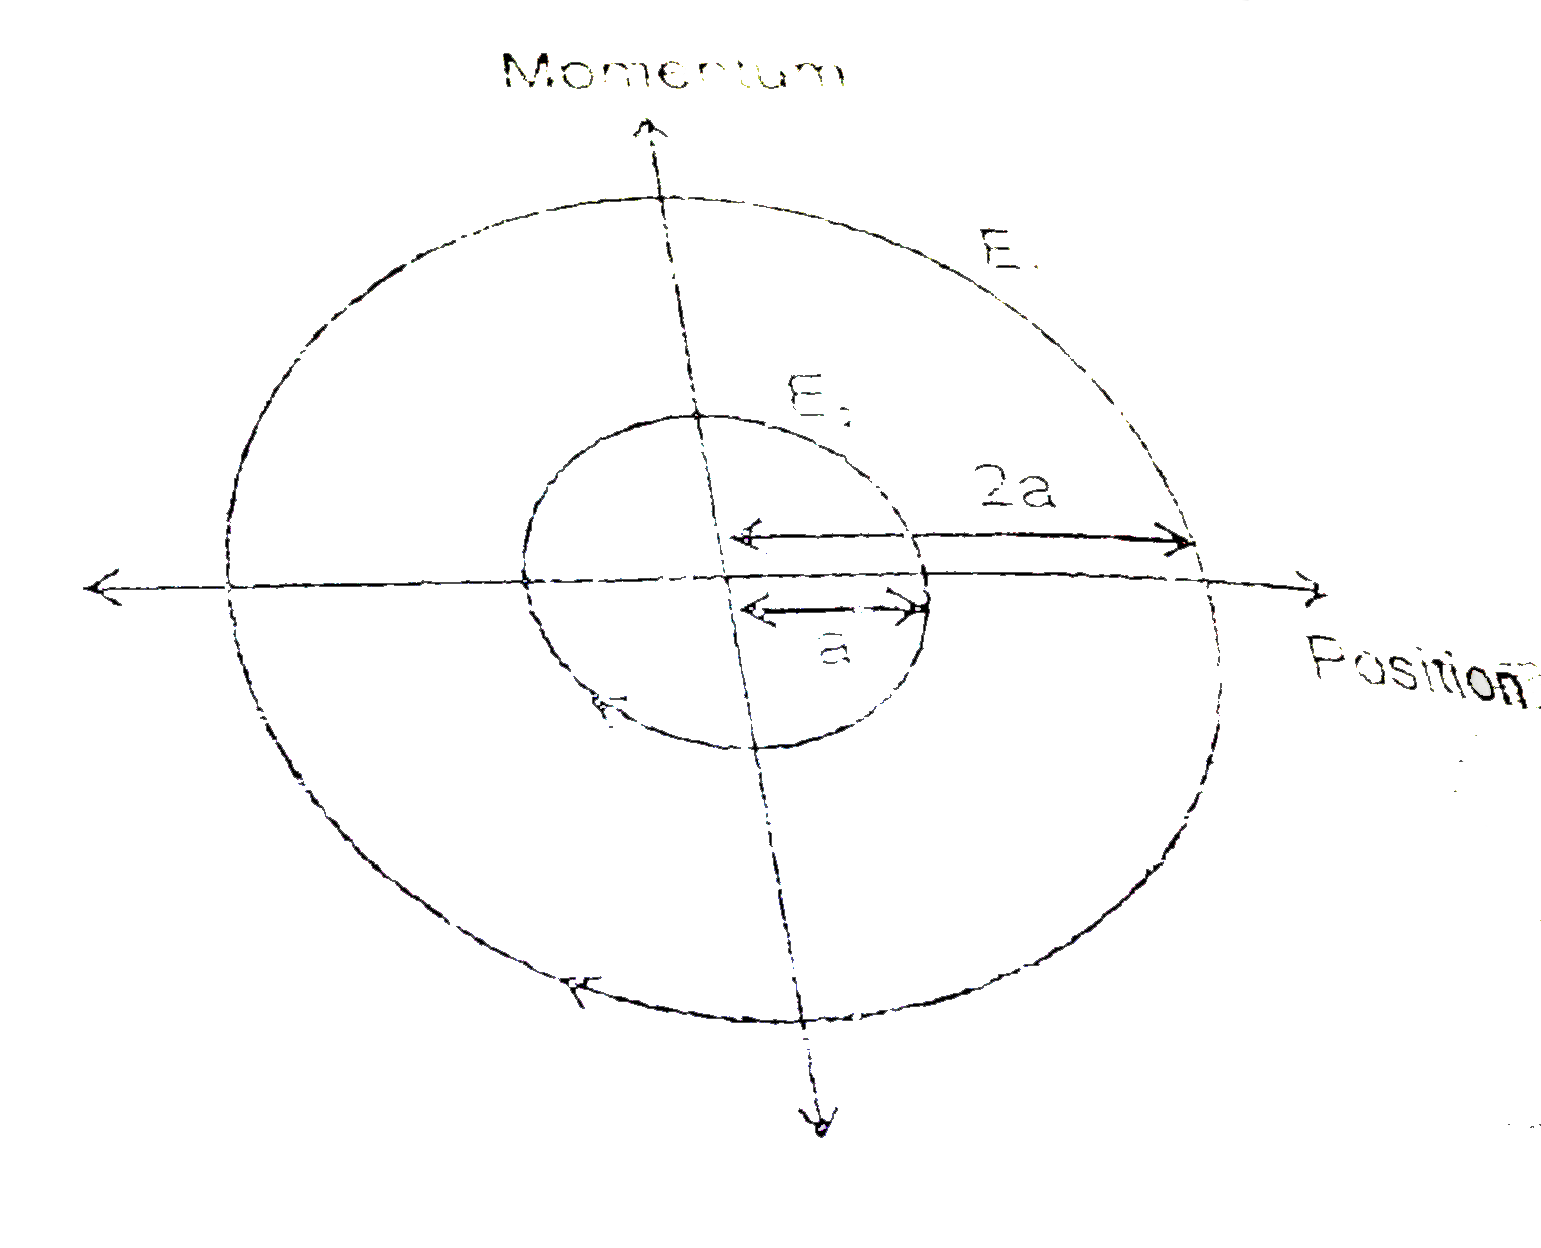
View SolutionPhase space diagrams are useful tools in analysing all kond of dynamical problems. Theya re especially useful in studying the changes in motion as initial position and momentum are changed. Here we consider some simple dynamical system in one-dimelnsion. for such systeam, phase space is a plane in which position is plotted along horizontal axis and momentum is plotted along vertical axis. The phase space diagram is x(t) vs. p(t) curve in this plane. The arrow on the curve indicates the time flow. for example, the phase space diagram for a particle moving with constant velocity is a straight line as shown in the figure. We use the sign convention in which position or momentum. upwards (or to right) is positive and downwards (or to left) is negative.
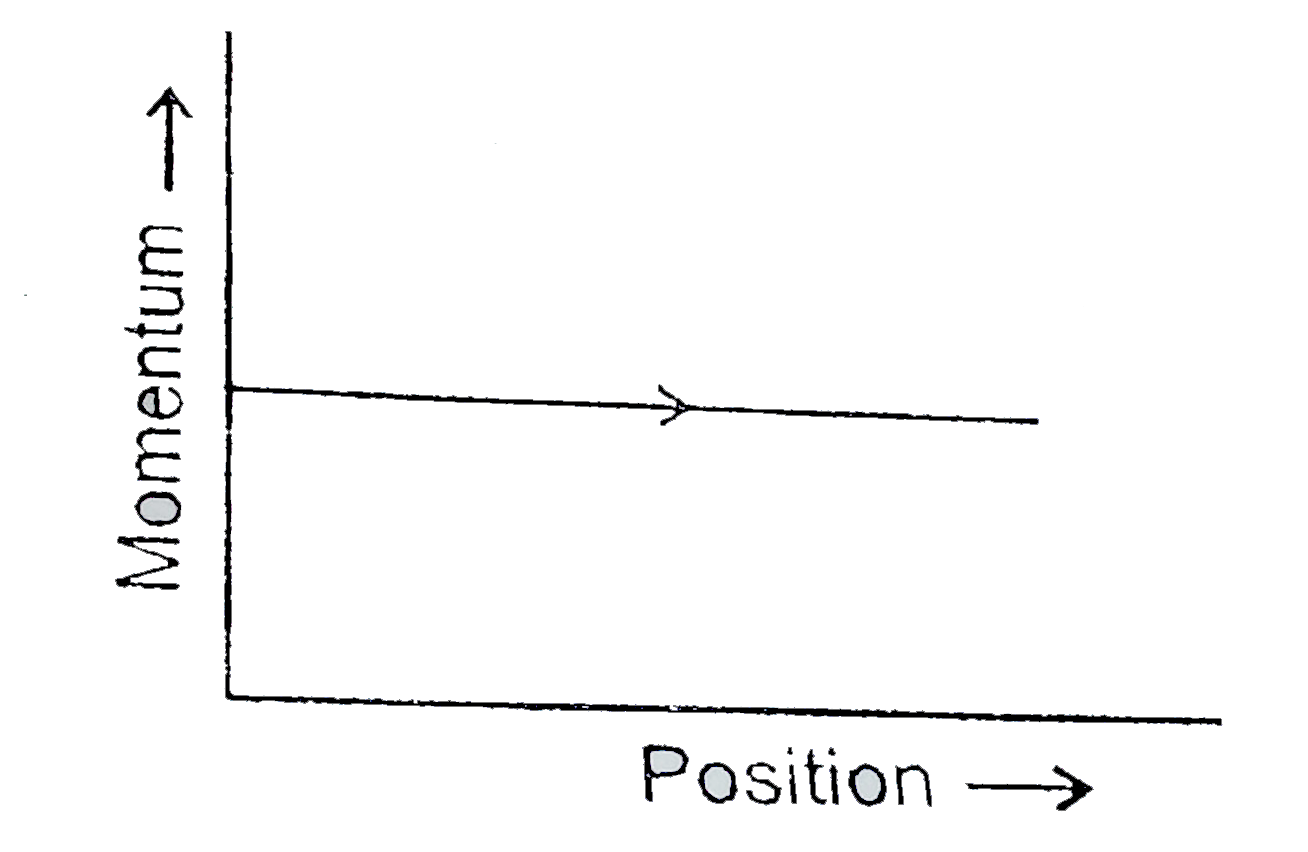
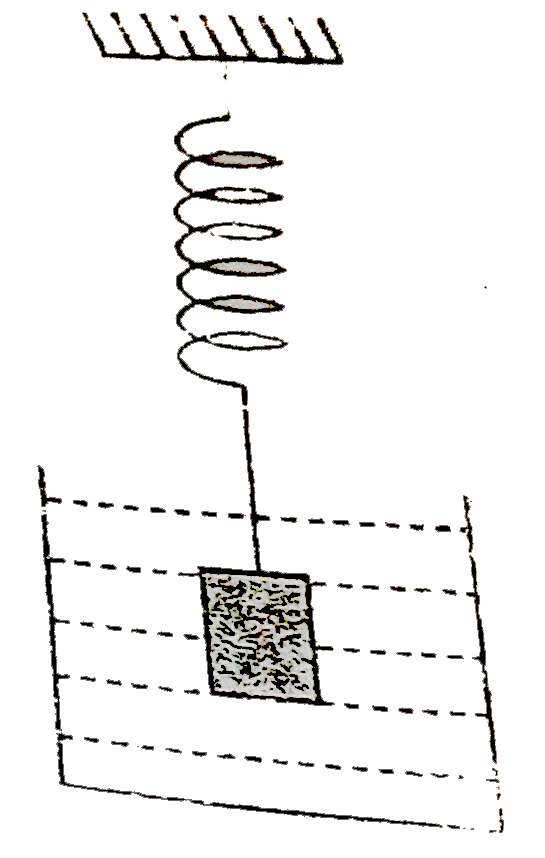
Consider the spring-mass system, with mass submerged in water, as shown in the figur, the phase diagram for one cycle of this system is :
View SolutionPhase space deagrams are useful tools
 .
.
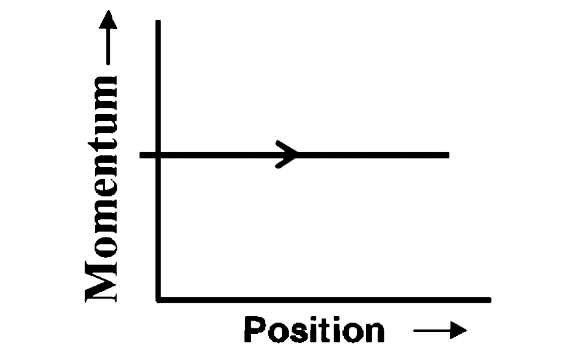
in analyzing all kinds of dynamical problems. They are especially usrful in studying the changes in motion as initial position and momenum are changed. Here we conseder some simple dynamical systems in one dimension. For such systems, phase space is a plane in which position is plotted along horizontal axis and momentum is plotted along vertical axis. The phase space diagram is x(t) vs. p(t) curve in this plane. The arrow on the curve indicates the time flow. For example, the phase space diagram for a particle moving with constant velocity is a straight line as shown in the figure. We use the sign convention in which positon or momentum upwards (or to right) is poitive and downwards (or to left) is negative.
The plase space deagram for simple harmonic motion is a circle centered at the origin. In the figure, the two circles represent the same oscillator but for different initial condetions, and E_(1) and E_(2) the total mechanical energies respectivey.
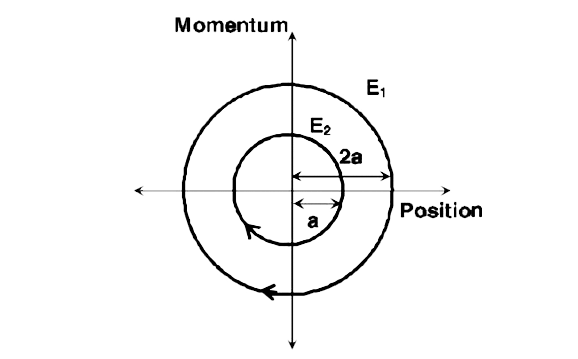 .
.
View SolutionIn one-dimensional kinematics, a particle can move strictly along a straight line. The description of motion of the particle can be done in two ways: (i) mathematical equation and (ii) graphs.
The choice of a particular method for solving a problem often depends upon the type and nature of problem, for example the graphical method provides more physical insight One dimensional motion is categorised into
1. motion with constant velocity
2. motion with constant acceleration, and
3. accelerated and de-accelerated motion
If you represent inotion (1) by the graph on position time and velocity-time coordinates, the graphs may look like as given below.
One very interesting case comes up, when a particle is thrown at a certain angle from the horizontal, the particle travels in the medium along a curved path, known as parabola. - The trajectory of the parabola written in the mathematical equation is given by
y=xtanθ−12gx2((v0cosθ))2
Ineglect resistance of medium and its motion where Vs and are the initial velocity of the projectile and the projection angle at the point of projection measured with the + x axis. There are some applications which we have seen in our life, like in many game shows, the theory of the projectile is always used An air gun is aimed at an elevated target, which is released in a free fall by some mechanism as the bullet leaves the nozzle. Irrespective of falling speed of object, the bullet will always hit the target.
QOut of the two methods, graphical method and mathematical equation, which gives you the better precision

View SolutionIn a population of 2,500 whose intrinsic rate of natural increase (r) is 0.2 per capita per year is exhibiting exponential growth. If the number of individuals at a given moment is 2,000 what will the population size after one year?
View Solution
