The relationship between the two organsims when grown individually (Secton P) and grown together (Section Q) is shown in the graph. The relationship is most likely to be
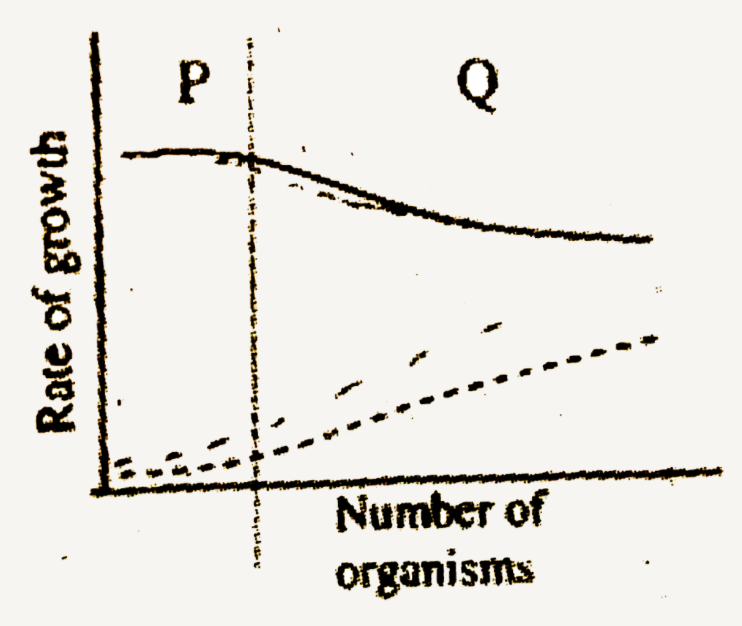
commensalism
parasitism
mutualism
protocooperation
The correct Answer is:B
Step by step video & image solution for The relationship between the two organsims when grown individually (Secton P) and grown together (Section Q) is shown in the graph. The relationship is most likely to be by Biology experts to help you in doubts & scoring excellent marks in Class 12 exams.
Updated on:21/07/2023Topper's Solved these Questions
- NEURAL CONTROL AND COORDINATIONBOOK - TRUEMEN BIOLOGY ENGLISHCHAPTER - NEURAL CONTROL AND COORDINATIONEXERCISE - MCQ
246 Videos
- PLANT GROWTH AND DEVELOPMENT AND PLANT MOVEMENTS BOOK - TRUEMEN BIOLOGY ENGLISHCHAPTER - PLANT GROWTH AND DEVELOPMENT AND PLANT MOVEMENTS EXERCISE - MULTIPLE CHOICE QUESTIONS
158 Videos
Similar Questions
Knowledge Check
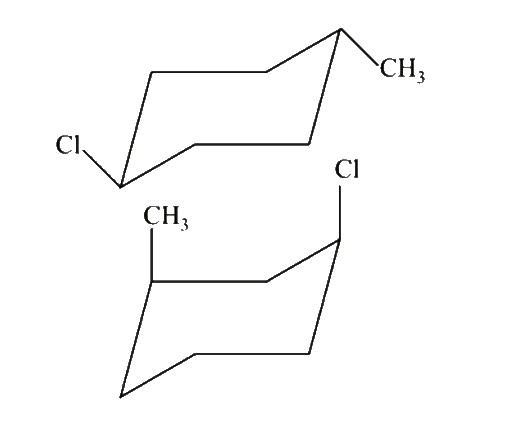
What is the relationship between the two structures shown ?
 AConstitutional isomersBStereoisomersCDifferent drawing of the same conformation of the same compoundDDifferent conformation of the same compound
The relationship between the man and his dog was most like that of __________
Atwo old friendsBmaster and slaveCfather and sonDteammatesThe given diagram represents the relationships between organisms in a remote pond ecosystem. From this information. Which of the following is the most likely to be correct?
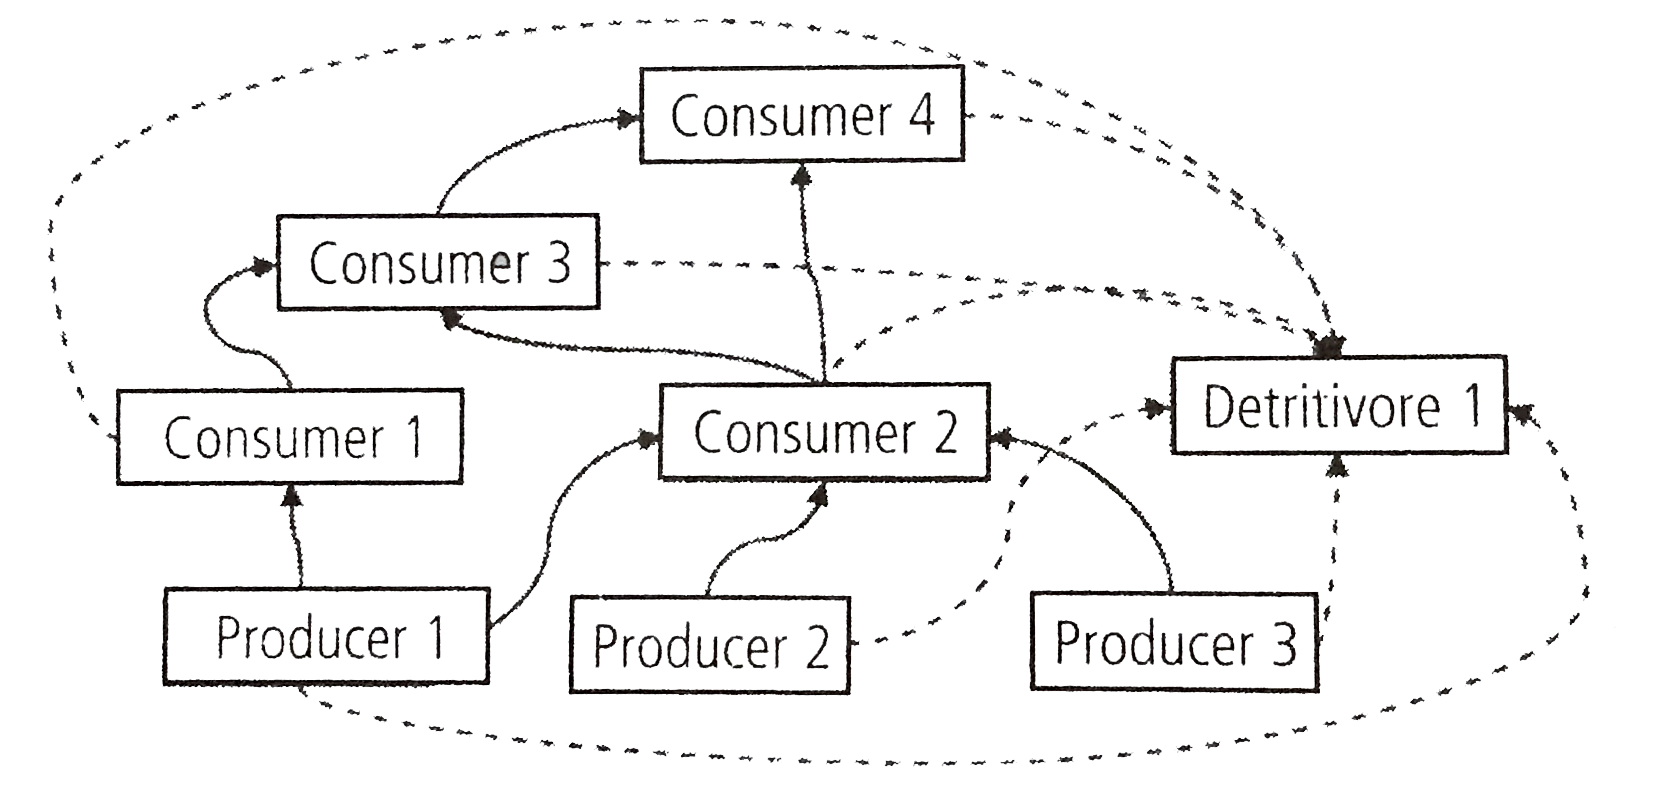
1) DDT present in the ecosystem would accumulate to the highest concentrations in the tissues of detritivore 1.
2) The introduction of consumer 4 individuals from an external population would lead a temporary increase in number of producer 2.
3) Disease in the producer 1 population would lead to an increase in the producer 3 population.
4) Extermination of consumer 3 would cause a sustained increase in the population of consumer 2.ADDT present in the ecosystem would accumulate to the highest concentrations in the tissues of destritivore 1.BThe introduction of consumer 4 individuals from an external population would lead a temporary increasein number of producer 2.CDisease in the producer 1population would lead to an increase in the producer 3 propulation.DExterination of cunsumer 3 would cause a sustained increase in the population of consumer 2.
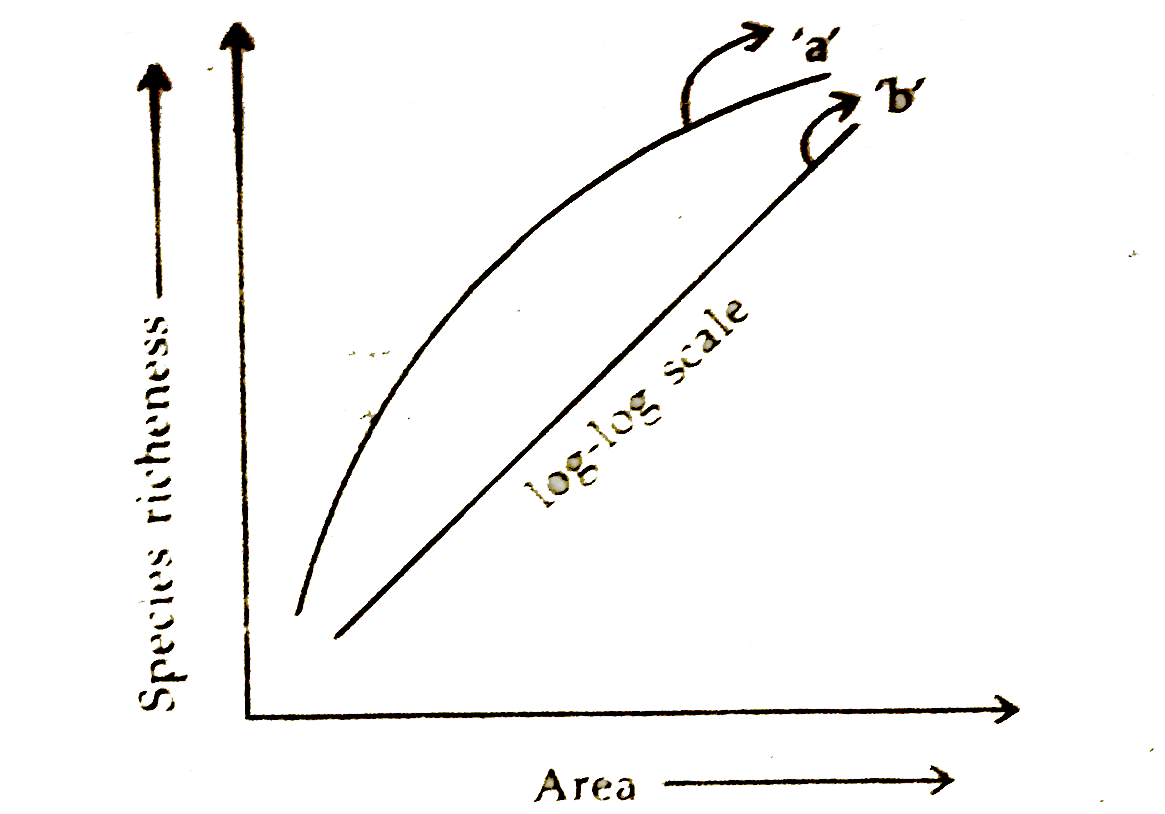
The following graph shows the species area relationship. Answers the Questions as directed.
(a) Name the naturalist who studied the kind of relationship shown in the graph.
Write the observations made by him.
(b) Write the situations as discovered by the ecologists when the value of 'Z' (slope of the line) lies between
(i) 0.1 and 0.2, (ii) 0.6 and 1.2
What does 'Z' stand for ?
(c ) When would the slope of the line 'b' become steeper ?
View SolutionThe following graph shows the species area relationship. Answers the Questions as directed.
(a) Name the naturalist who studied the kind of relationship shown in the graph.
Write the observations made by him.
(b) Write the situations as discovered by the ecologists when the value of 'Z' (slope of the line) lies between
(i) 0.1 and 0.2, (ii) 0.6 and 1.2
What does 'Z' stand for ?
(c ) When would the slope of the line 'b' become steeper ?

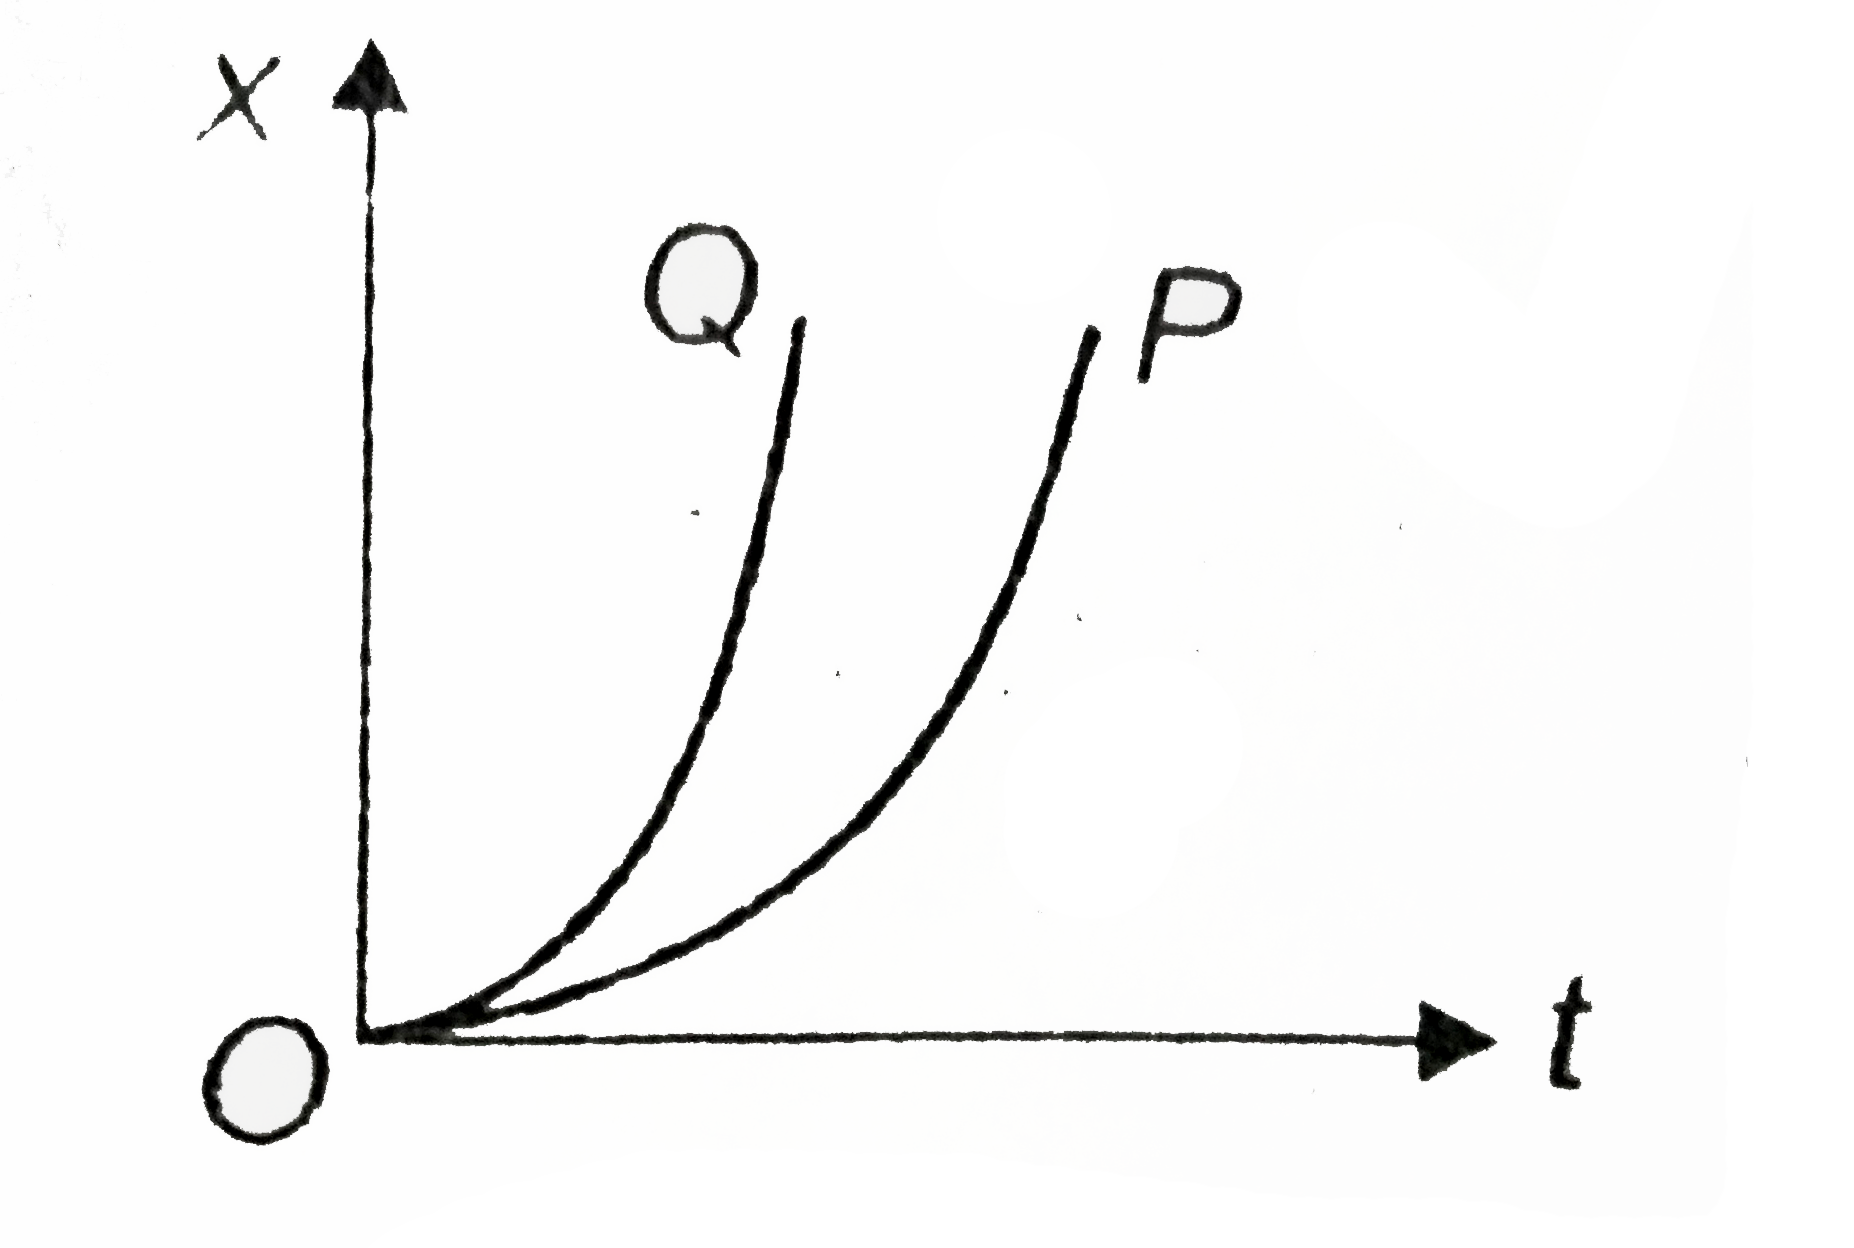
View SolutionThe position-time graph for two particles P and Q moving on x-axis is shown in the figure. Then
View SolutionTwo transparent media of refractive indices μ1 and μ3 have a solid lens shaped transparent material of refractive index μ2 between them as shown in figures in Column II . A ray traversing these media is also shown in the figures . In Column I different relationships between μ1,μ2andμ3 are given . Match them to the ray diagrams shown in Column II .
_E01_240_Q01.png)
View SolutionA ferry boat travels from a dock on the mainland toward an island , stops to discharge and load passengers, then returns to the mainland dock . Among the following graphs, which one best represents the relationship between the distance , in kilometers , of the ferry from the island and the time, in minutes, from when the ferry leaves the mainland dock until it returns ?
View Solution

