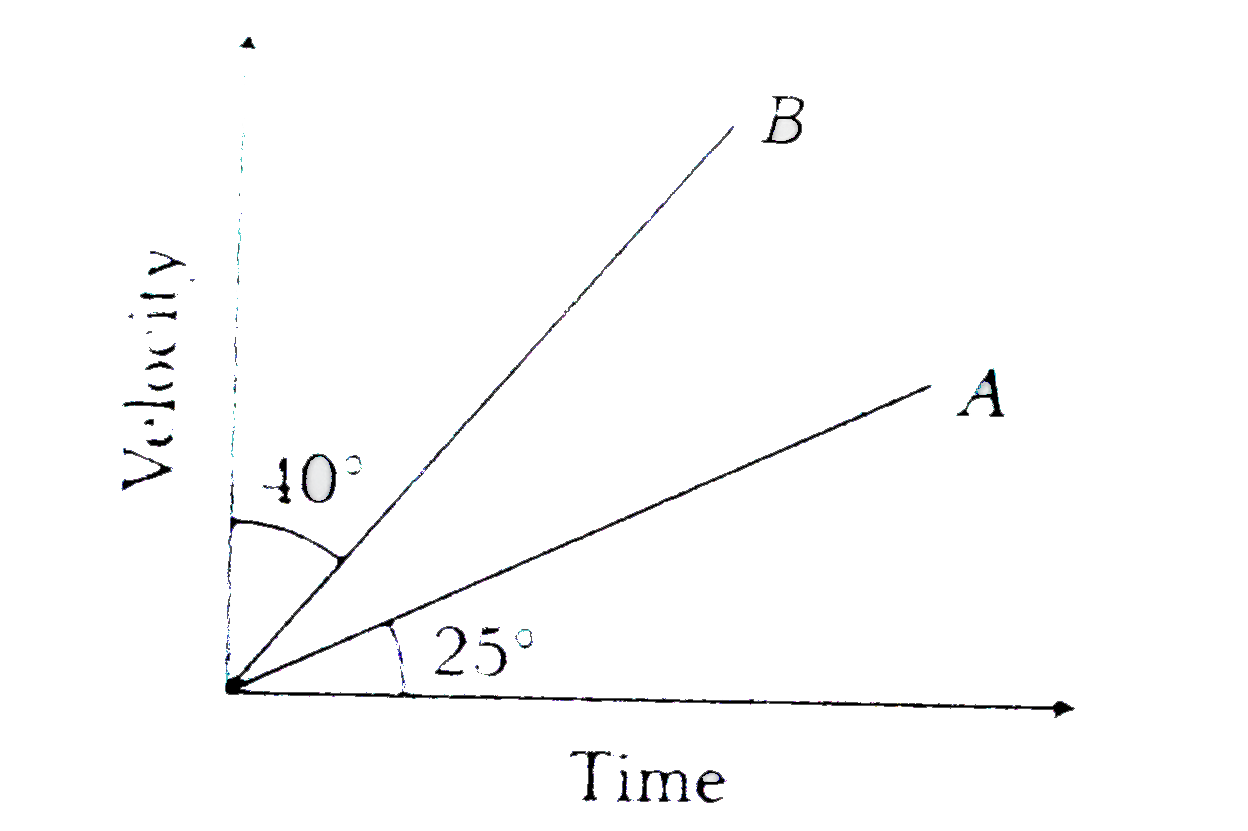
The velocity-time graph for two bodies A and Bare shown. Then the acceleration of A and B are in the ratio
 Solution in Marathi
sin25∘ to sin50∘
tan25∘ to tan40∘
cos25∘ to cos50∘
tan25∘ to tan50∘
Step by step video & image solution for The velocity-time graph for two bodies A and Bare shown. Then the acceleration of A and B are in the ratio by Physics experts to help you in doubts & scoring excellent marks in Class 11 exams.
Topper's Solved these Questions
Similar Questions
When dimensions of a given physical quantity are given,the physical quantity is unique .
01:40View SolutionLight is a form of energy which travels as ________.
02:33View SolutionA body starts from rest at time t = 0 , the acceleration time graph is shown in the figure . The maximum velocity attained by the body will be
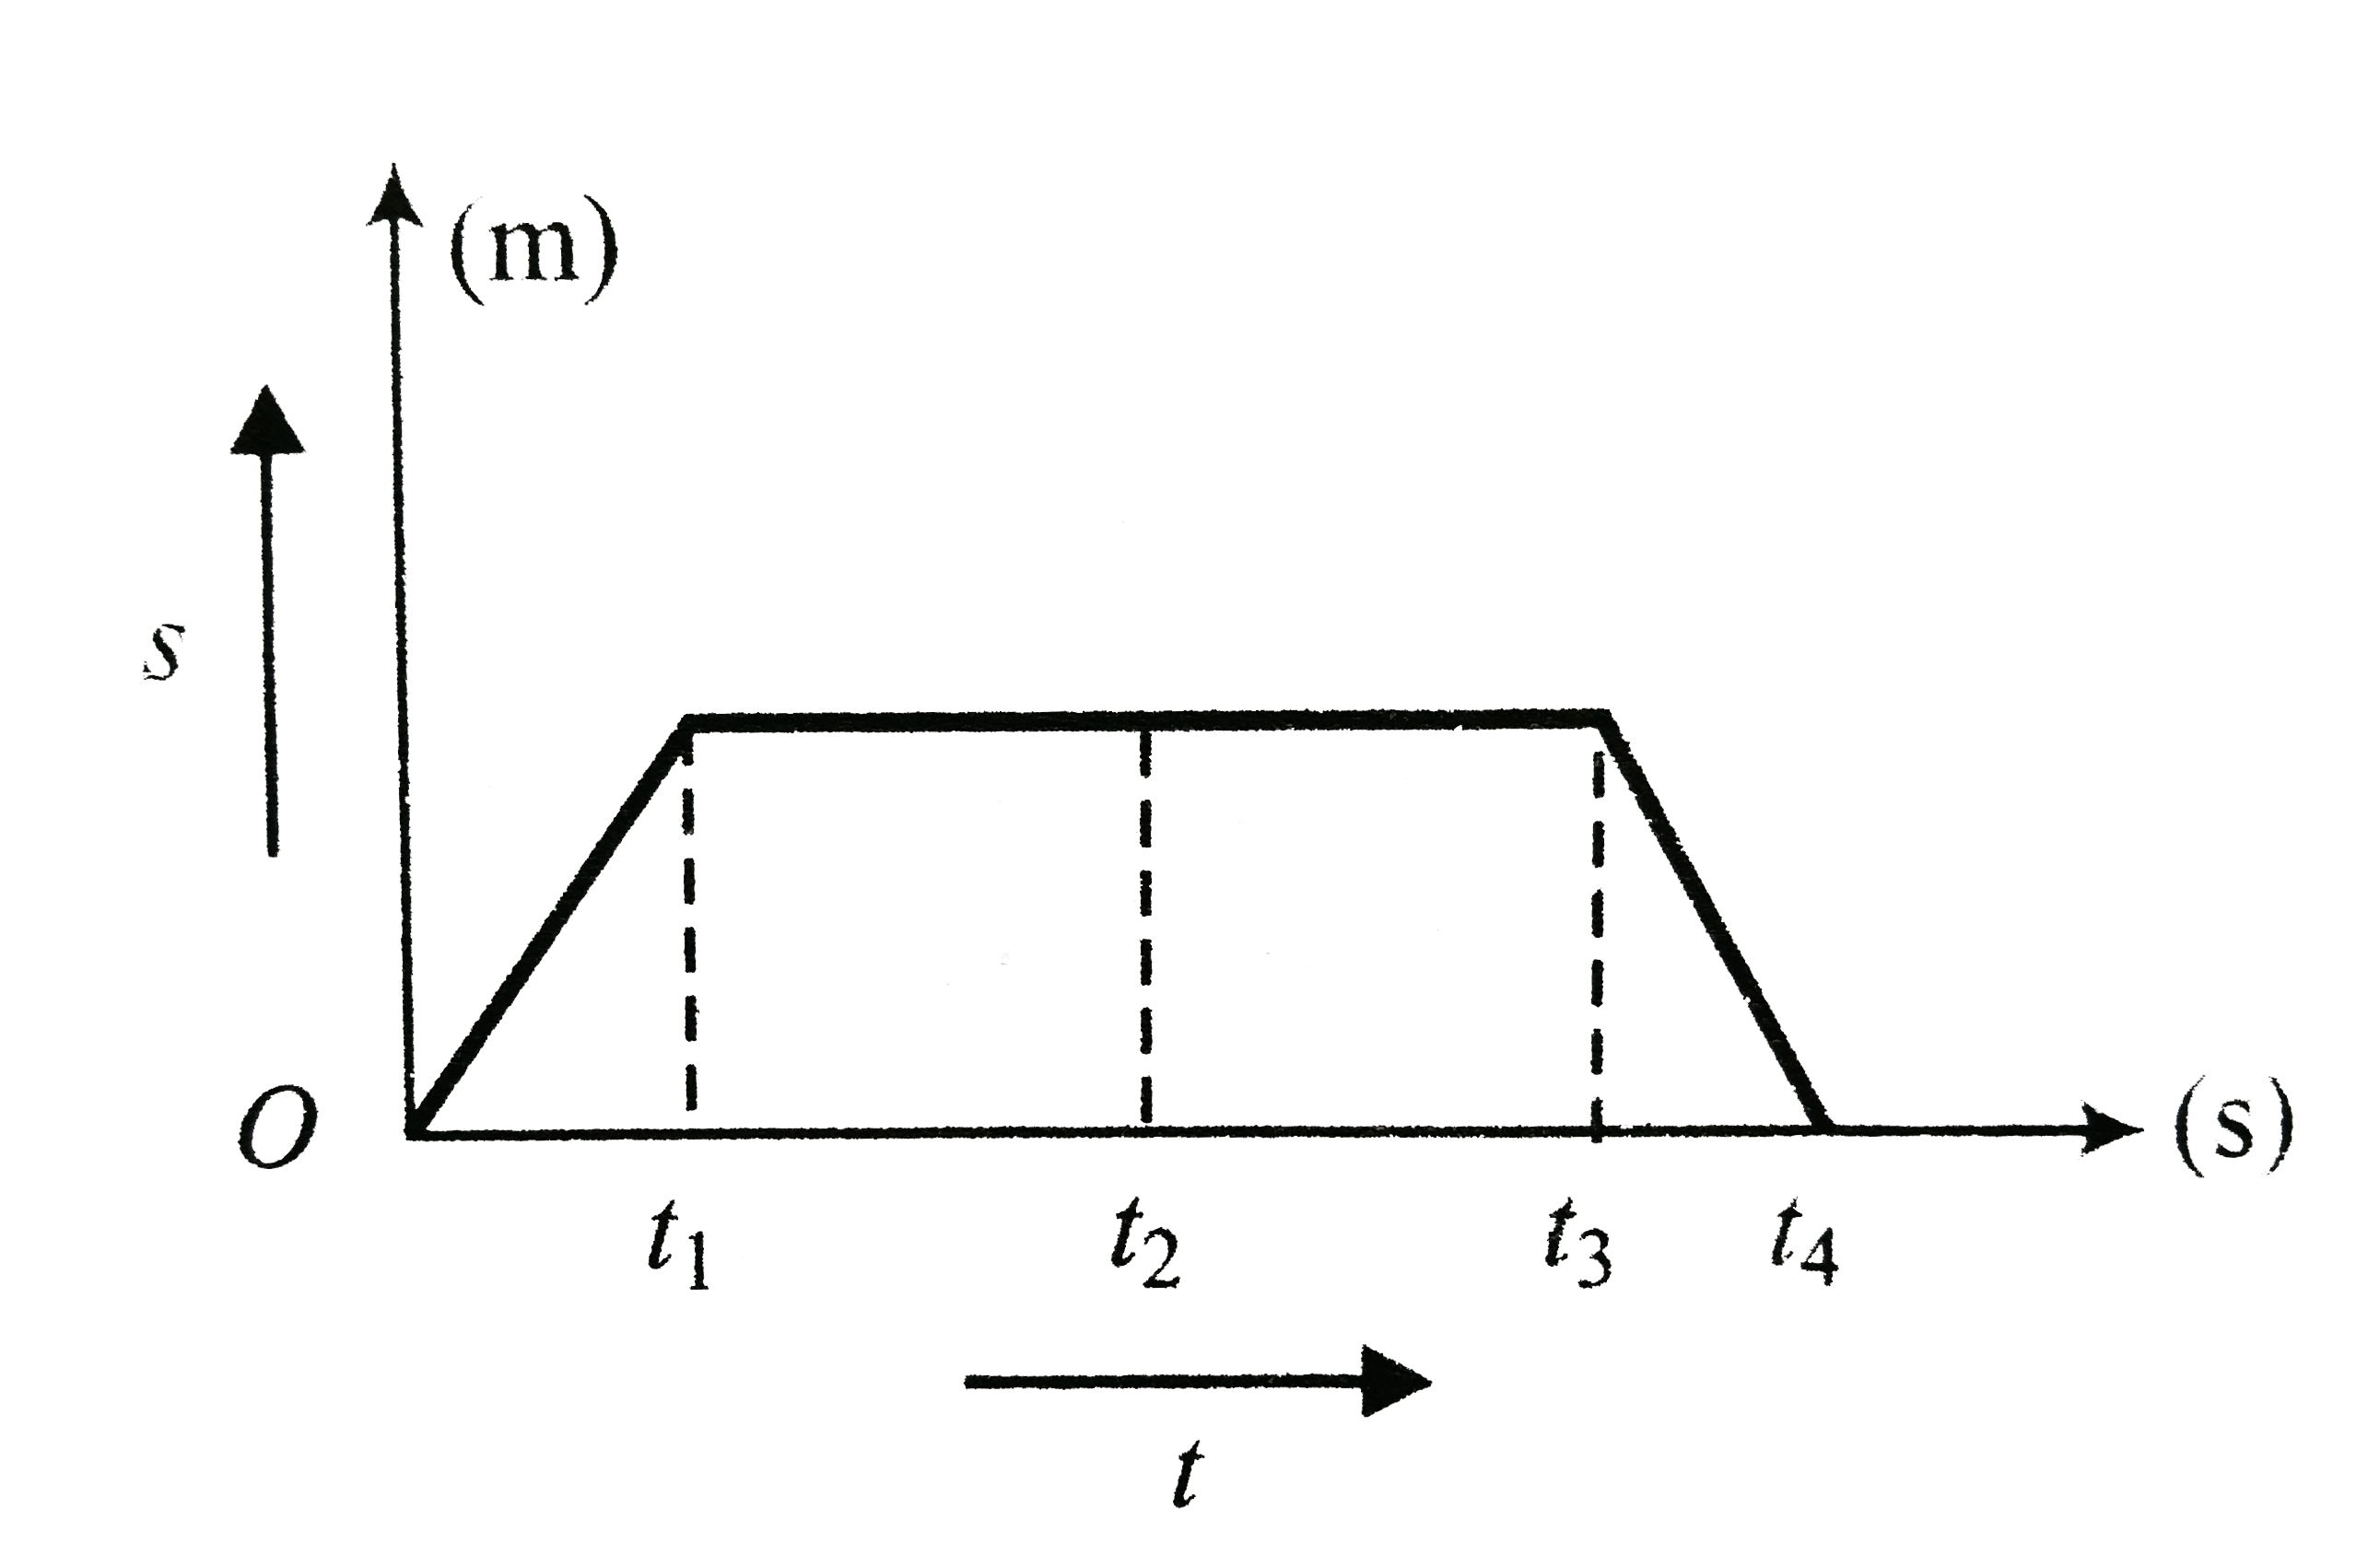
01:59View SolutionThe displacement-time graph of a body is shown in.
 .
.
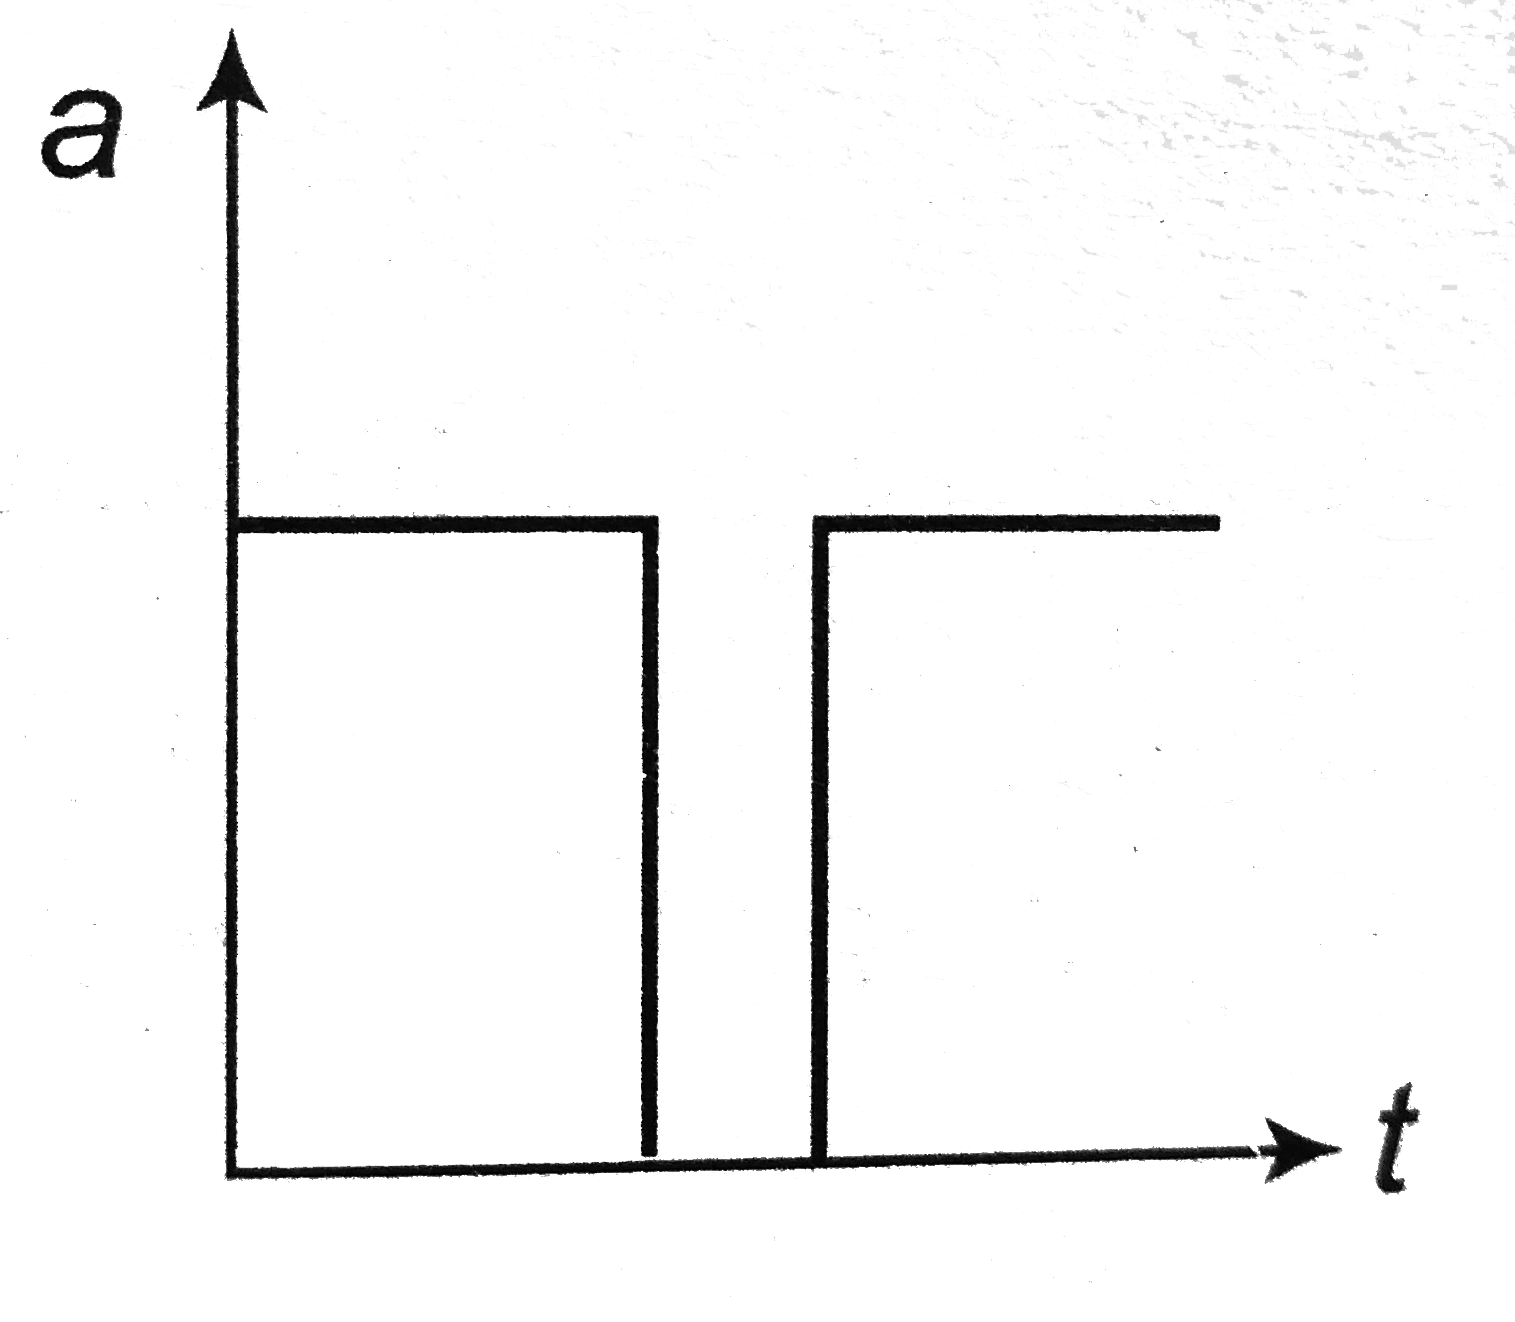
The velocity-time graph of the motion of the body will be .03:22View SolutionThe acceleration time graph of a body is shown below the most probable velocity time graph of the body is
03:11View SolutionAcceleration-time graph of a body is shown. The corresponding velocity-time graph of the same body is.
 03:54View Solution
(a) The velocity time graph of two bodies are shown in Figure. Slope of the graph for body A is positive. What does it signify ?
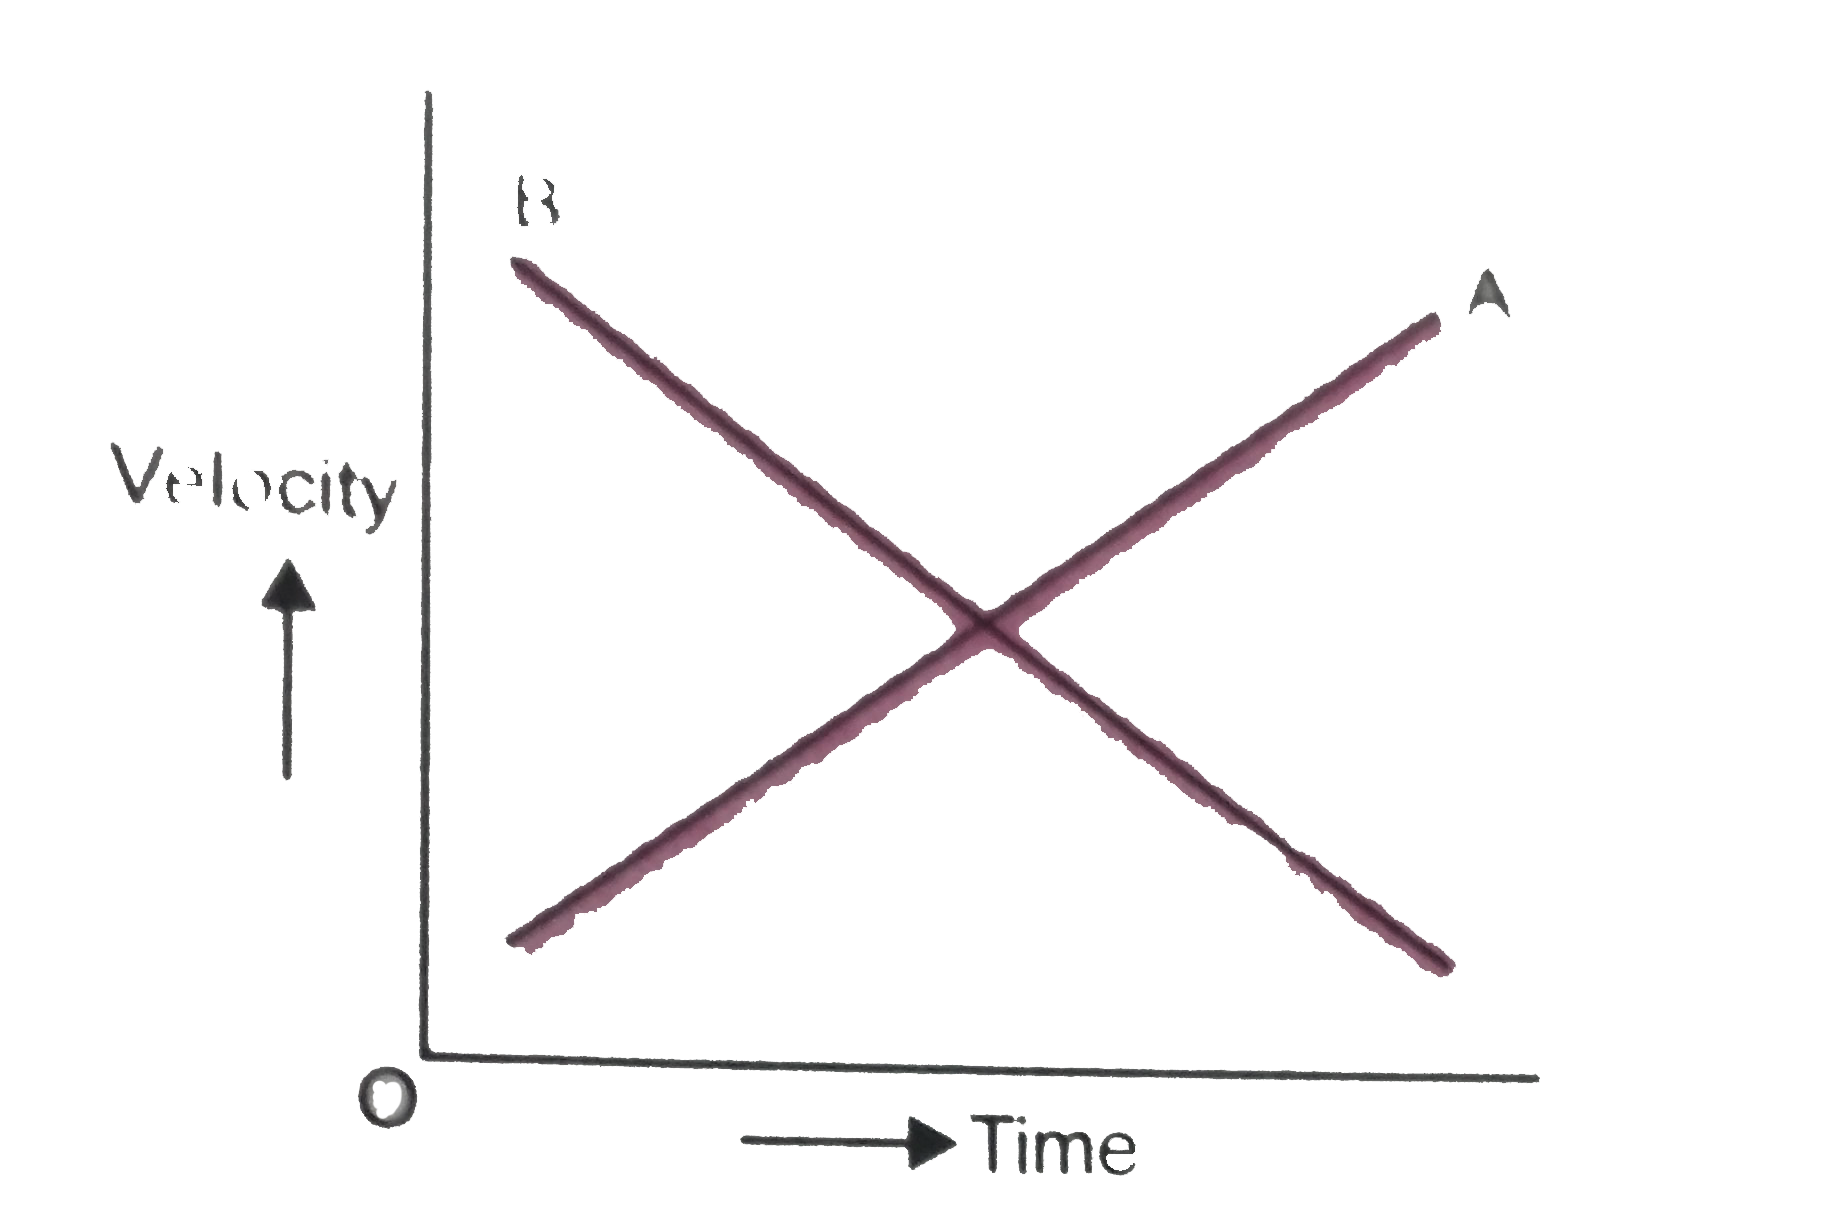
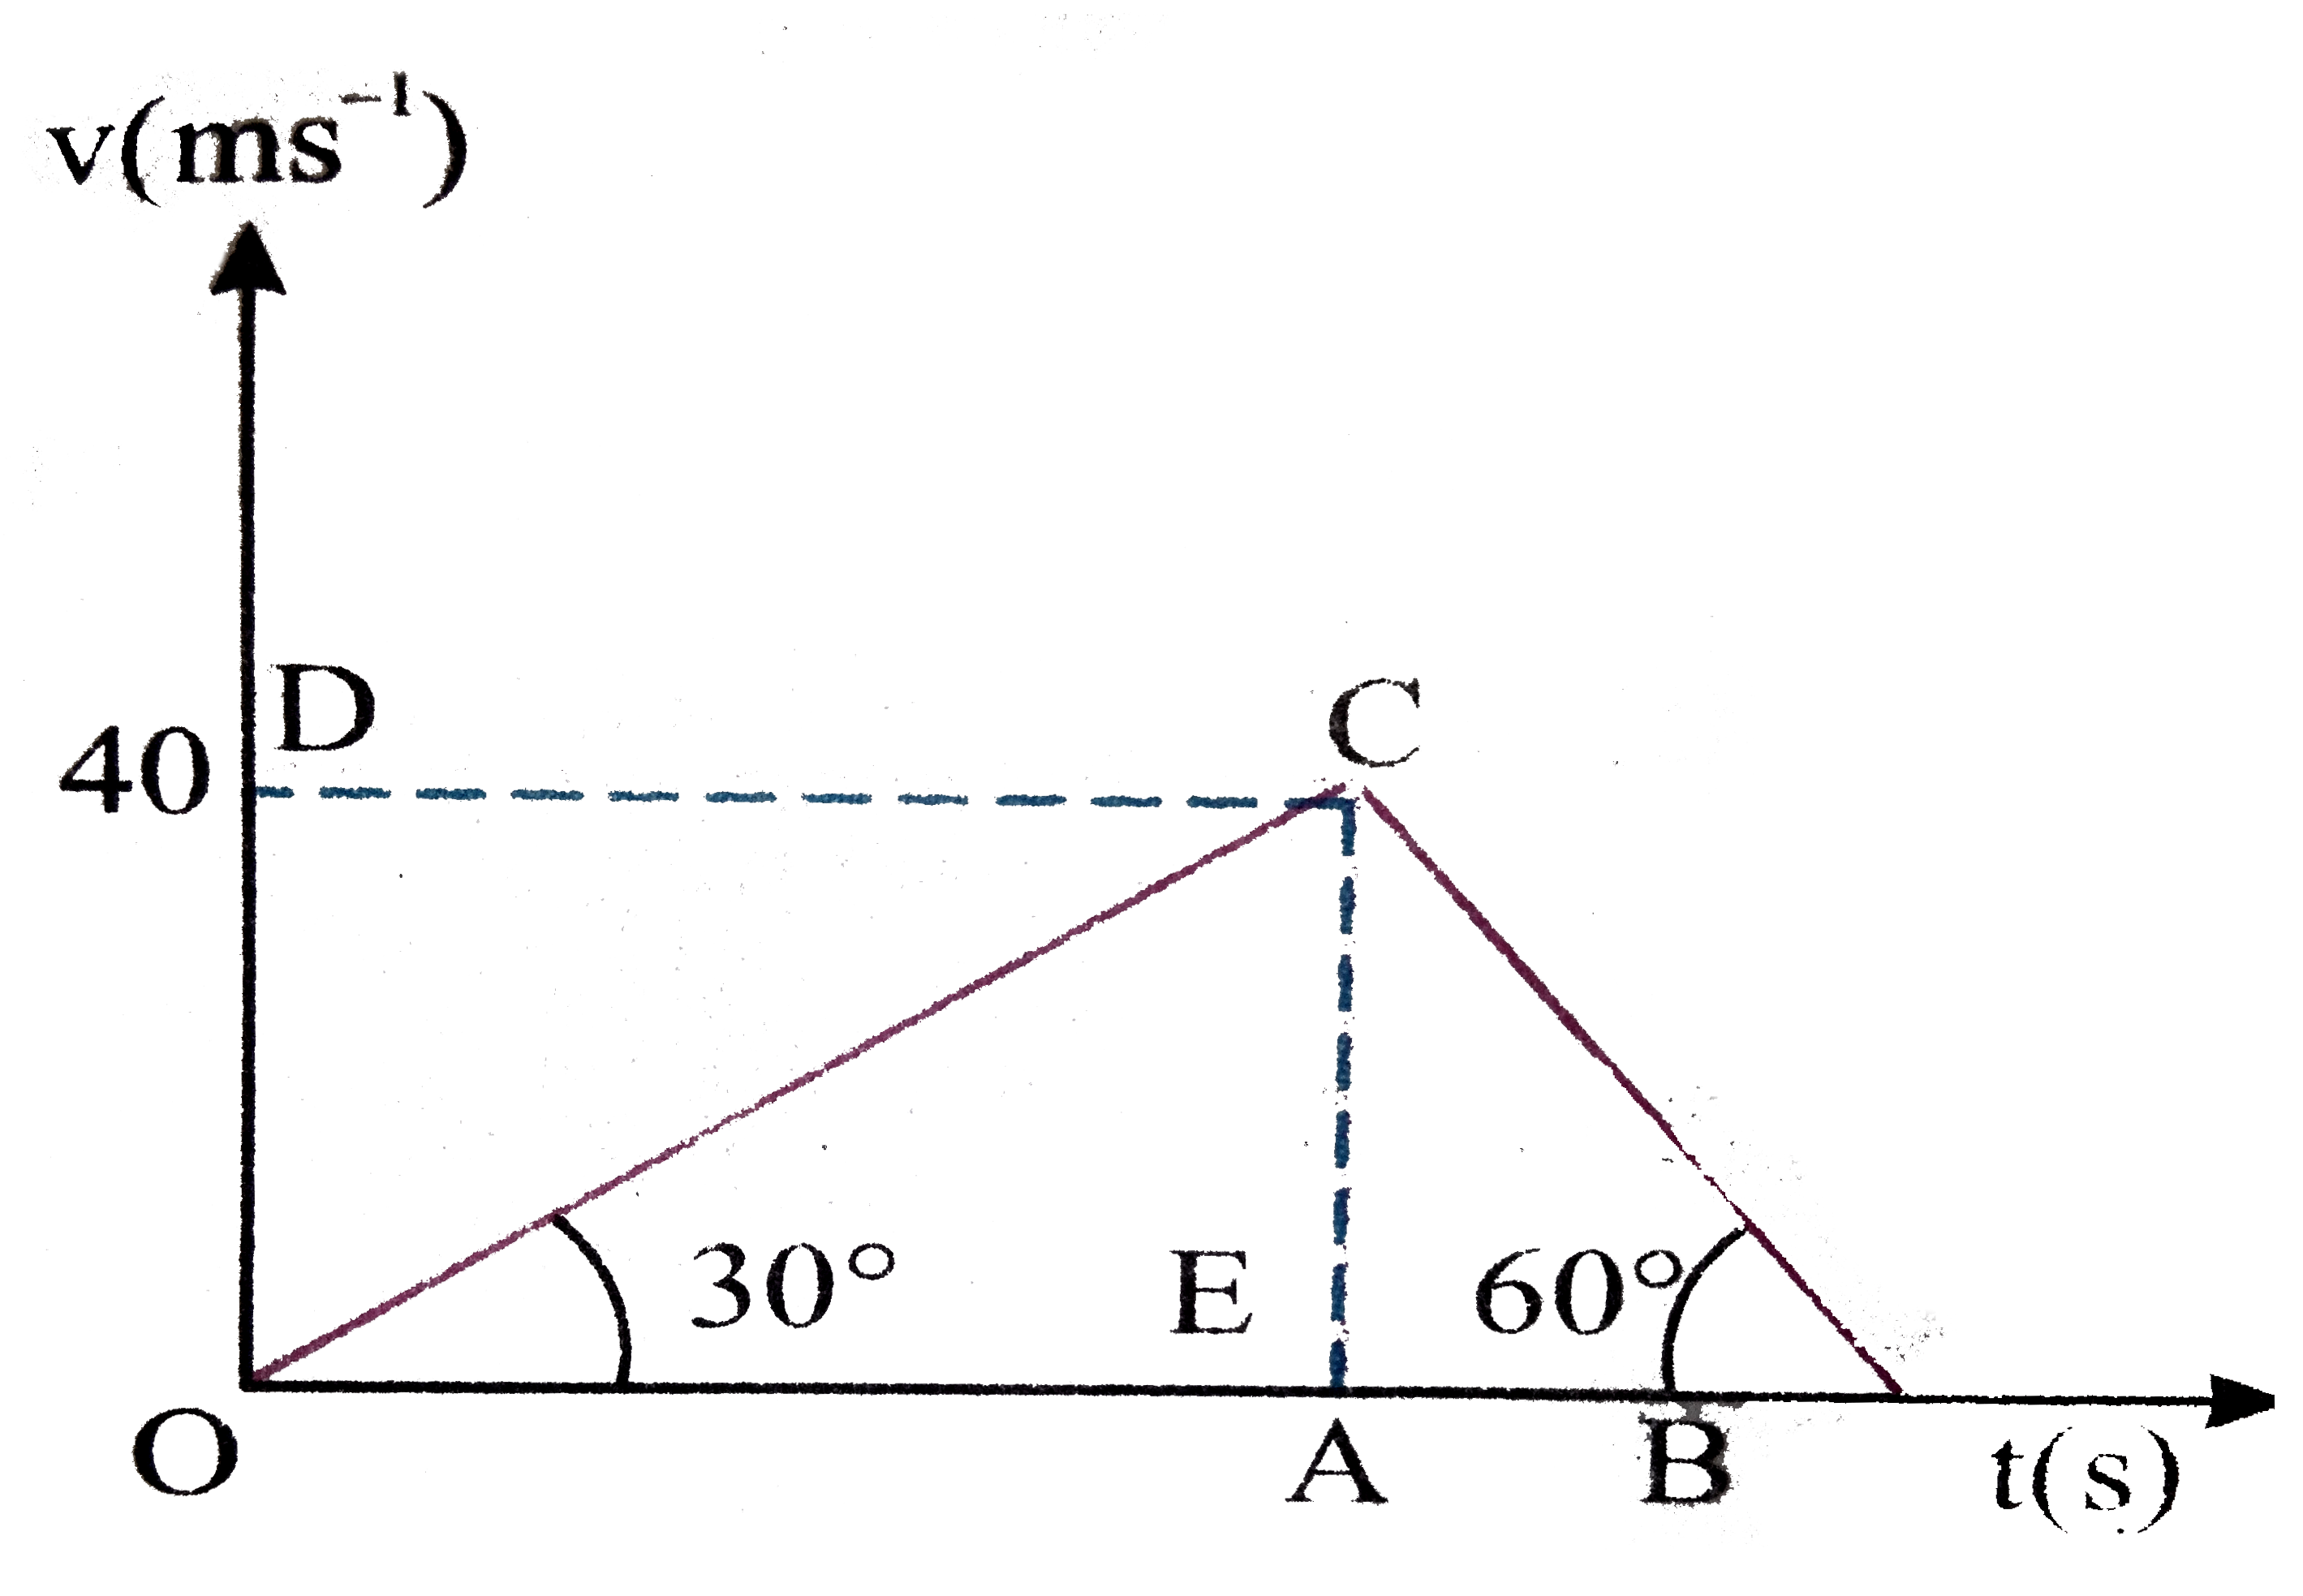
(b) The slope of velocity time graph of body B is negative. What does it represent ?01:40View SolutionThe velocity-time graph of a body is shown in figure. The ratio of magnitude of average acceleration during the intervals OA and AB is
 02:48View Solution
The displacement time graphs of two bodies A and B are shown in figure. The ratio of velocity of A to velocity of B,vA/vB is:
 01:45View Solution
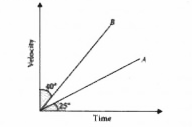
The velocity - time graph for two bodies A and B are shown in figure. Then, the acceleration of A and B are in the ratio
 01:45View Solution
The velocity - time graph for two bodies A and B are in the ratio
07:22View SolutionThe velocity - time graph for two bodies A and B are in the ratio
 02:09View Solution
Acceleration -time graph of a body starts from rest as shown below :
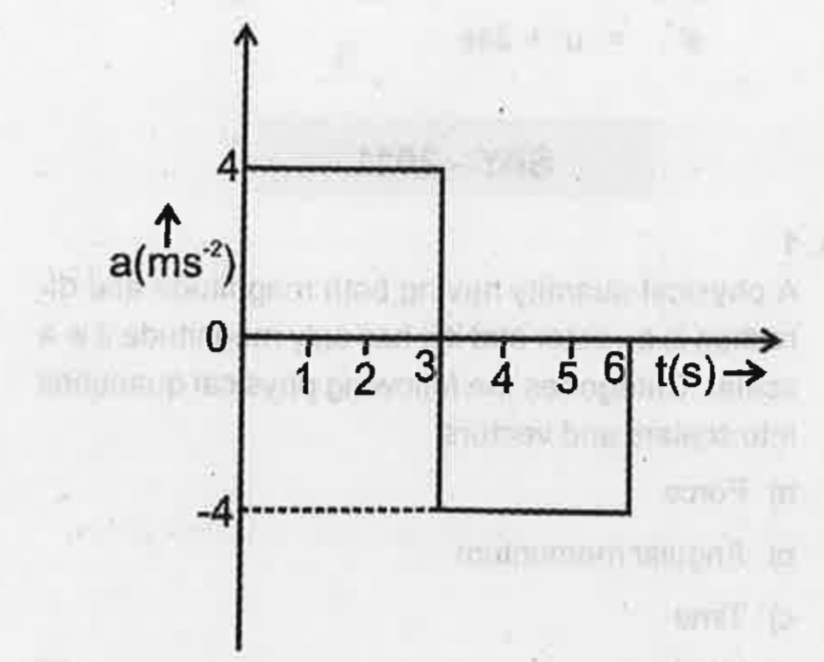
Draw the velocity-time graph using the above graph01:06View SolutionThe velocity - time graph for two bodies A and B are shown in figure. Then, the acceleration of A and B are in the ratio
 01:28View Solution
The displacement-time graph of a body is shown in.
 .
.
The velocity-time graph of the motion of the body will be .01:54View Solution
The acceleration time graph of a body is shown below the most probable velocity time graph of the body is01:53View Solution

