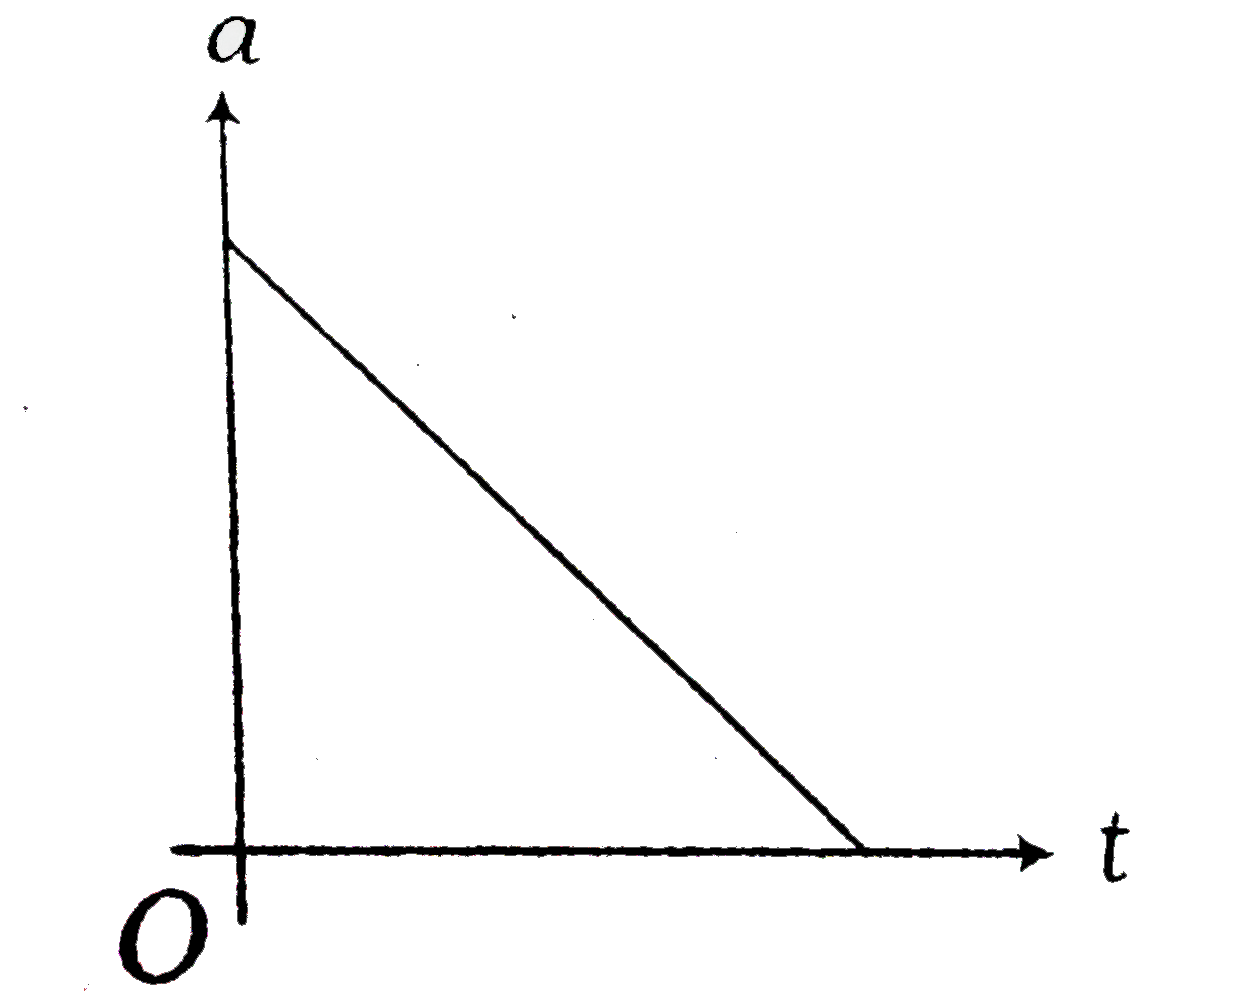
Acceleration (a) - time (t) graph of a body is given
Fig.2.21(a)
Which of the following graphs the corresponding veolcity (v) - time (t) variation? 


The correct Answer is:B
When a is constant, velocity increases uniformly with time and when a=0, velocity is consant.
This variation is correctly shown by the graph (b).
Topper's Solved these Questions
- MOTIONBOOK - MCGROW HILL PUBLICATIONCHAPTER - MOTIONEXERCISE - HIGHER ORDER THINKING QUESTIONS
48 Videos
- MISCELLANEOUS QUESTIONSBOOK - MCGROW HILL PUBLICATIONCHAPTER - MISCELLANEOUS QUESTIONSEXERCISE - PART-B
99 Videos
- REFLECTION OF LIGHT BOOK - MCGROW HILL PUBLICATIONCHAPTER - REFLECTION OF LIGHT EXERCISE - HIGHER ORDER THINKING QUESTIONS
10 Videos
Similar Questions
The acceleration (a)-time(t) graph for a particle moving along a straight from rest is shown in figure. Which of the following graph is the best representation of its velocity (v) with time (t) ?
View SolutionThe acceleration (a)-time(t) graph for a particle moving along a straight from rest is shown in figur. Which of the following graph is the best representation of its velocity (v) with time (t) ?

View Solution
Knowledge Check
Which of the following shows velocity (v) - time (t) graph for falling apple?
A B
B C
C D
D
Which of the following shows the velocity (v) - time (t) graph for a falling apple?
A B
B C
C D
D
Figure shows the acceleration-time graphs of a particle. Which of the following represents the corresponding velocity -time graph?
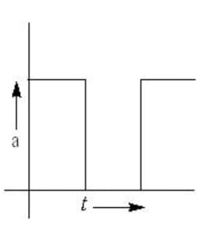 A
A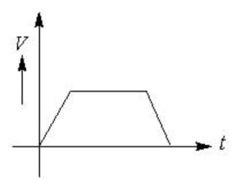 B
B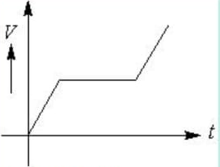 C
C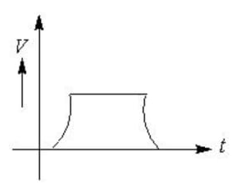 D
D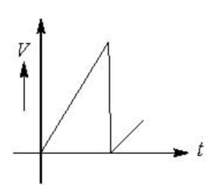
The graph below shws the velocity versus time graph for a body
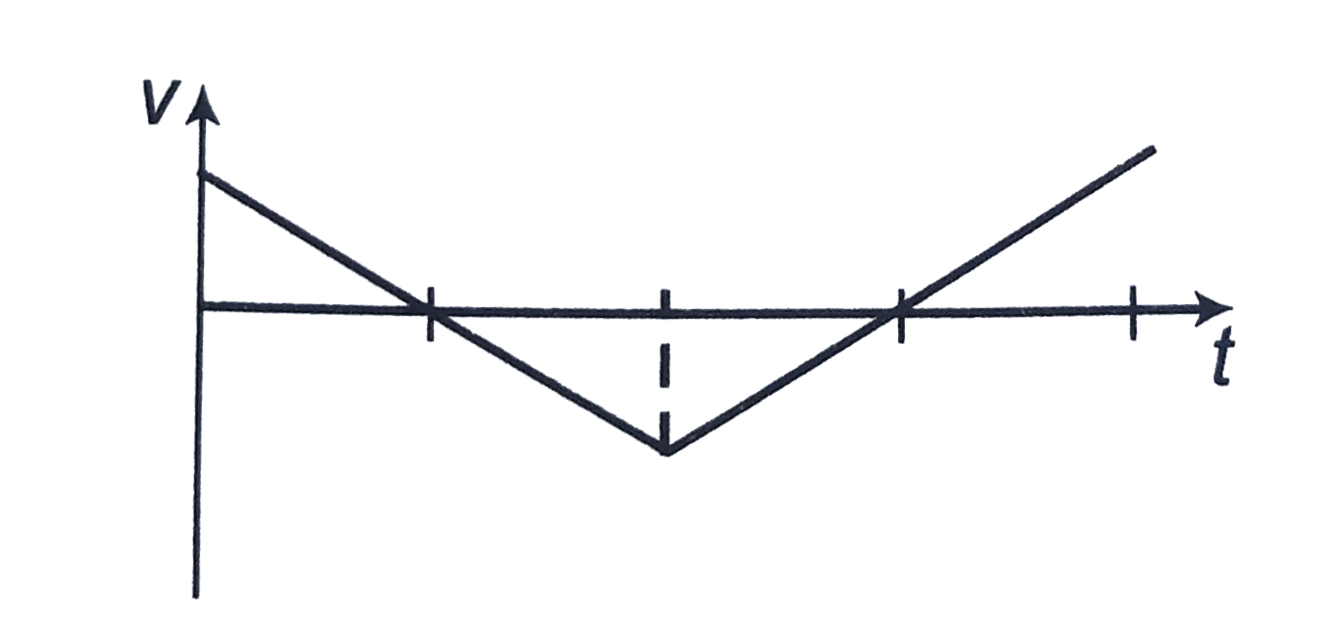
Which of the following graph represents the corresponding acceleration v//s time graph?
View SolutionThe acceleration (a)-time(t) graph for a particle moving along a straight from rest is shown in figur. Which of the following graph is the best representation of its velocity (v) with time (t) ?

View SolutionThe graph below shws the velocity versus time graph for a body

Which of the following graph represents the corresponding acceleration v//s time graph?
View SolutionWhich of the following cannot be speed (v) - time (t) graph?
View SolutionAcceleration a versus time t graph of a body in SHM is given by a curve shown below. T is the time period Then corresponding graph between kinetic energy KE and time t is correctly represented by
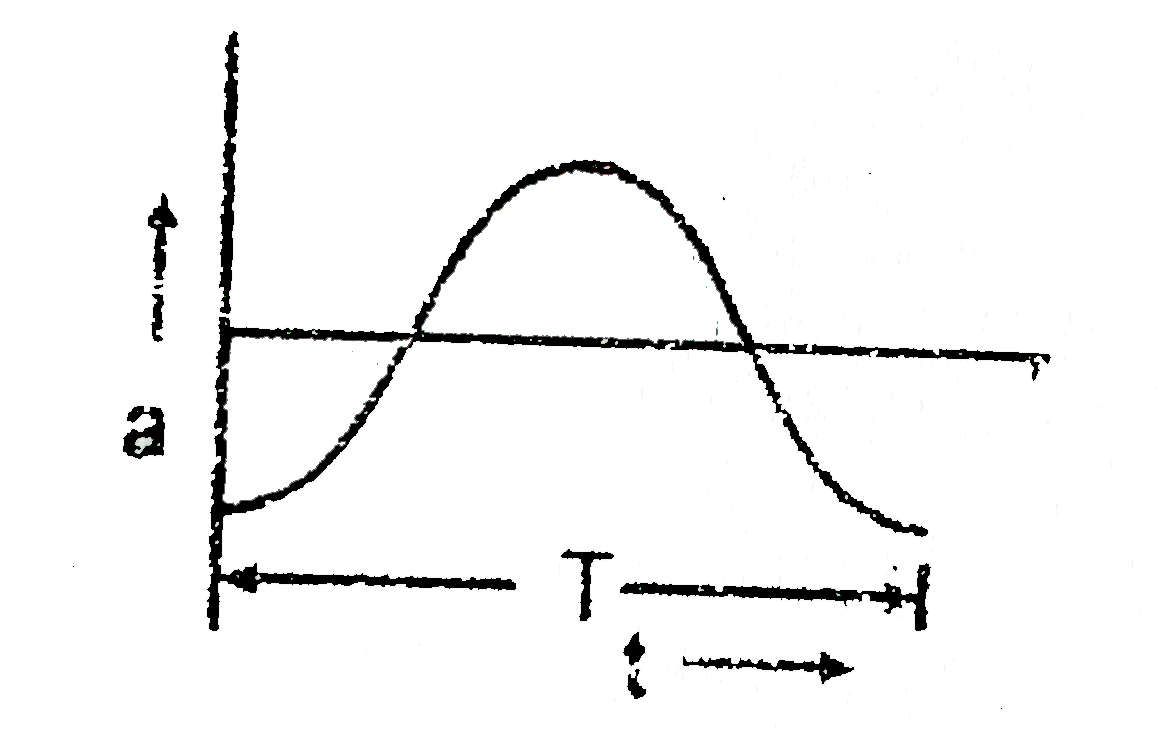
View Solution
