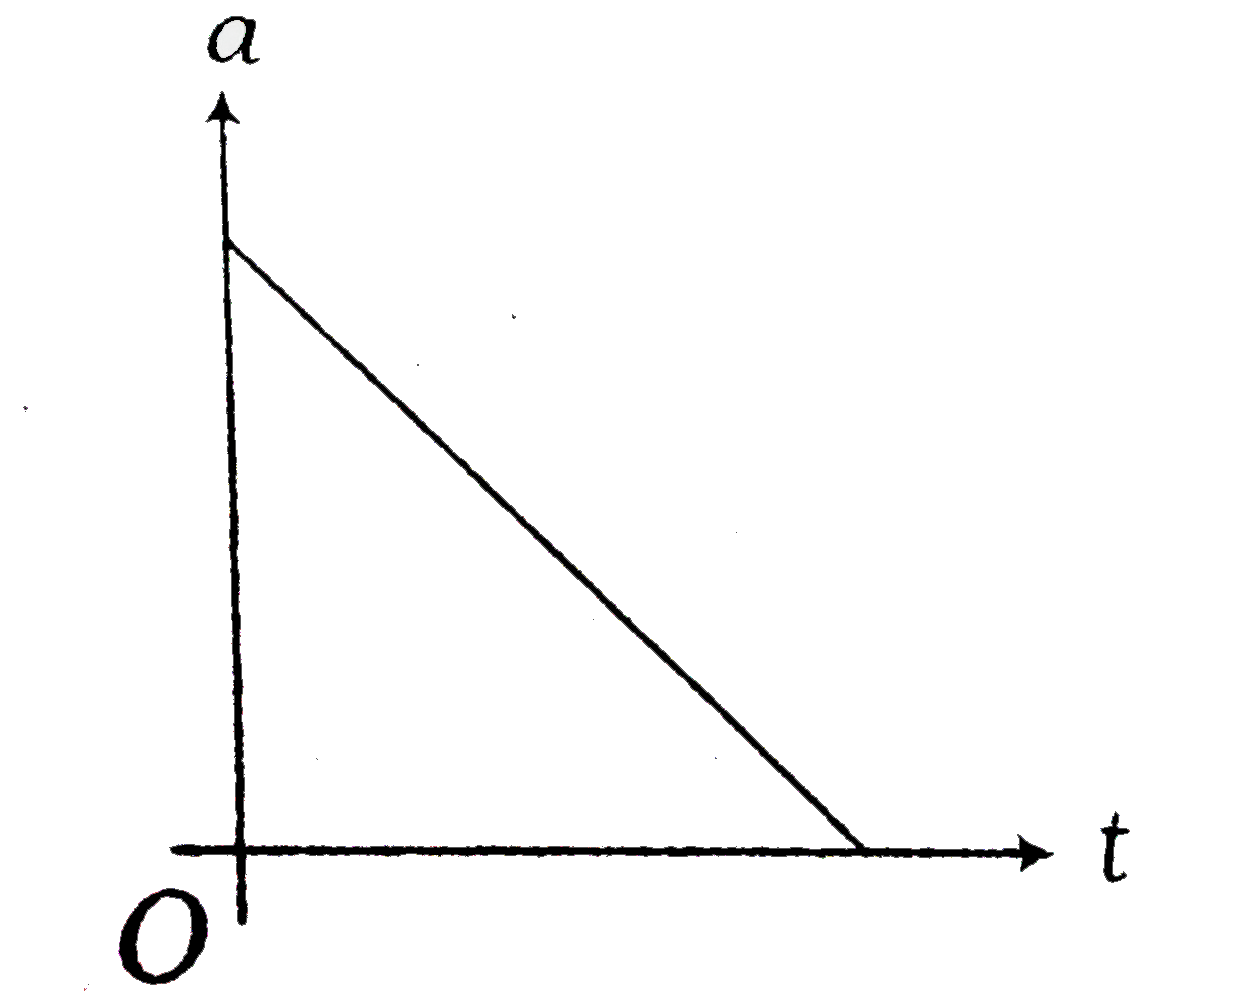
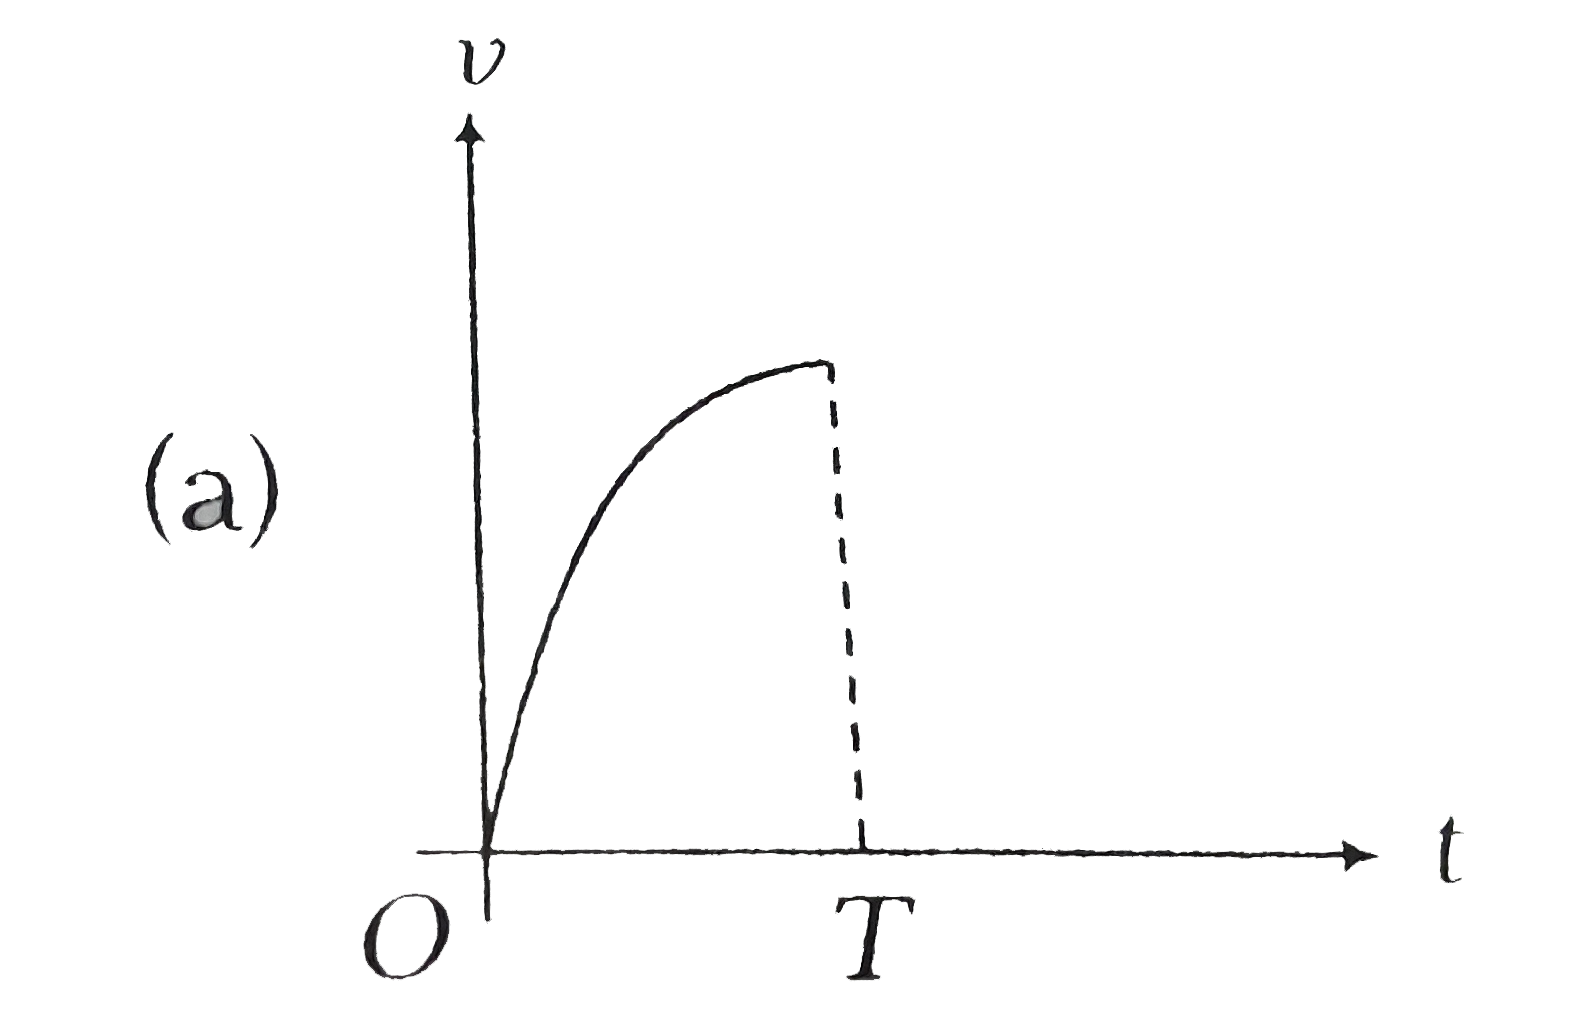
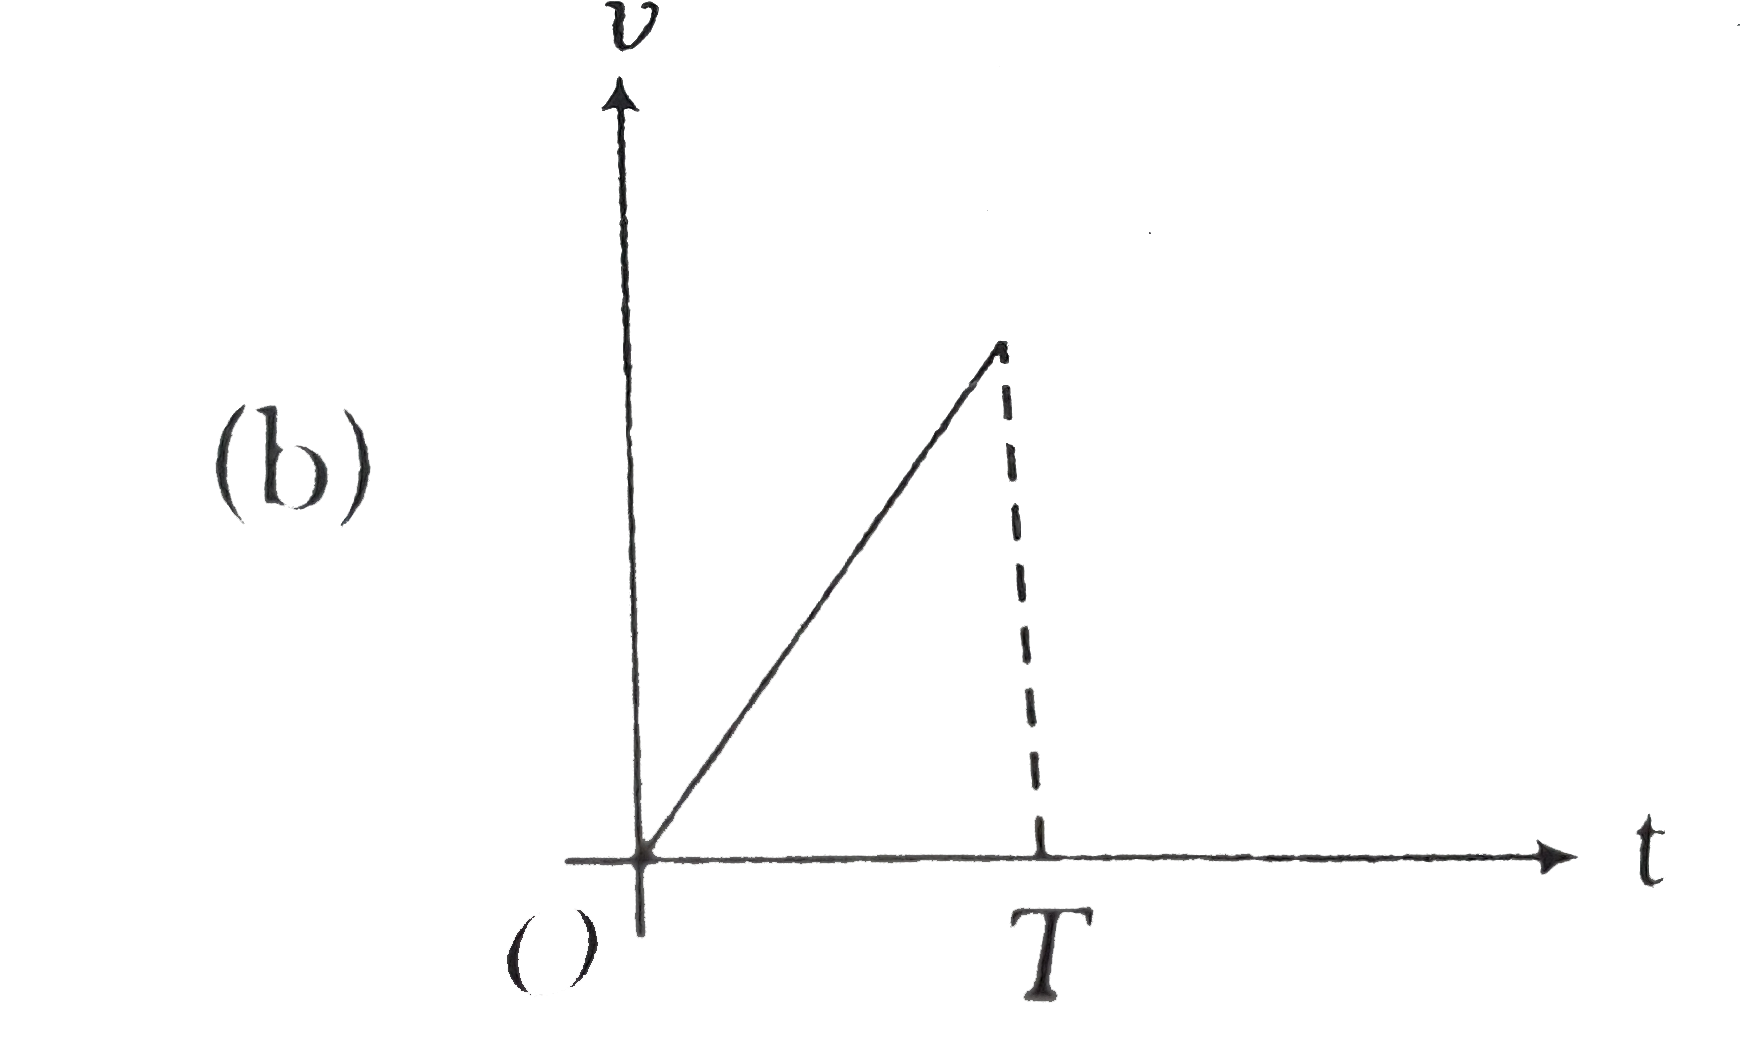
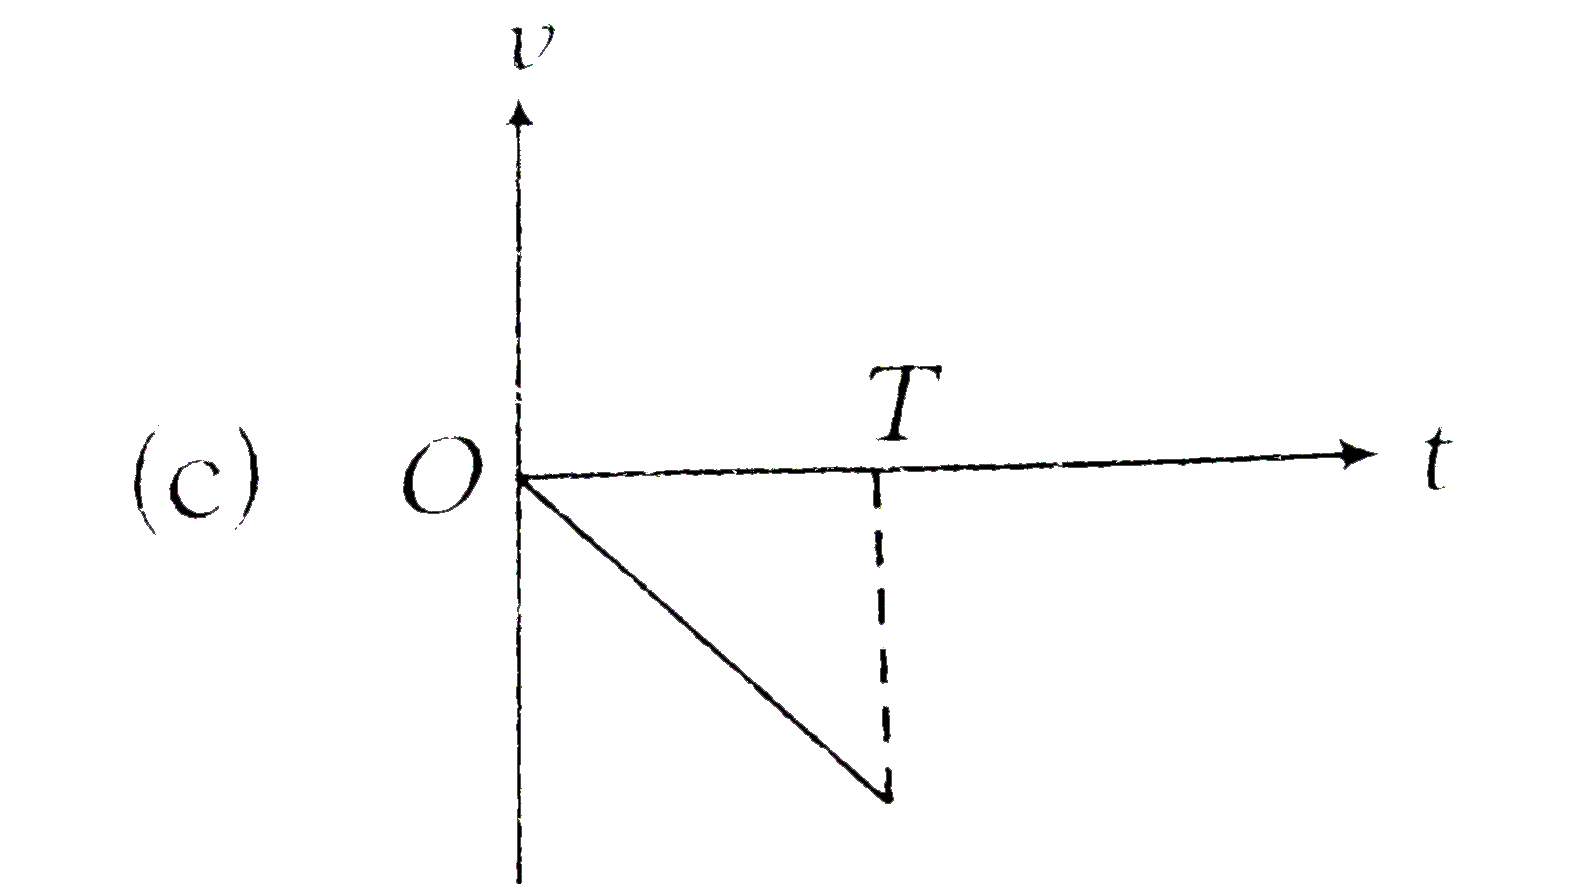
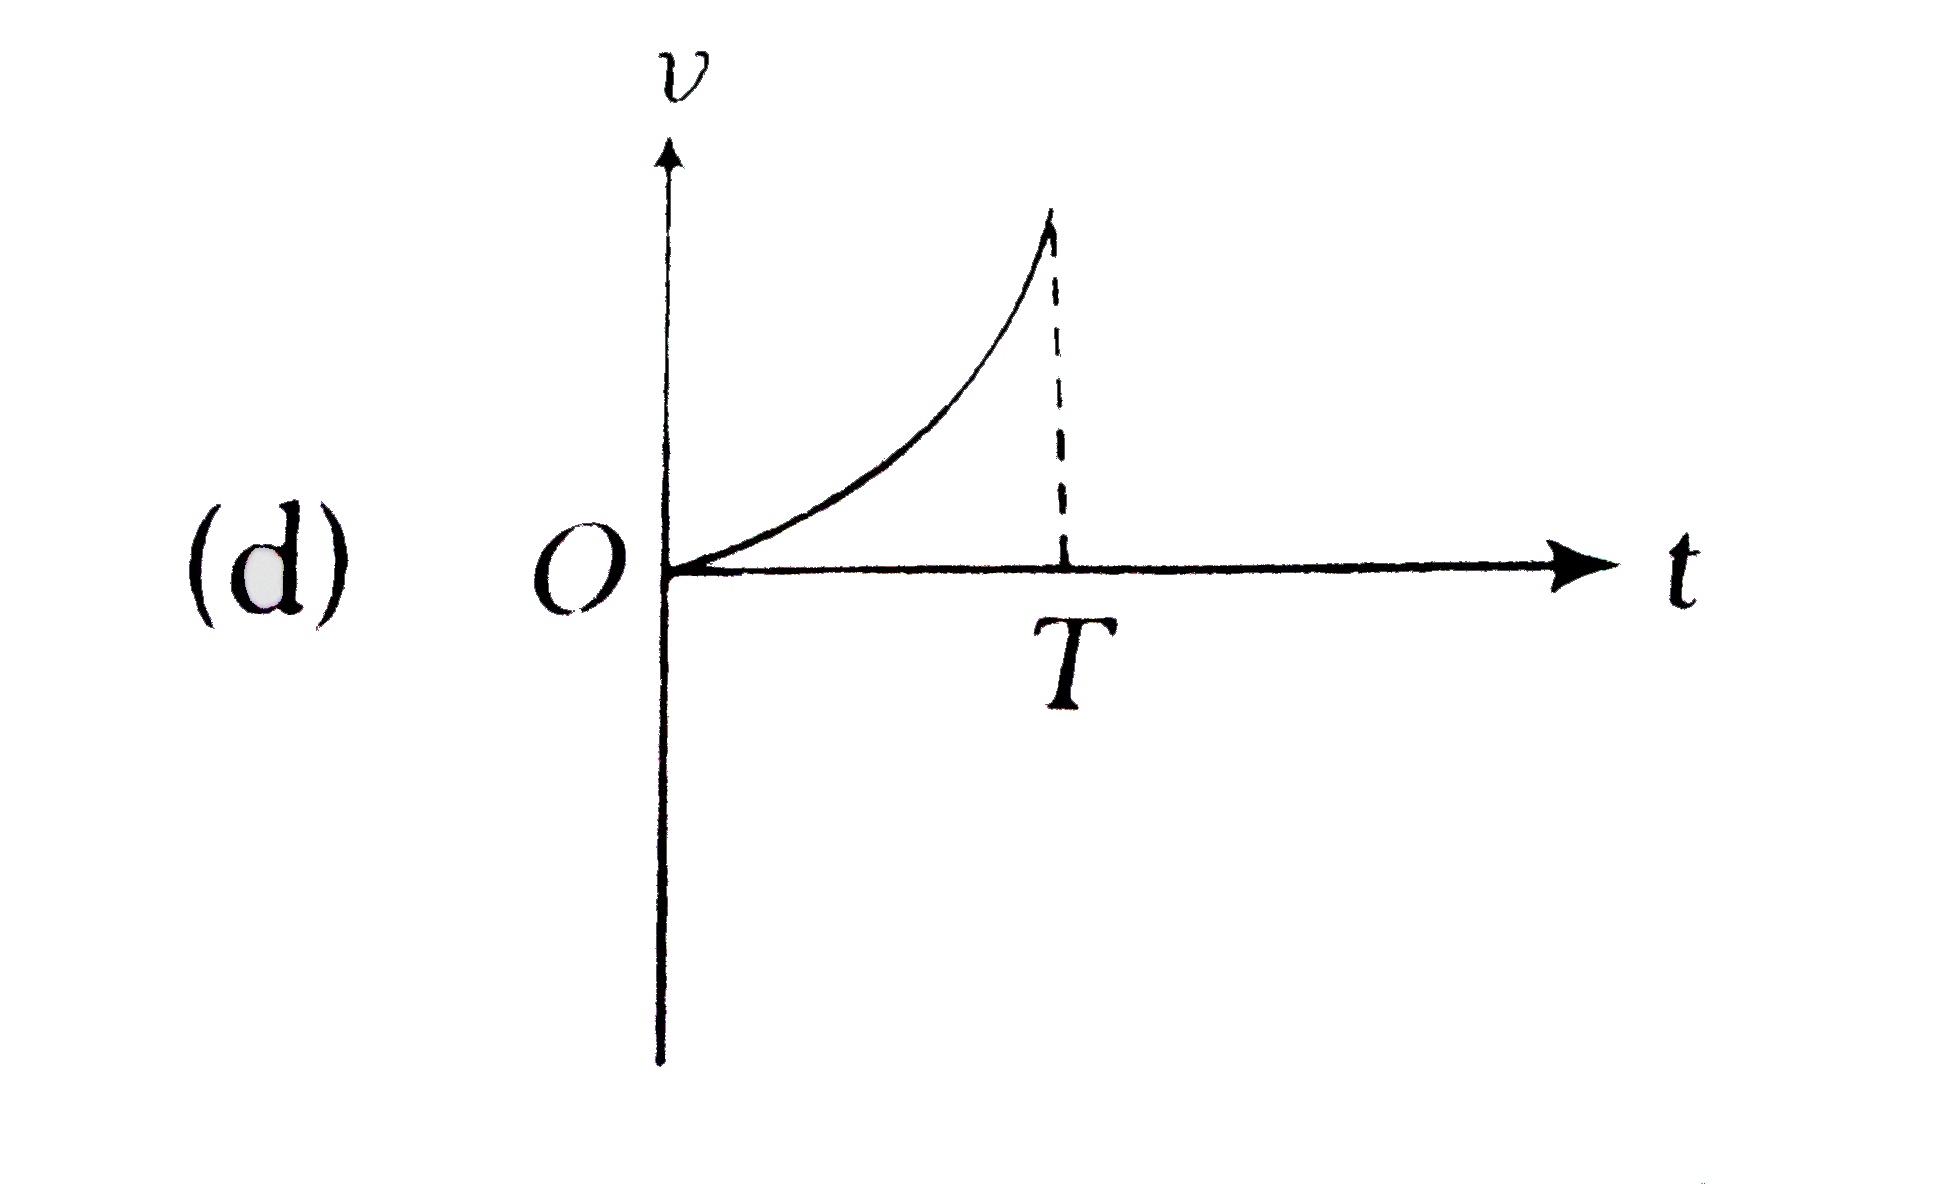
The acceleration (a)-time(t) graph for a particle moving along a straight from rest is shown in figur. Which of the following graph is the best representation of its velocity (v) with time (t) ?
The correct Answer is:A
Given acceleration-time graph is shown in figure.
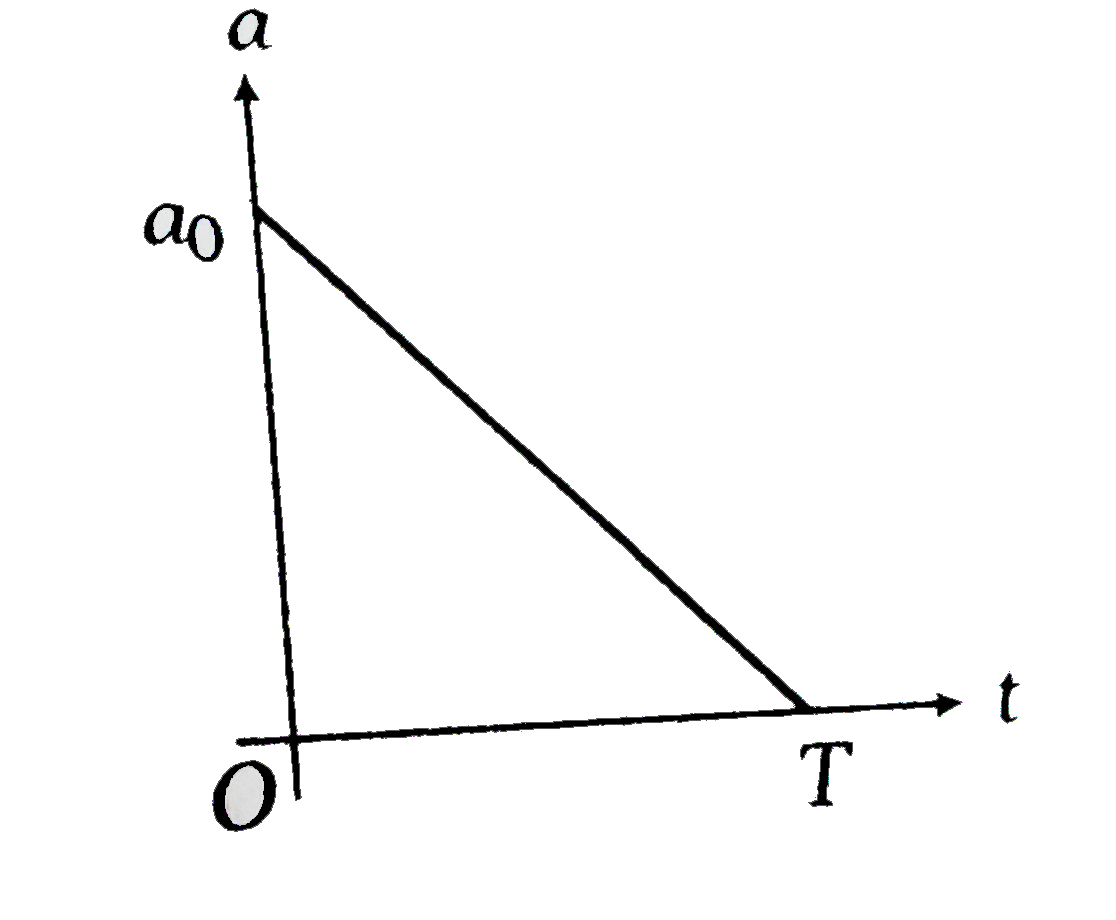
Let a(t=0)=a0= constant
From the graph, we have
tT+aa0=1
⇒a0t+aT=a0T ….(i)
Also, we know that
a=dυdt ....(ii)
From Eqs. (i) and (ii), we have
a0T−a0tT=dυdt
Integrating both sides, we get
∫t0(a0T−a0t)dt=T∫υ0dυ
⇒a0Tt−a0t22=Tυ⇒=a0t−a02Tt2
Therefore, υ−t graph must be parabolic.
Now, at t=0,υ=0
t=T,υ=a0T2 = constant
These conditions are asatisfied by graph (a).
Topper's Solved these Questions
- MOTION IN A PLANEBook:DC PANDEY ENGLISHChapter:MOTION IN A PLANEExercise:(B) Meical entrance special format questions (Assertion and reason)
Explore 19 Videos
- MOTION IN A PLANEBook:DC PANDEY ENGLISHChapter:MOTION IN A PLANEExercise:(B) Meical entrance special format questions (Mathch the columns)
Explore 6 Videos
- MOTION IN A PLANEBook:DC PANDEY ENGLISHChapter:MOTION IN A PLANEExercise:Check point 3.7
Explore 15 Videos
- MOTIONBook:DC PANDEY ENGLISHChapter:MOTIONExercise:Medical entrances gallery
Explore 19 Videos
- PROJECTILE MOTIONBook:DC PANDEY ENGLISHChapter:PROJECTILE MOTIONExercise:Level - 2 Subjective
Explore 10 Videos
Similar Questions
The acceleration (a)-time(t) graph for a particle moving along a straight from rest is shown in figure. Which of the following graph is the best representation of its velocity (v) with time (t) ?

View SolutionDisplacement time graph of a particle moving in a straight line is a shown in figure.

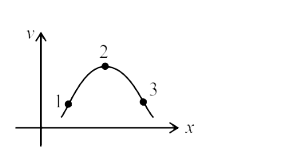
View SolutionThe v-x graph for a particle moving along a straight line is shown in the figure. At which of the points marked, the acceleration is negative?
View SolutionThe force acting on a particle moving along a straight line varies with time as shown in diagram.
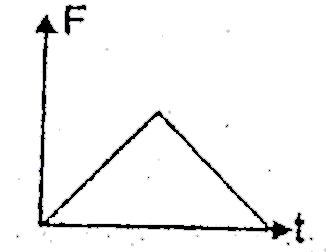
Which of the following graphs is best representative of its speed and time graphs. Initial velocity the particle is zero.
View SolutionThe force acting on a particle moving along a straight line varies with time as shown in diagram.

Which of the following graphs is best representative of its speed and time graphs. Initial velocity the particle is zero.
View SolutionThe acceleration - velocity graph of a particle moving in a straight line is shown in figure. Then the slope of the velocity- displacement graph
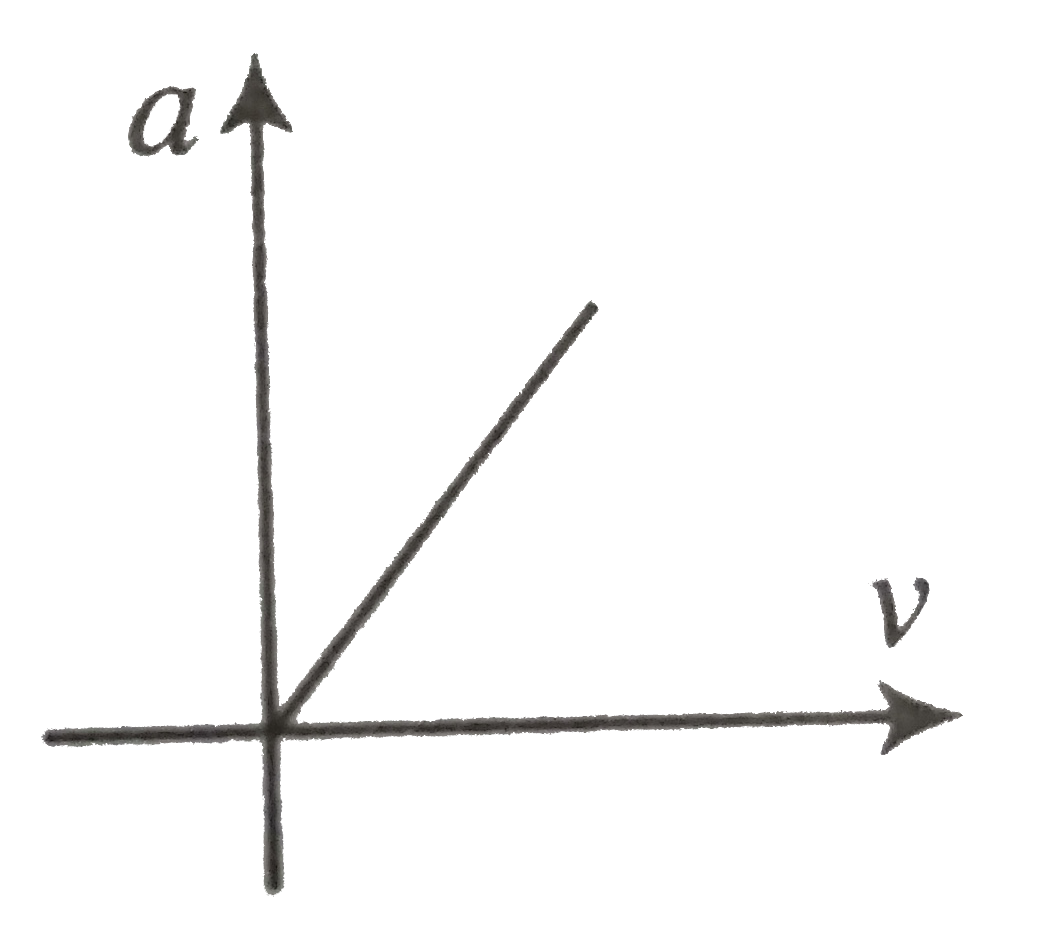
View SolutionThe acceleration-time (a−t) graph of a particle moving along straight line is as shown in figure. The time at which velocity of particle becomes equal to its initial velocity is

View SolutionThe x-t graph of a particle moving along a straight line is shown in figure

The v-t graph of the particle is correctly shown by
View SolutionThe x-t graph of a particle moving along a straight line is shown in figure
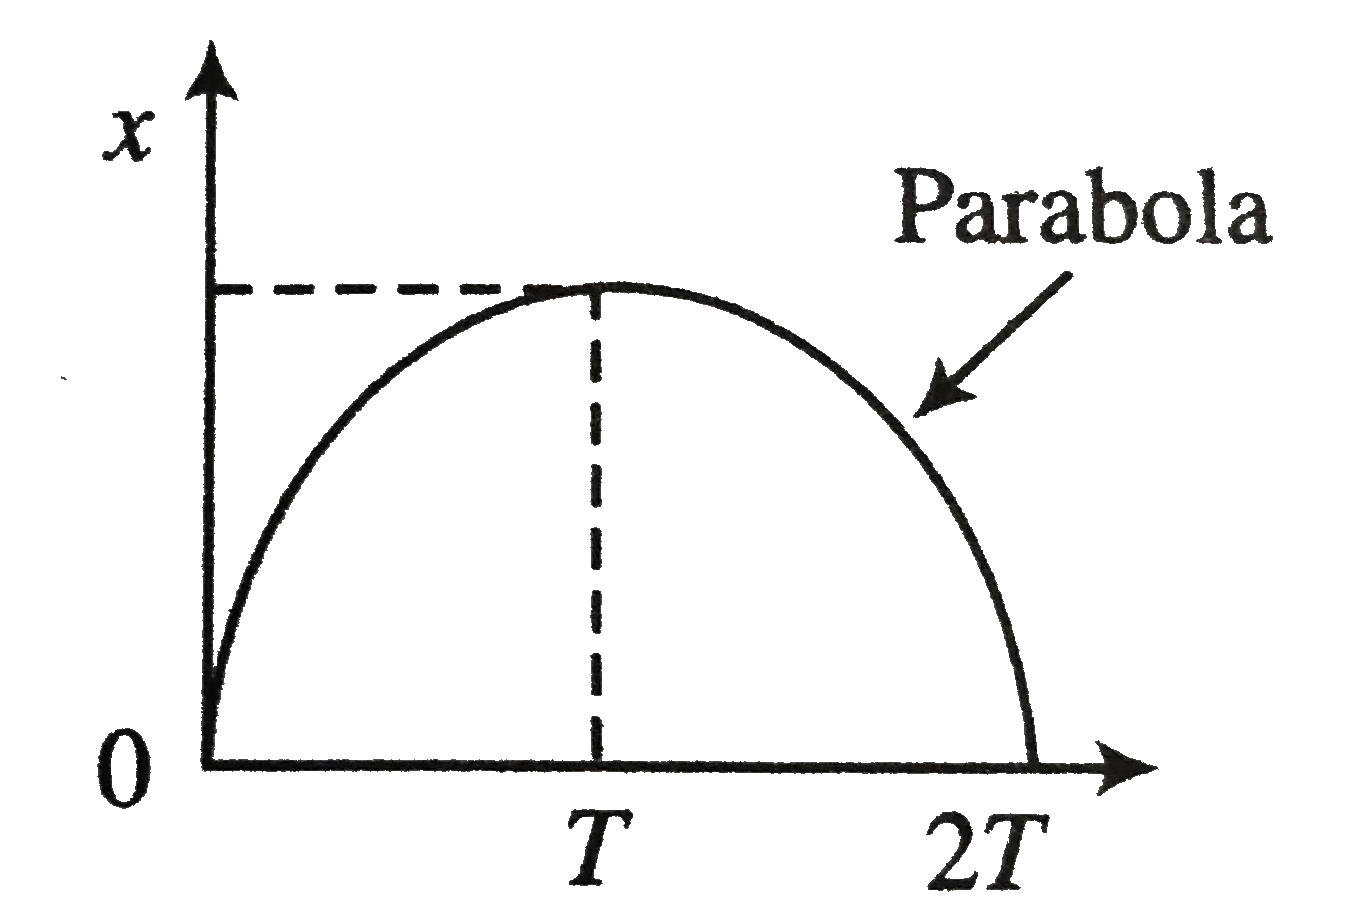
The a-t graph of the particle is correctly shown by
View Solution
The velocity displacement graph of a particle moving along a straight line is shown in figure.
Then the acceleration displacement graph is.
View Solution