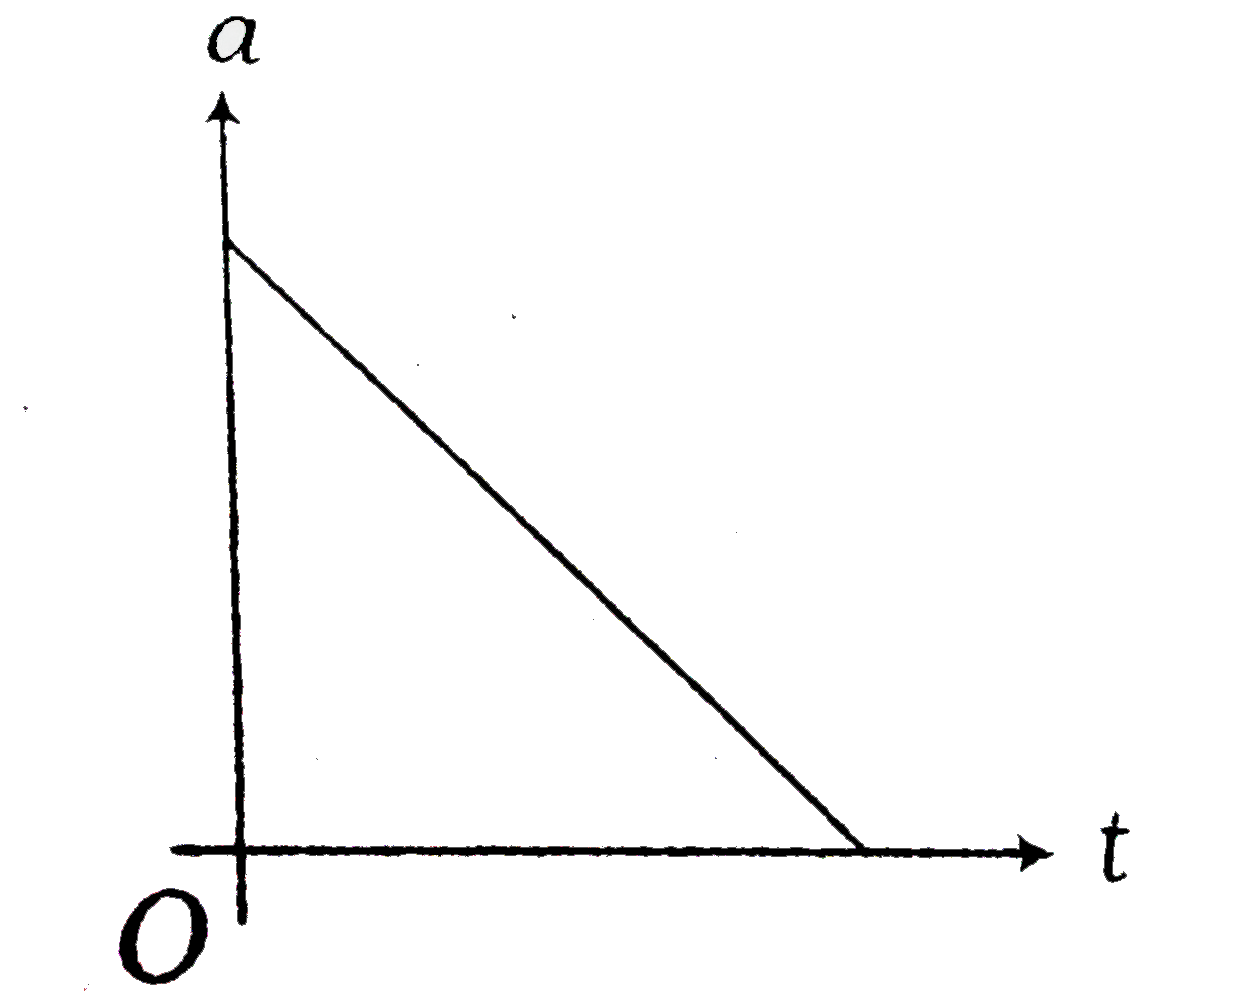
The acceleration (a)-time(t) graph for a particle moving along a straight from rest is shown in figure. Which of the following graph is the best representation of its velocity (v) with time (t) ?
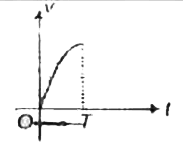
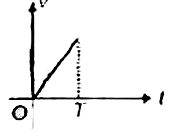
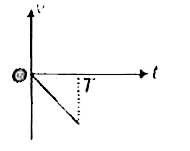
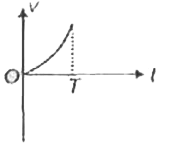
The correct Answer is:A
Step by step video & image solution for The acceleration (a)-time(t) graph for a particle moving along a straight from rest is shown in figure. Which of the following graph is the best representation of its velocity (v) with time (t) ? by Physics experts to help you in doubts & scoring excellent marks in Class 12 exams.
Topper's Solved these Questions
- BOOK - AAKASH INSTITUTE ENGLISHCHAPTER - MOTION IN A STRAIGHT LINEEXERCISE - ASSIGNMENT (SECTION - C)36videos
MOTION IN A STRAIGHT LINE
- BOOK - AAKASH INSTITUTE ENGLISHCHAPTER - MOTION IN A STRAIGHT LINEEXERCISE - ASSIGNMENT (SECTION - D)15videos
MOTION IN A STRAIGHT LINE
- BOOK - AAKASH INSTITUTE ENGLISHCHAPTER - MOTION IN A STRAIGHT LINEEXERCISE - ASSIGNMENT (SECTION - A)58videos
MOTION IN A STRAIGHT LINE
- BOOK - AAKASH INSTITUTE ENGLISHCHAPTER - MOTION IN A PLANEEXERCISE - Assignement section -J (Aakash Challengers Questions)7videos
MOTION IN A PLANE
- BOOK - AAKASH INSTITUTE ENGLISHCHAPTER - MOTION IN STRAIGHT LINEEXERCISE - Assignment (SECTION - J)2videos
MOTION IN STRAIGHT LINE
Similar Questions
The acceleration (a)-time(t) graph for a particle moving along a straight from rest is shown in figur. Which of the following graph is the best representation of its velocity (v) with time (t) ?
 View Solution
Displacement time graph of a particle moving in a straight line is a shown in figure.
 View Solution
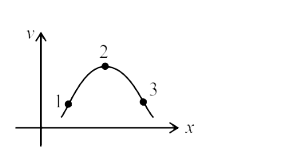
The v-x graph for a particle moving along a straight line is shown in the figure. At which of the points marked, the acceleration is negative?
 View Solution
The force acting on a particle moving along a straight line varies with time as shown in diagram.
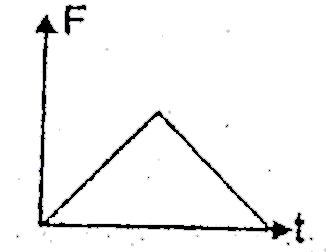
Which of the following graphs is best representative of its speed and time graphs. Initial velocity the particle is zero.View SolutionThe force acting on a particle moving along a straight line varies with time as shown in diagram.

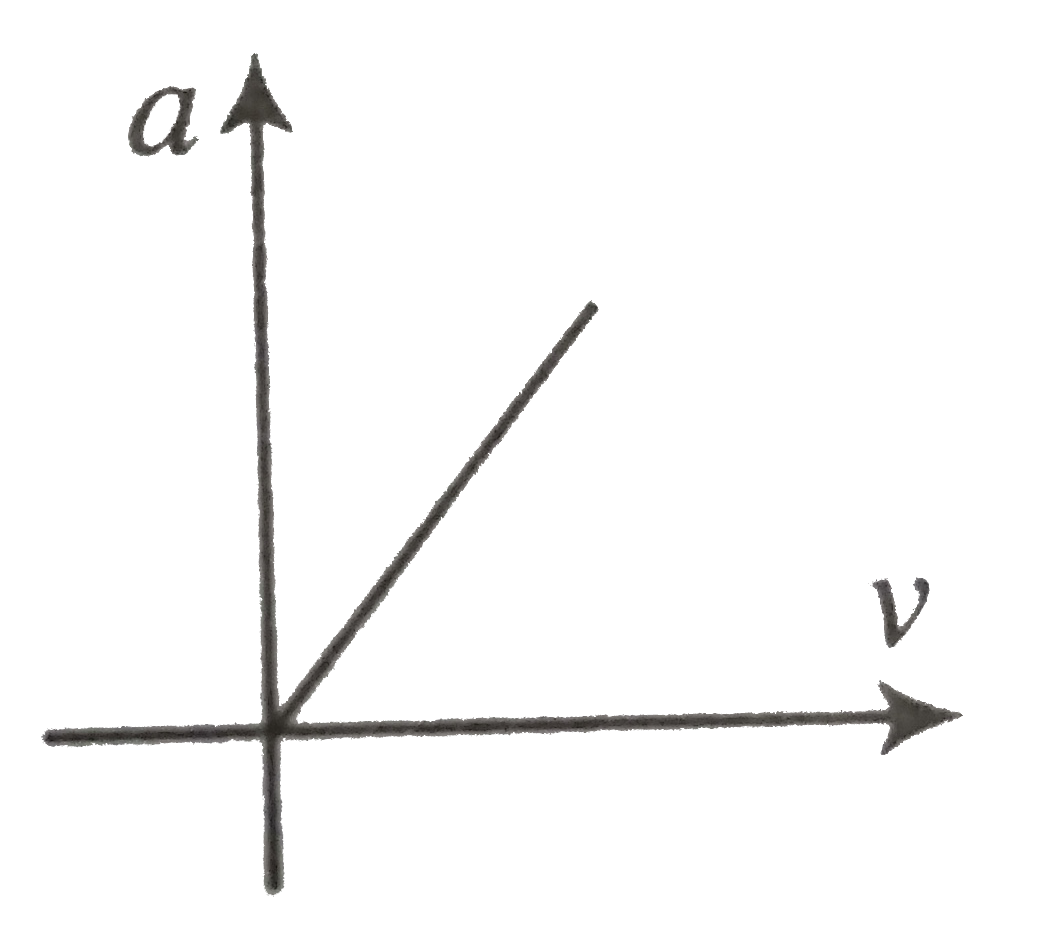
Which of the following graphs is best representative of its speed and time graphs. Initial velocity the particle is zero.View SolutionThe acceleration - velocity graph of a particle moving in a straight line is shown in figure. Then the slope of the velocity- displacement graph
 View Solution
The acceleration-time (a−t) graph of a particle moving along straight line is as shown in figure. The time at which velocity of particle becomes equal to its initial velocity is
 View Solution
The velocity displacement graph of a particle moving along a straight line is shown in figure.
Then the acceleration displacement graph is.View SolutionThe x-t graph of a particle moving along a straight line is shown in figure

The v-t graph of the particle is correctly shown byView SolutionThe x-t graph of a particle moving along a straight line is shown in figure
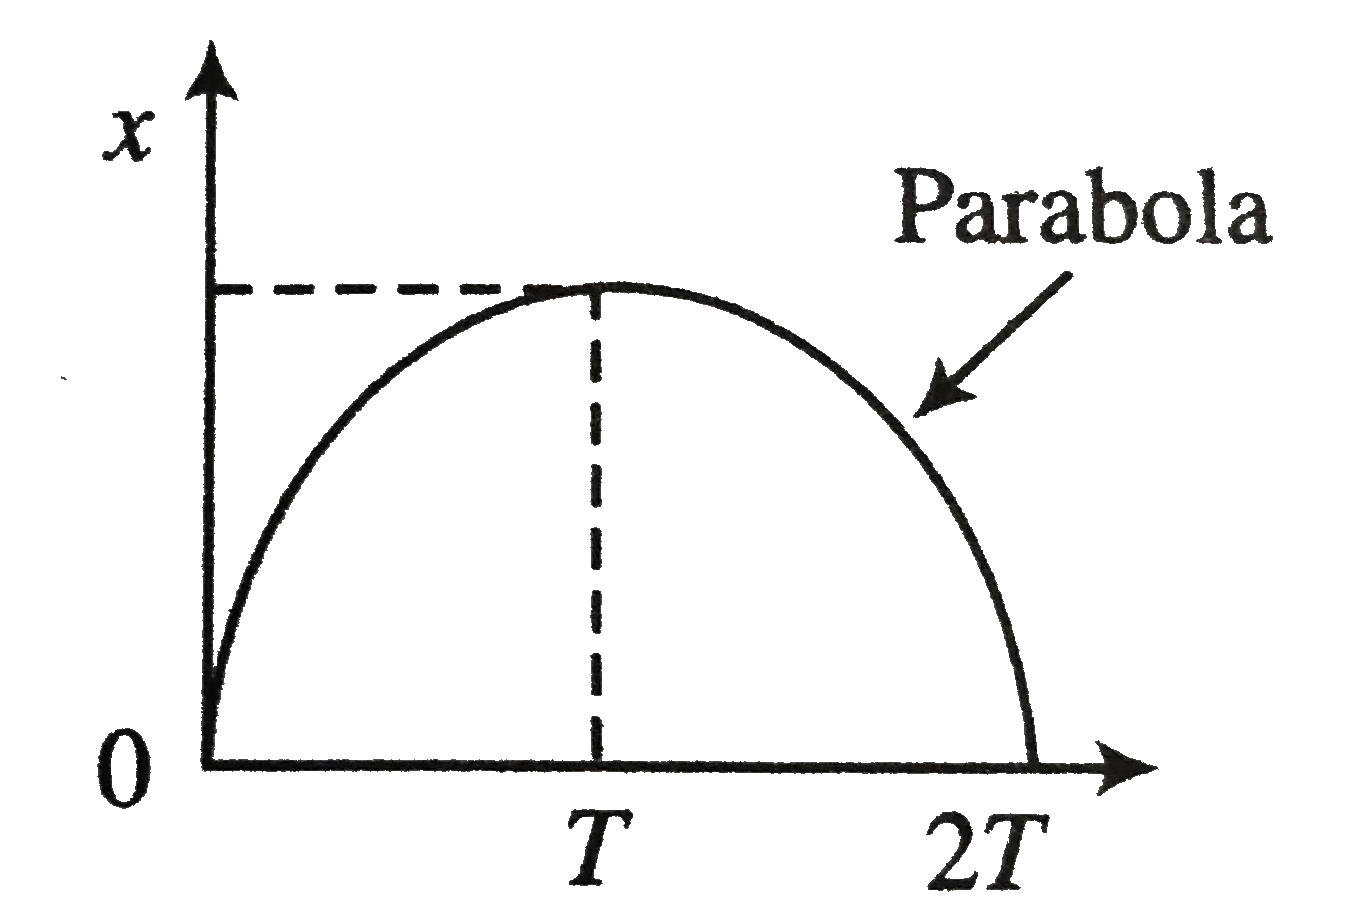
The a-t graph of the particle is correctly shown byView Solution

