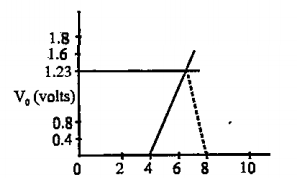
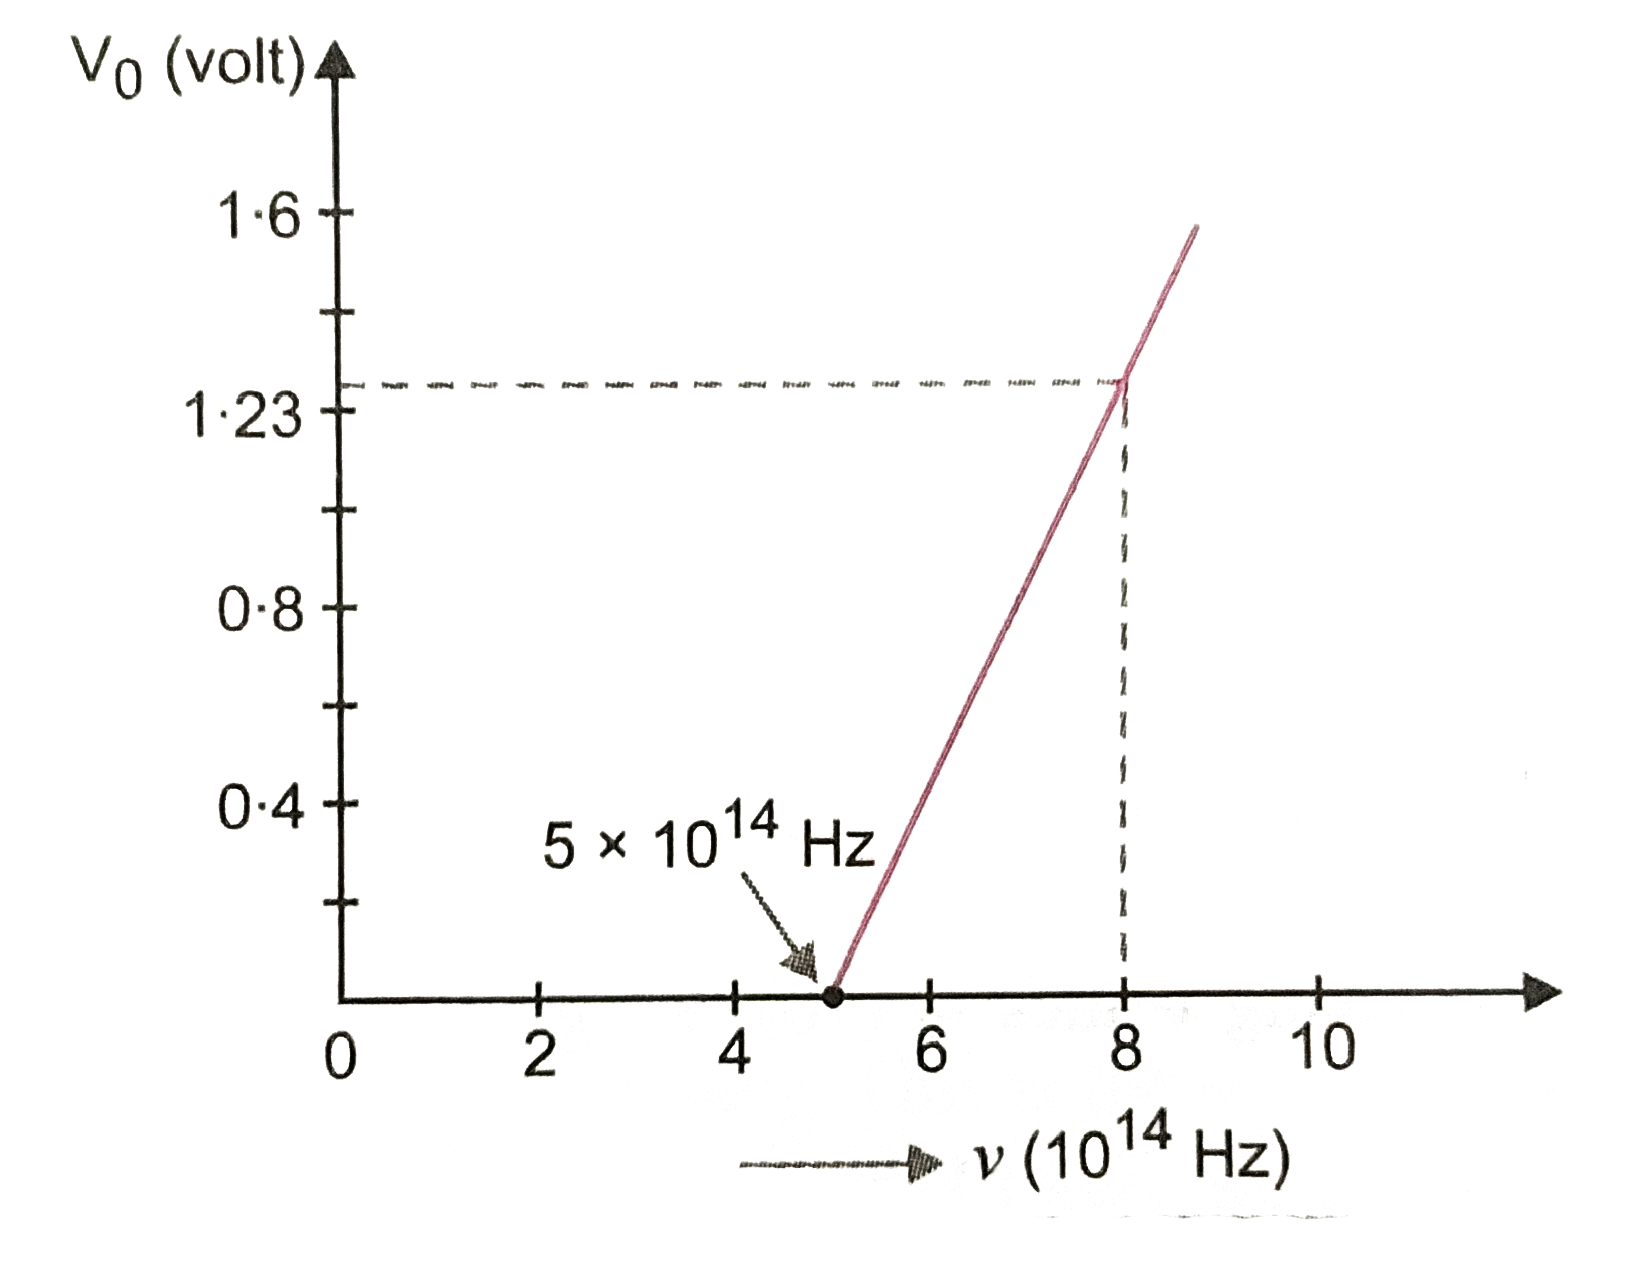
Using the graph as in figure for stopping potential vs the incident frequency of photons. Calculate plank's constant.

Text Solution
Einstein.s photoelectric equation is
eV0=hv−W0 on differentiation, we get eΔV0=hΔv
∴=ΔV0Δv=1.23−0(8−5)×1014×1.6×10−19Js=6.56×10⁻³⁴Js
|
Topper's Solved these Questions
Similar Questions
Knowledge Check
Figure shows the graph of stopping potential verus that frequency of a photosensitive metal. The plank's constant and work funcation of the metal are
_S01_035_Q01.png) A(V2+V1v2+v2)e,(V2v1+V1v2v2+v1)eB(V2+V1v2−v1)e,(V2v1+V1v2v2−v1)eC(V2−V1v2+v1)e,(V2v1−V1v2v2+v1)eD(V2−V1v2−v1)e,(V2v1−V1v2v2−v1)e
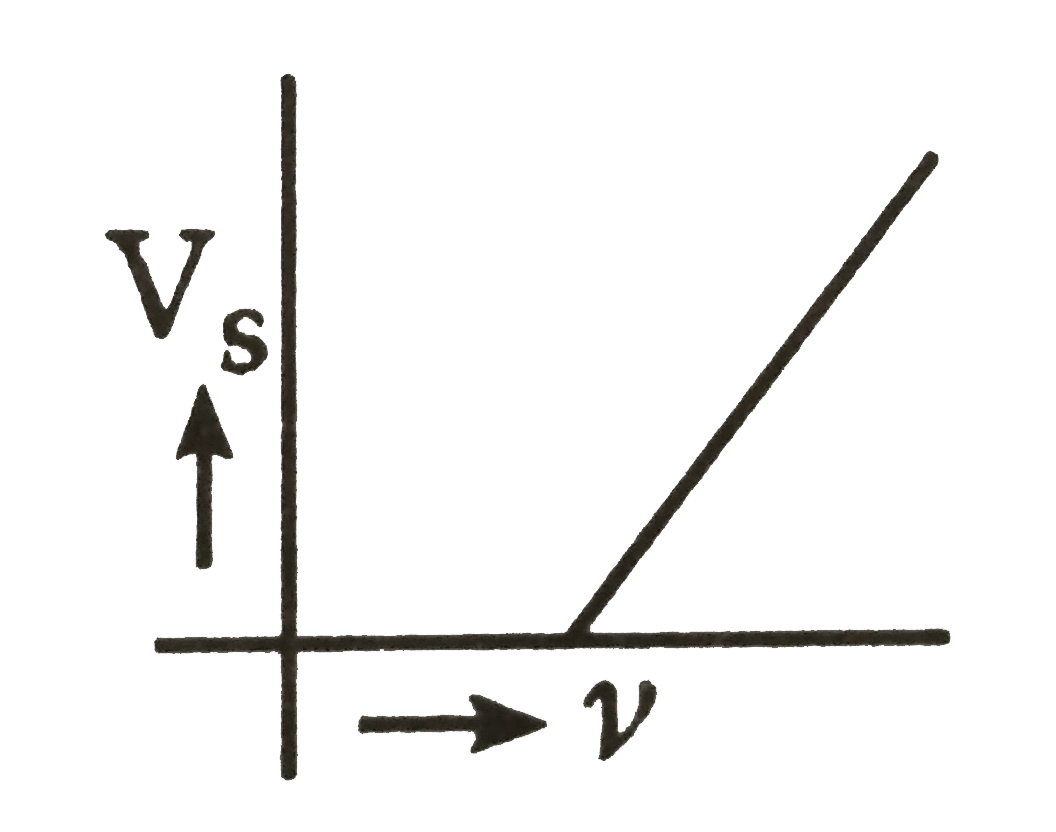
A(V2+V1v2+v2)e,(V2v1+V1v2v2+v1)eB(V2+V1v2−v1)e,(V2v1+V1v2v2−v1)eC(V2−V1v2+v1)e,(V2v1−V1v2v2+v1)eD(V2−V1v2−v1)e,(V2v1−V1v2v2−v1)eIn photoelectric effect the slope of straight line graph between stopping potential (Vs) and frequency of incident light (v) gives
 A10−14B5×10−14C4×10−15D4×10−34
In a photoelectric effect experiment, the slope of the graph between the stopping potential and the incident frequency will be :
A1B0.5C10−15D10−34
Figure shows the graph of stopping potential verus that frequency of a photosensitive metal. The plank's constant and work funcation of the metal are
_S01_035_Q01.png)
View SolutionThe slope of the graph drawn between stopping potential and frequency of incident radiation will be
View SolutionIn a photoelectric effect experiment, the slope of the graph between the stopping potential and the incident frequency will be :
View SolutionIn photoelectric effect the slope of stop of stopping potential versus frequency of incident light for a given surface will be
View SolutionIn photo electric effect, the slope of the straight line graph between stopping potential and frequency of the incident light gives the ratio of Planck's constant to
View Solution

