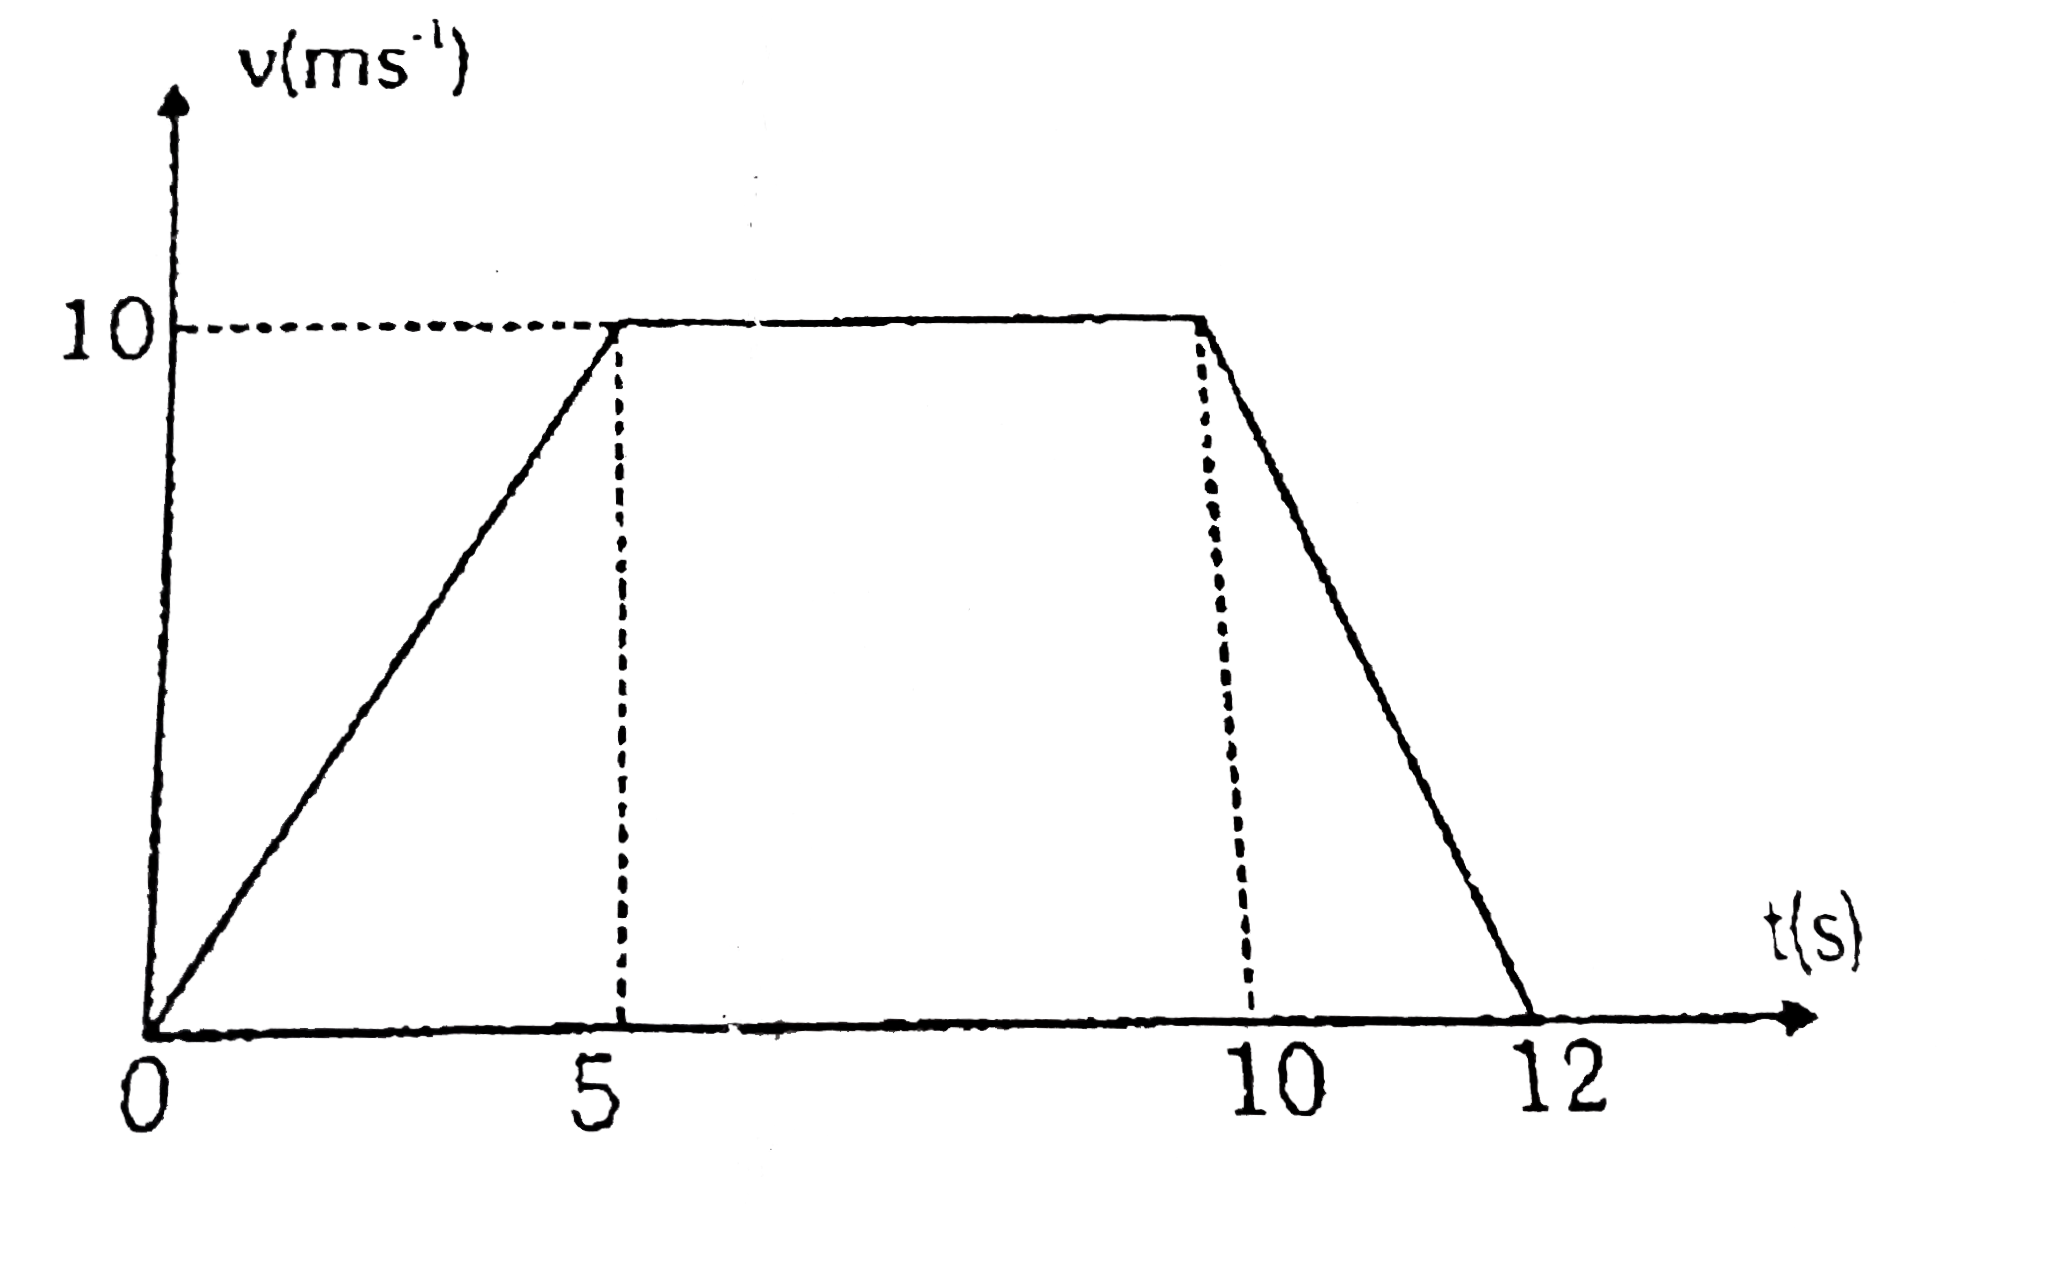
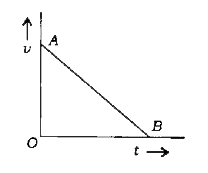
4 sets of graphs one given. Each set consists of a displacement-time(s-t), velocity-time(v-t) & acceleration time (a-t) graph. Which set correctly illustrates all 3 graphs.


To solve the problem of identifying which set of graphs correctly illustrates the displacement-time (s-t), velocity-time (v-t), and acceleration-time (a-t) relationships, we can follow these steps:
Step 1: Analyze the Acceleration-Time Graph
- Start by examining the acceleration-time graph provided in each option.
- If the acceleration is constant (horizontal line), it indicates that the velocity is changing at a constant rate.
Step 2: Determine the Velocity-Time Graph
- If the acceleration is constant and positive, the velocity-time graph will be a straight line with a positive slope. This means that the velocity is increasing linearly over time.
- If the acceleration is constant and negative, the velocity-time graph will also be a straight line, but with a negative slope, indicating that the velocity is decreasing linearly over time.
Step 3: Derive the Displacement-Time Graph
- The displacement-time graph is derived from the velocity-time graph. If the velocity is increasing linearly (positive slope), the displacement-time graph will be a curve that opens upwards (parabolic shape).
- If the velocity is constant, the displacement-time graph will be a straight line.
- If the velocity is decreasing linearly (negative slope), the displacement-time graph will also be a curve, but it will open downwards.
Step 4: Compare Each Option
- For each option, check if the acceleration-time graph is constant and what its value is.
- Based on the acceleration, determine the expected shape of the velocity-time graph and then the displacement-time graph.
- Make sure that all three graphs are consistent with each other.
Step 5: Identify the Correct Set
- After analyzing all options, identify which set of graphs maintains consistency across the three types of graphs (a-t, v-t, s-t).
- The correct option should have:
- A constant acceleration leading to a linear increase in velocity.
- A displacement graph that is a curve if velocity is changing.
Conclusion
After analyzing all four options based on the steps above, the correct answer is Option 1. This option correctly illustrates that if the acceleration is constant, the velocity will increase linearly, and the displacement will be a curve.
---
- Start by examining the acceleration-time graph provided in each option.
- If the acceleration is constant (horizontal line), it indicates that the velocity is changing at a constant rate.
- If the acceleration is constant and positive, the velocity-time graph will be a straight line with a positive slope. This means that the velocity is increasing linearly over time.
- If the acceleration is constant and negative, the velocity-time graph will also be a straight line, but with a negative slope, indicating that the velocity is decreasing linearly over time.
- The displacement-time graph is derived from the velocity-time graph. If the velocity is increasing linearly (positive slope), the displacement-time graph will be a curve that opens upwards (parabolic shape).
- If the velocity is constant, the displacement-time graph will be a straight line.
- If the velocity is decreasing linearly (negative slope), the displacement-time graph will also be a curve, but it will open downwards.
- For each option, check if the acceleration-time graph is constant and what its value is.
- Based on the acceleration, determine the expected shape of the velocity-time graph and then the displacement-time graph.
- Make sure that all three graphs are consistent with each other.
- After analyzing all options, identify which set of graphs maintains consistency across the three types of graphs (a-t, v-t, s-t).
- The correct option should have:
- A constant acceleration leading to a linear increase in velocity.
- A displacement graph that is a curve if velocity is changing.
After analyzing all four options based on the steps above, the correct answer is Option 1. This option correctly illustrates that if the acceleration is constant, the velocity will increase linearly, and the displacement will be a curve.
Topper's Solved these Questions
- JEE MAIN 2021BOOK - JEE MAINS PREVIOUS YEARCHAPTER - JEE MAIN 2021EXERCISE - SECTION-A
80 Videos
- JEE MAIN 2021BOOK - JEE MAINS PREVIOUS YEARCHAPTER - JEE MAIN 2021EXERCISE - SECTION-B
40 Videos
- JEE MAINBOOK - JEE MAINS PREVIOUS YEARCHAPTER - JEE MAINEXERCISE - All Questions
473 Videos
- JEE MAIN 2022BOOK - JEE MAINS PREVIOUS YEARCHAPTER - JEE MAIN 2022EXERCISE - Question
492 Videos
Similar Questions
Knowledge Check
The area under the acceleration-time (a-t) graph gives
AAccelerationBDisplacementCVelocityDChange in velocityDisplacement x at time t is x=t−t3. If v is the velocity and a the acceleration at time t, then :v =
A12at2B1+12atCaxDa+12tFor a given acceleration − time graph, there exist ………………………… velocity − time graph
A1B2C3Dmany
Draw displacement time and acceleration -time graph for the given velocity-time graph

View SolutionGraphs based on Displacement time|Velocity time|Acceleration time|Acceleration displacement|Acceleration velocity
View SolutionGraphs based on Displacement time|Velocity time|Acceleration time|Acceleration displacement|Acceleration velocity
View SolutionWhich of the following can be a closed curve? Give one example each.
(i) Velocity-time graph
(ii) Displacement-time graph
(iii) Acceleration-time graph
(iv) Velocity-displacement graph
View SolutionA body falls from same height and return back to initial position Draw displacement ˆs-time (t), distance (s) - time (t) and velocity ˆV-time (t), speed (v), time (t) and acceleration ˆa-time (t) graphs for the motion of the body
View Solution

