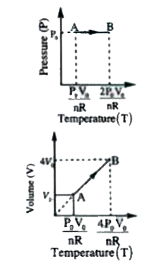
Draw the P-T and V-T diagrams for an isobaric process of expansion, corresponding to n moles of an ideal gas at a pressure P0, from V0 to 2V0.
For the graph pf P versus T the variation is a straight line normal to the pressure axis, the temperature varying from T1 to T2 as shown figure.
From the gas equation PV=nRT
we have, V=[nRP0]TorV∝T
At V=V0,T1=P0V0nR
and at V=2V0,T2=2P0V0nR From the graph of V versus T, the equation V=[nRP0]T or V=KT shows that the volume varies directly, as the temperature (Charless. law). So, the graph is a straight line inclined to the (V−T) axis, and passing through the origin (whenproduced) as shown in figure.

Topper's Solved these Questions
- BOOK - AAKASH SERIESCHAPTER - THERMODYNAMICSEXERCISE - EXERCISE - 1A135videos
THERMODYNAMICS
- BOOK - AAKASH SERIESCHAPTER - THERMODYNAMICSEXERCISE - EXERCISE - 1B32videos
THERMODYNAMICS
- BOOK - AAKASH SERIESCHAPTER - THERMODYNAMICSEXERCISE - QUESTIONS FOR DESCRIPTIVE ANSWERS7videos
THERMODYNAMICS
- BOOK - AAKASH SERIESCHAPTER - THERMAL PROPERTIES OF MATTEREXERCISE - ADDITIONAL PRACTICE EXERCISE (LEVEL - II) PRACTICE SHEET (ADVANCED) Integer/Subjective Type Questions2videos
THERMAL PROPERTIES OF MATTER
- BOOK - AAKASH SERIESCHAPTER - THERMOMETRY EXERCISE - Numerical Exercise (LEVEL- 1)11videos
THERMOMETRY
Similar Questions
Draw the P-T and V-T diagrams for an isobaric process of expansion, corresponding to n moles of an ideal gas at pressure P0 from V0 to 2V0
View SolutionDraw the P-T and V-T diagrams for an isobabaric process of expansion, corresponding to n moles of an ideal gas at pressure P0 from V0 to 2V0
View Solution
Knowledge Check
- Question 1 - Select One
Thermal coefficient of volume expansion at constant pressure for an ideal gas sample of n moles having pressure P0, volume V0, and temperature T0 is
ARP0V0BP0V0RC1T0D1nT0 - Question 2 - Select One
Pressure of an ideal gas is given by
P=P0=[1−12(V0V)2]AP0V03RB5P0V04RC4P0V0RD3P0V0R
Draw the P-T and V-T diagrams of an isochoric process of n moles an ideal gas from pressure P0 volume V0 to pressure 4P0, indicating the pressures and temperatures of the gas in the initial and the final states.
View SolutionDraw the P-T and V-T diagrams of an isochoric process of n moles an ideal gas from pressure P0 volume V0 to pressure 4P0, indicating the pressures and temperatures of the gas in the initial and the final states.
View SolutionPlot (p - V),(V - T) and (ρ - T) graph corresponding to the (p - T) graph for an ideal gas shown in figure.
 .View Solution
A Cycle process ABCA shown in V-T diagram Fig. is preformed with a constant mass of an ideal gas. Show the same process on a P-V diagram.
View SolutionOne mole of an ideal monoatomic gas undergoes the process T=T0+4V, where T0 is initial temperature. Find
(i) Heat capacity of gas as function of its volume.
(ii) The amount of heat transferred to gas if its volume increases from V0 to 4V0.View SolutionOne mole of an ideal monoatomic gas undergoes the process T=T0+4V, where T0 is initial temperature. Find
(i) Heat capacity of gas as function of its volume.
(ii) The amount of heat transferred to gas if its volume increases from V0 to 4V0.View Solution

