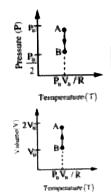
Draw the P-T and V-T diagrams for an isothermal process, corresponding to one mole of an ideal gas at an initial pressure and volume P0 and V0 respectively, expanding to a volume 2V0. Solution in Telugu
The temperature T during the process is, evidently, given by T=P0V0R (for one mole)
Also, for an isothermal process PV = constant
∴P0V0=P2(2V0)orP2=P02

The P-T graph is a straight line parallel to the pressure axis, with pressure decreasing from P0 to P0/2 as shown in figure.
(b) The V-T graph is also a straight line parallel to the volume axis, with volume increasing from V0 to 2V0 as shown in figure.
Similar Questions
Draw the P-T and V-T diagrams for an isobaric process of expansion, corresponding to n moles of an ideal gas at a pressure P0, from V0 to 2V0.
View SolutionDraw the P-T and V-T diagrams for an isothermal process, corresponding to one mole of an ideal gas at an initial pressure and volume P_(0) and V_(0) respectively, expanding to a volume 2V_(0) .
View SolutionDraw the P-T and V-T diagrams of an isochoric process of n moles of an ideal gas from pressure P0, volume V0 to pressure 4P0, indicating the pressures, and temperatures, of the gas, in the initial and the final states.
View SolutionDraw the P-T and V-T diagrams for an isobaric process of expansion, corresponding to n moles of an ideal gas at a pressure P0, from V0 to 2V0.
View SolutionOne mole of an ideal gas undergoes a process p=(p_(0))/(1+((V_(0))/(V))^(2)) . Here, p_(0) and V_(0) are constants. Change in temperature of the gas when volume is changed from V=V_(0) to V=2V_(0) is
View SolutionDraw the P-T and V-T diagrams of an isochoric process of n moles an ideal gas from pressure P0 volume V0 to pressure 4P0, indicating the pressures and temperatures of the gas in the initial and the final states.
View SolutionDraw the P-T and V-T diagrams for an isobabaric process of expansion, corresponding to n moles of an ideal gas at pressure P0 from V0 to 2V0
View Solution
