Shape of graph drawn between rate of decay and number of radio active nuclei is
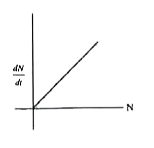
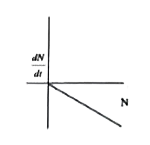
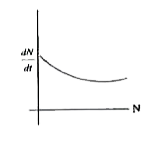
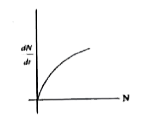
The correct Answer is:B
Similar Questions
Knowledge Check
The graph showing the variation of decay rate with number of nuclei is:
A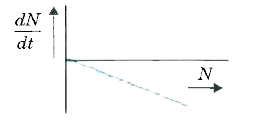 B
B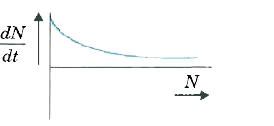 C
C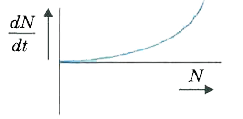 D
D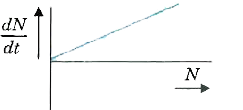
The graph between number of decayed atoms N' of a radioactive element and time t is.
A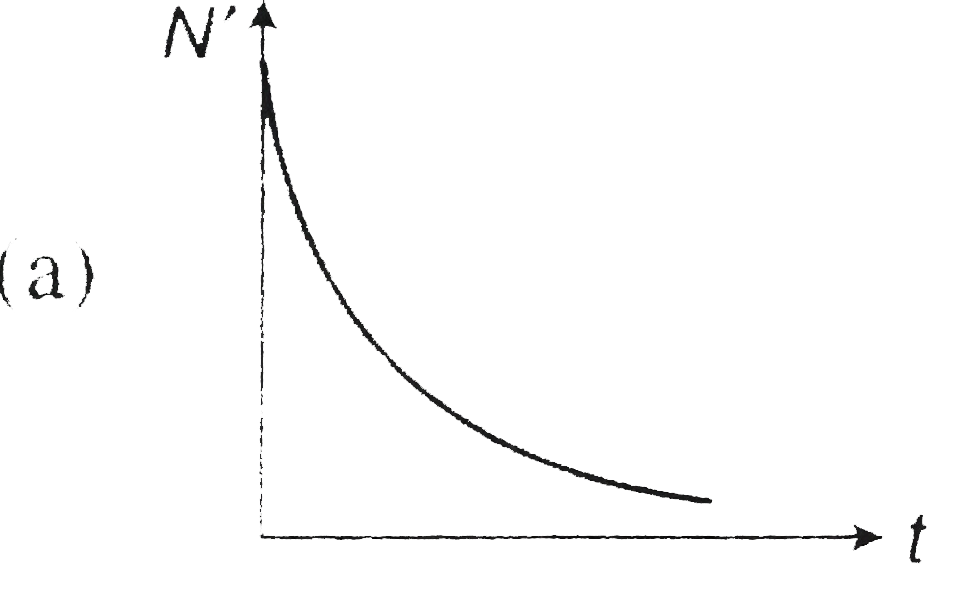 .B
.B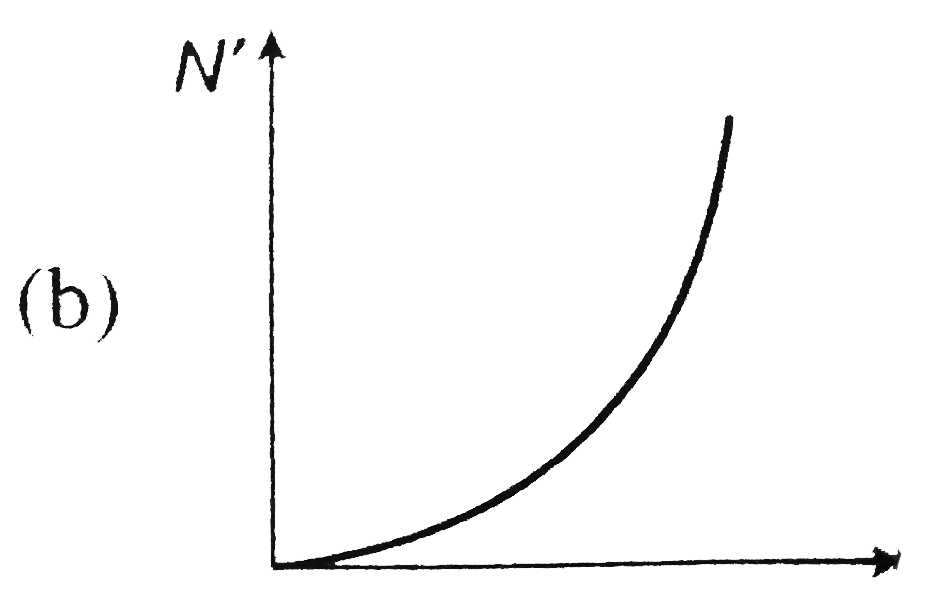 .C
.C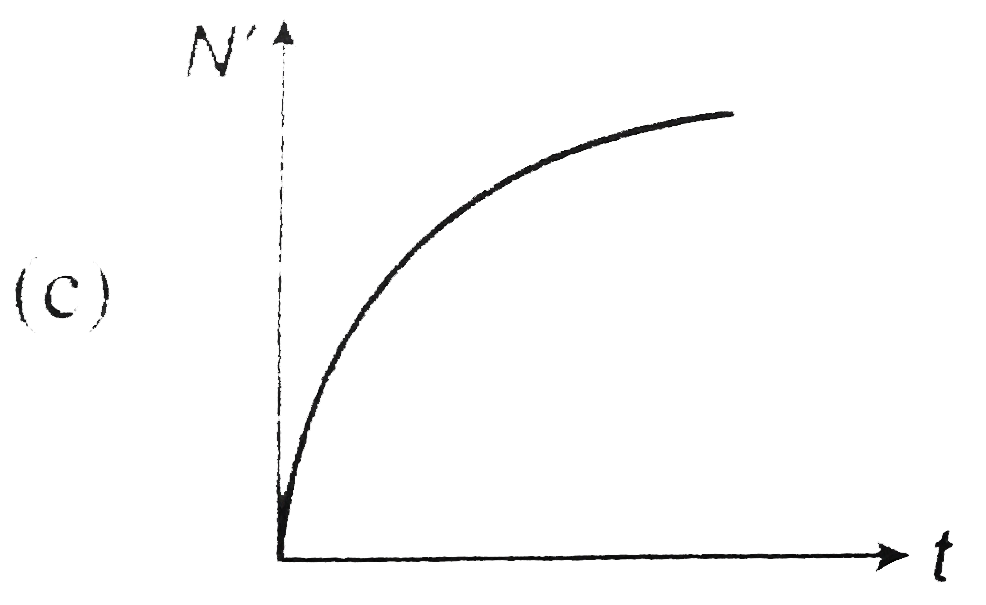 .D
.D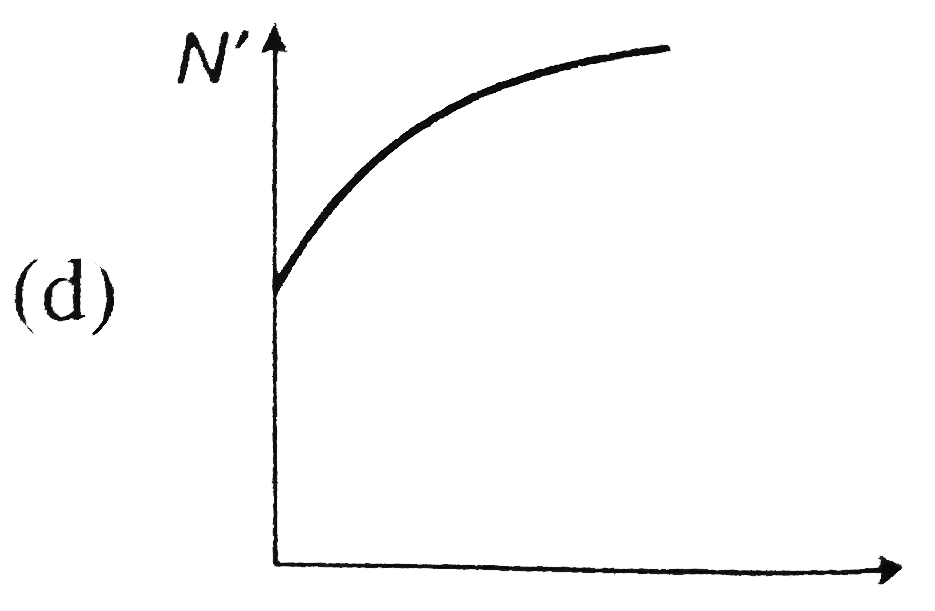 .
.
Draw a graph showing the variation of decay rate with number of active nuclei.
View SolutionShow that the decay rate R of a sample of radionuclide is related to the number of radioactive nuclei N at the same instant by the expression R=λN.
View SolutionDraw a graph showing the variation of decay rate (−dNdt) with number (N) of radioactive nuclei.
View SolutionShow that the decay rate R of a sample of radionuclide is related to the number of radioactive nuclei N at the same instant by the expression R=λN.
View SolutionThe rate at which a particular decay process occurs in a radio sample, is proportional to the number of radio active nuclei present . If N is the number of radio active nuclei present at some instant, the rate of change of N is dNdt=−λN. Consider radioactive decay of A to B which may further decay either to X or to Y, λ1,λ2andλ3 are decay constants for A to B decay , B to X decay and B of Y decay respectively. if at t=0 number of nuclei of A,B , X and Y are N0,N0,zero and zero respectively
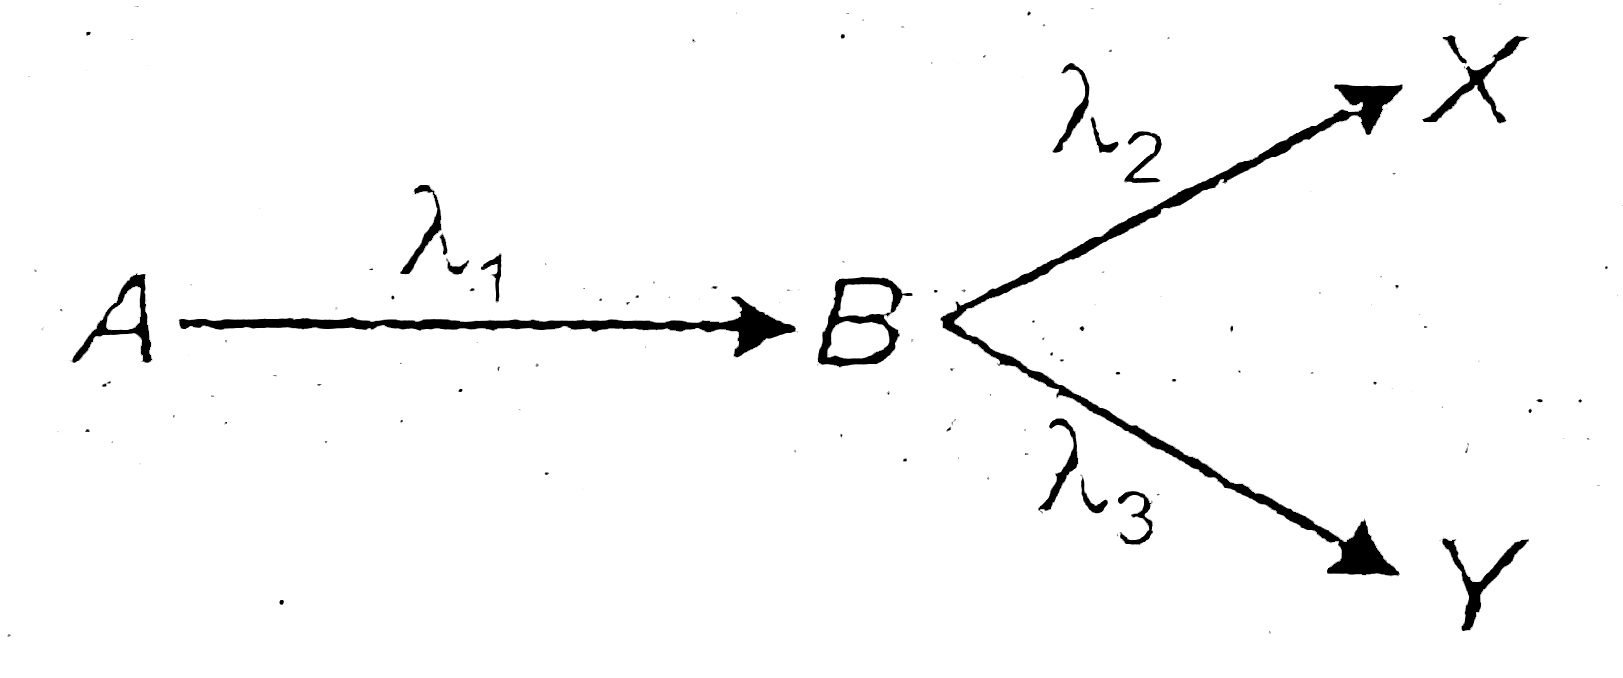
and N1,N2,N3,N4 are number of nuclei A,B , X and Y at any instant.
The number of nuclei of B will first increase then after a maximum value, it will decreases, if
View SolutionThe rate of biomass production by consumers is called :
View Solution
